Article Text

Abstract
Objective Capsule endoscopy (CE) is pivotal for evaluation of small bowel disease. Obscure gastrointestinal bleeding most often originates from the small bowel. CE frequently identifies a wide range of lesions with different bleeding potentials in these patients. However, reading CE examinations is a time-consuming task. Convolutional neural networks (CNNs) are highly efficient artificial intelligence tools for image analysis. This study aims to develop a CNN-based model for identification and differentiation of multiple small bowel lesions with distinct haemorrhagic potential using CE images.
Design We developed, trained, and validated a denary CNN based on CE images. Each frame was labelled according to the type of lesion (lymphangiectasia, xanthomas, ulcers, erosions, vascular lesions, protruding lesions, and blood). The haemorrhagic potential was assessed by Saurin’s classification. The entire dataset was divided into training and validation sets. The performance of the CNN was measured by the area under the receiving operating characteristic curve, sensitivity, specificity, positive predictive value (PPV), and negative predictive value (NPV).
Results A total of 53 555 CE images were included. The model had an overall accuracy of 99%, a sensitivity of 88%, a specificity of 99%, a PPV of 87%, and an NPV of 99% for detection of multiple small bowel abnormalities and respective classification of bleeding potential.
Conclusion We developed and tested a CNN-based model for automatic detection of multiple types of small bowel lesions and classification of the respective bleeding potential. This system may improve the diagnostic yield of CE for these lesions and overall CE efficiency.
- gastrointestinal bleeding
- endoscopy
- inflammatory bowel disease
Data availability statement
All data relevant to the study are included in the article or uploaded as supplementary information.
This is an open access article distributed in accordance with the Creative Commons Attribution Non Commercial (CC BY-NC 4.0) license, which permits others to distribute, remix, adapt, build upon this work non-commercially, and license their derivative works on different terms, provided the original work is properly cited, appropriate credit is given, any changes made indicated, and the use is non-commercial. See: http://creativecommons.org/licenses/by-nc/4.0/.
Statistics from Altmetric.com
Summary box
What is already known about this subject?
Obscure gastrointestinal bleeding is the most common indication for capsule endoscopy (CE).
Reading CE examinations is a burdensome task with risk of missing significant lesions and previous studies have demonstrated the value of artificial intelligence (AI) for automatic identification of lesions in CE images.
What are the new findings?
An AI algorithm was developed for automatic detection and characterisation of multiple types of CE findings with distinct bleeding potential.
For the first time, a convolutional neural network model was developed for characterisation of the bleeding potential of multiple CE findings.
How might it impact on clinical practice in the foreseeable future?
The AI model developed in this study may contribute to increase the diagnostic rentability of CE.
Enhanced diagnostic capacity may allow to earlier treatments with impact on patient outcomes.
Introduction
The small bowel is an area of difficult endoscopic inspection. Capsule endoscopy (CE) provides minimally invasive evaluation of the small bowel mucosa. CE is essential for detection of several small bowel mucosal abnormalities, including blood content, vascular lesions (eg, angiectasia), ulcers, or erosions, as well as protruding lesions. The clinical value of CE has been demonstrated for a wide array of diseases, including the evaluation of patients with suspected small bowel haemorrhage, diagnosis and monitoring of Crohn’s disease activity and detection of protruding small intestinal lesions.1–4 Nevertheless, reading CE videos is a burdensome task.5–7 Each CE video produces approximately 50 000 images, with a time cost of 30–120 min.8
Obscure gastrointestinal bleeding (OGIB) is the most common indication for CE, as in most cases the bleeding source is in the small bowel.9 10 A classification of the bleeding potential of multiple CE findings has been proposed by Saurin et al.11 This classification divides CE findings in the following three categories: no bleeding potential—P0; uncertain/intermediate bleeding potential—P1; and high bleeding potential—P2. The latter category includes large ulcers, angiectasia, and varices, whereas small, isolated ulcers, and mucosal red spots are P1 lesions.11 The detection and reliable classification of the bleeding potential of any given lesion is essential to guide the management for patients with OGIB. Nevertheless, the diagnostic yield of CE for the culprit lesion is poor (approximately 60%) and classification of the bleeding potential according to the Saurin’s classification has a suboptimal interobserver agreement (approximately 60%).10 11
Recently, artificial intelligence (AI) models have demonstrated high performance levels in the interpretation of medical images.12 13 The application of deep learning algorithms to endoscopic imaging has shown potential for increasing the detection rate of lesions.14 15 Several proof-of-concept studies have demonstrated the potential of the application of these tools for enhanced analysis of CE images, with reports of high-performance levels for the detection of a wide array of lesions, including blood content, angiectasia, ulcers, and protruding lesions.16–20 Nevertheless, to date, no AI algorithm has been developed for detection of a wide array of lesions and their classification according to their bleeding potential. This study aimed to develop an AI system based on a convolutional neural network (CNN) for automatic detection and classification of the bleeding potential of common findings in CE images.
Methods
Study design
A multicentric study was conducted for the development and validation of a CNN for automatic detection and differentiation of several types of enteric lesions in CE examinations. CE examinations were retrospectively collected from two gastroenterology centres: Centro Hospitalar Universitário de São João (Porto, Portugal) and ManopH Gastroenterology Clinic (Porto, Portugal). Patients submitted to CE at two gastroenterology centres (São João University Hospital, Porto, Portugal) between 2015 and 2020 were included in this retrospective study. Data from these examinations were used for development, training, and validation of a CNN-based model for automatic detection of multiple CE findings and differentiation according to their bleeding potential. The full-length CE video of all participants was reviewed. A total of 53 555 images of the enteric mucosa were ultimately extracted. The types of lesions admitted for analysis were lymphangiectasia, xanthomas, vascular lesions (including red spots, angiectasia, and varices), ulcers, erosions, protruding lesions (polyps, epithelial tumours, subepithelial lesions, and nodules), and luminal blood. The findings represented on the frames were labelled by three experienced gastroenterologists (MMS, HC, and APA). Each of these researchers had read >1500 CE examinations prior this study. The inclusion and final labelling of the frames was dependent on the agreement of at least two of the three specialists.
This study was conducted in a retrospective and was of non-interventional nature, respecting the declaration of Helsinki. Therefore, there was no interference in the conventional clinical management of each included patient. Any information deemed to potentially identify the subjects was omitted, and each patient was assigned a random number to ensure effective data anonymisation for researchers involved in CNN network development. A team with Data Protection Officer certification (Maastricht University) confirmed the non-traceability of data and conformity with the general data protection regulation.
CE protocol
CE procedures were conducted using the following two different CE systems: the PillCam SB3 system (Medtronic, Minneapolis, MN, USA) and the OMOM HD (Jinshan Science & Technology Co, Chonqing, Yubei, China). Both systems include the following three major components: the endoscopic capsule, a sensor belt connected to a data recorder, and a software for image revision. The Pillcam SB3 capsule measures 26.2 mm in length and 11.4 mm in width. It has a high-resolution camera with reported 156° field of view. The capture frame rate automatically varies between 2 and 6 frames per second, depending on the speed of progression of the endoscopic capsule. The estimated battery life of this capsule is of ≥8 hours. The images were reviewed using PillCam Software version 9 (Medtronic). On the contrary, the OMOM HD capsule measures 27.9 mm in length and 13.0 mm in width. It has a reported field of view of 172°. This system has an adaptive frame rate varying from 2 to 10 frames per second. The images from this capsule system were reviewed using the Vue Smart Software (Jinshan Science & Technology Co). All obtained images underwent processing to assure that possible identifying information (name, operating number, and date of procedure). Each extracted frame was stored and assigned a consecutive number.
Each patient received bowel preparation in agreement with previously published guidelines by the European Society of Gastrointestinal Endoscopy.21 Summarily, patients were recommended to have a clear liquid diet in the day preceding capsule ingestion, with fasting in the night before examination. A bowel preparation consisting of 2 litres of polyethylene glycol solution was used prior to the capsule ingestion. Simethicone was used as an antifoaming agent. Prokinetic therapy (10 mg domperidone) was used if the capsule remained in the stomach 1 hour after ingestion, on image review on the data recorder worn by the patient. No eating was allowed for 4 hours after the ingestion of the capsule.
Categorisation of lesions
Each frame was evaluated for the presence of a wide range of lesions of the enteric mucosa. Lymphangiectasia were defined as scattered whitish spots of the intestinal mucosa; xanthomas were defined as plaque-like lesions with whitish/yellowish appearance. Vascular lesions included red spots, angiectasia, and varices. Red spots were defined as punctuate (<1 mm) flat lesion with a bright red area, within the mucosal layer, without vessel appearance22; angiectasia were defined as well-demarcated bright red lesions consisting of tortuous and clustered capillary dilatations, within the mucosal layer. Varices were defined as raised venous dilatation with serpiginous appearance. Mucosal erosions were defined as minimal loss of epithelial layering surrounded by normal mucosa and with a diameter <5 mm. On the contrary, ulcers were defined as depressed loss of epithelial covering, with a whitish base and surrounding swollen mucosa. Protruding lesions included polyps, epithelial tumours, subepithelial lesions, and nodules.
The haemorrhagic potential of these lesions was ascertained according to Saurin’s classification.11 This classification divides lesions into three levels of bleeding risk, P0, P1, and P2, for lesions without, intermediate or high haemorrhagic potential, respectively. Lymphangiectasia and xanthomas were classified as P0 lesions. Red spots were considered P1 lesions, whereas angiectasia and varices were classified as P2.11 According to this classification, mucosal erosions were classified as P1 lesions. The haemorrhagic potential of ulcers depended on their size: small ulcers were regarded as P1 lesions; large ulcerations (>20 mm) were regarded as P2 lesions.11 23 Protruding lesions were considered as P2 when large (≥10 mm), ulcerated or when haemorrhagic stigmata were present. These lesions were classified as P1 when small (<10 mm) and with intact overlying mucosa (eg, subepithelial lesions).
Development of the CNN
The methods for this study have been described elsewhere.24 From the collected pool of images (n=53 555), 18 010 contained normal enteric mucosa. The distribution of the remaining images is shown in figure 1. This pool of images was split for constitution of training and validation image sets. The training dataset was composed by selecting the 80% of the consecutively extracted images (n=42 844). The remaining 20% were used as the validation dataset (n=10 711). The validation data set was used for assessing the performance of the CNN. A flowchart summarising the study design and image selection for the development (training and validation) of the CNN is presented in figure 1.

Study flowchart for the training and validation phases. P0L: lymphangiectasia; P0X: xanthomas; P1E: mucosal erosions; P1U: P1 ulcers; P2U: P2 ulcers; P1RS: P1 red spots; P2V: P2 vascular lesions; P1P: P1 protruding lesions; P2P: P2 protruding lesions. The prefixes P0, P1, and P2 refer to the haemorrhagic potential according to Saurin’s classification. AUROC, area under the receiving operator characteristic curve.
To create the denary CNN, we used the Xception model with its weights trained on ImageNet (a large-scale image dataset aimed for use in development of object recognition software). To transfer this learning to our data, we kept the convolutional layers of the model. We removed the last fully connected layers and attached fully connected layers based on the number of classes we used to classify our endoscopic images (10). We used two blocks, each having a fully connected layer followed by a dropout layer of 0.3 drop rate. Following these two blocks, we add a dense layer with a size defined as the number of categories (three) to classify. The learning rate of 0.0001, batch size of 32, and the number of epochs of 100 was set by trial and error. We used Tensorflow 2.3 and Keras libraries to prepare the data and run the model. The analyses were performed with a computer equipped with a 2.1 GHz Intel Xeon Gold 6130 processor (Intel, Santa Clara, CA, USA) and a double NVIDIA Quadro RTX 4000 graphic processing unit (NVIDIA Corporate, Santa Clara, CA, USA).
Model performance and statistical analysis
The primary outcome measures included sensitivity, specificity, precision, and the overall accuracy. Moreover, we used receiver operating characteristic (ROC) curves analysis and area under the ROC (AUROC) curves to measure the performance of our model in the distinction between the three categories. The network’s classification was compared with the diagnosis provided by specialists’ analysis, which was considered the gold standard.
In addition to its diagnostic performance, the computational speed of the network was determined using the validation image data set by calculating the time required for the CNN to provide output for all images.
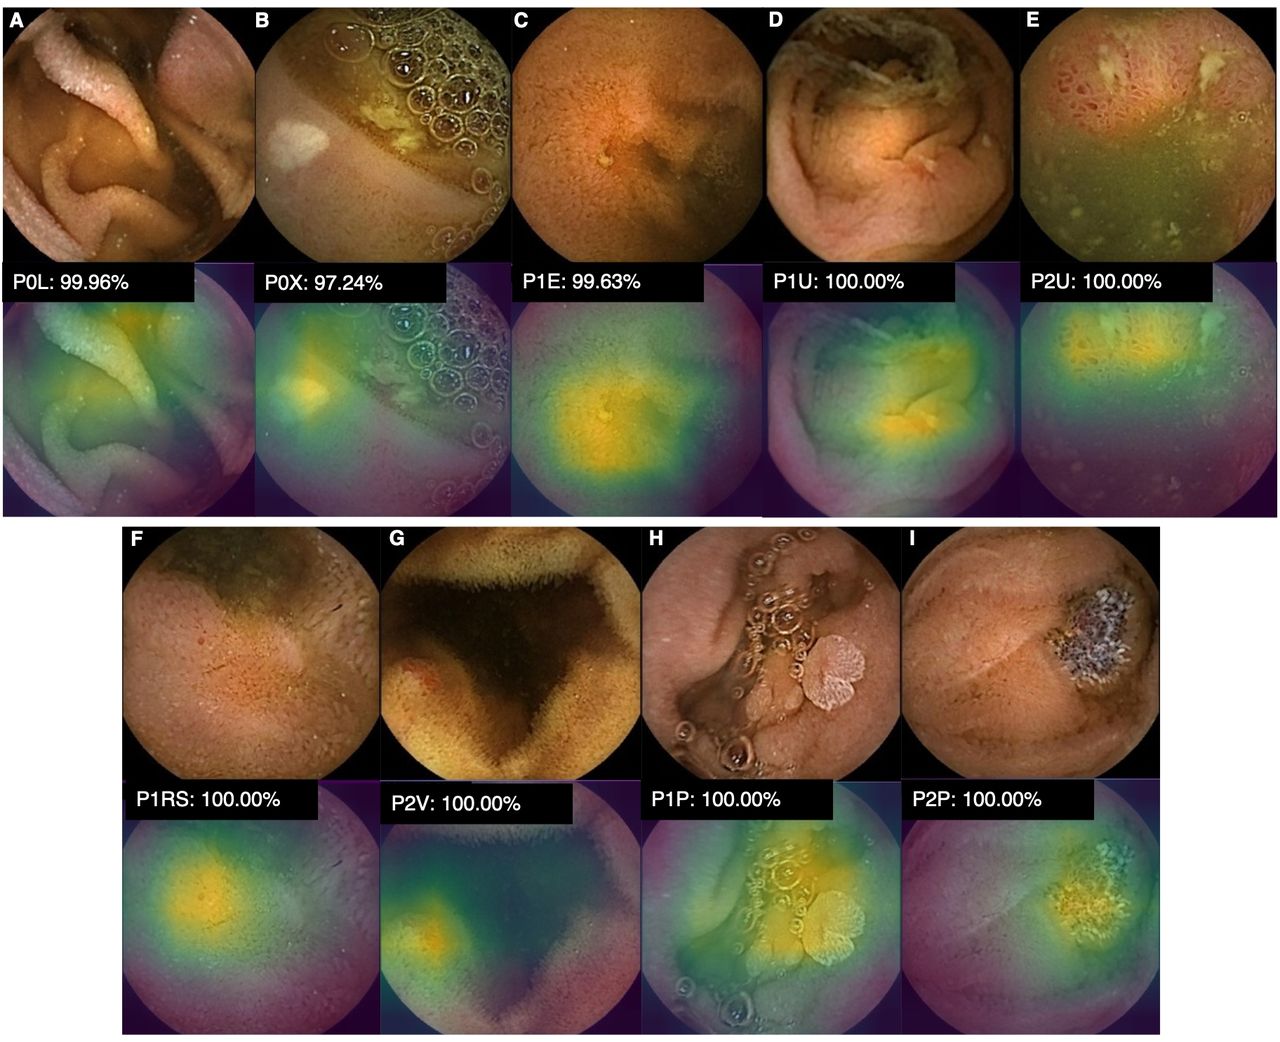
For each image, the CNN calculated the probability for each of the three categories (normal mucosa, red spots, and P2 lesions). A higher probability value translated in a greater confidence in the CNN prediction. The category with the highest probability score was outputted as the CNN’s predicted classification (figure 2). The software generated heatmaps that localised features that predicted a class probability (figure 3). Sensitivities, specificities, and precisions are presented as mean scores±SD. ROC curves were graphically represented and AUROC were calculated. Statistical analysis was performed using Sci-Kit learn V.22.2.25
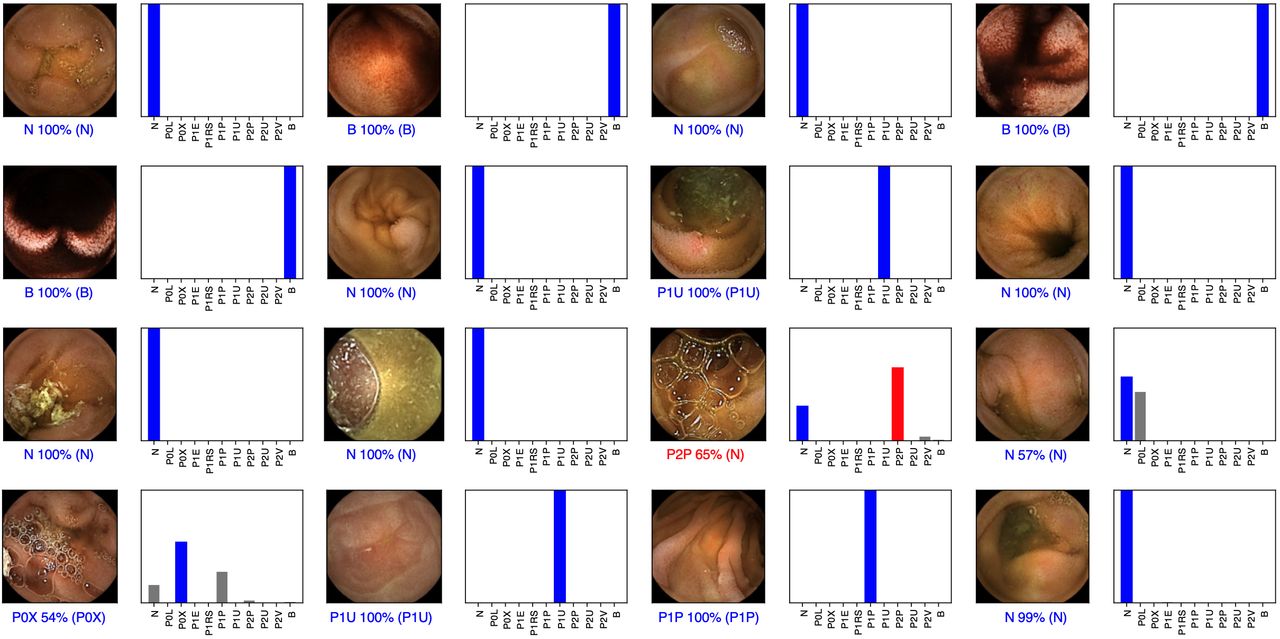
Output obtained during the training and development of the convolutional neural network. The bars represent the probability estimated by the network. The finding with the highest probability was outputted as the predicted classification. A blue bar represents a correct prediction. Red bars represent an incorrect prediction. P0L: lymphangiectasia; P0X: xanthomas; P1E: mucosal erosions; P1U: P1 ulcers; P2U: P2 ulcers; P1RS: P1 red spots; P2V: P2 vascular lesions; P1P: P1 protruding lesions; P2P: P2 protruding lesions. The prefixes P0, P1, and P2 refer to the haemorrhagic potential according to Saurin’s classification.

Heatmaps obtained from the application of the CNN showing different small bowel lesions as identified by the CNN. P0L: lymphangiectasia; P0X: xanthomas; P1E: mucosal erosions; P1U: P1 ulcers; P2U: P2 ulcers; P1RS: P1 red spots; P2V: P2 vascular lesions; P1P: P1 protruding lesions; P2P: P2 protruding lesions. The prefixes P0, P1, and P2 refer to the haemorrhagic potential according to Saurin’s classification. CNN, convolutional neural network.
Results
Construction of the CNN
A total of 4319 patients from two gastroenterology centres were included for development, training, and validation of the CNN for detection of several small bowel lesions with distinct bleeding potential. These patients underwent a total of 5793 CE examinations. The Pillcam system was used in 4509 examinations. The remaining CE examinations (n=1284) used the OMOM system. From this cohort, 53 555 frames were extracted. The performance of the CNN was assessed using the validation dataset, comprising 20% of all extracted frames (n=10 711). The validation dataset was composed by 3602 frames of normal mucosa, 1055 images of lymphangiectasia, 374 images of xanthomas, 422 images of mucosal erosions, 447 and 495 images of P1 and P2 ulcers, respectively. The validation dataset included 663 frames of vascular lesions (382 images of P1 red spots and 281 images of P2 vascular lesions), 573 images of protruding lesions (362 P1 and 211 P2) and 3080 images of luminal blood or hematic residues (table 1). The CNN evaluated each image and predicted a classification which was compared with the classification provided by the specialists. With repeated data inputs the overall accuracy of the multilayer CNN increased, in both training and validation environments (figure 4).
Confusion matrix of the automatic detection versus experts’ classification
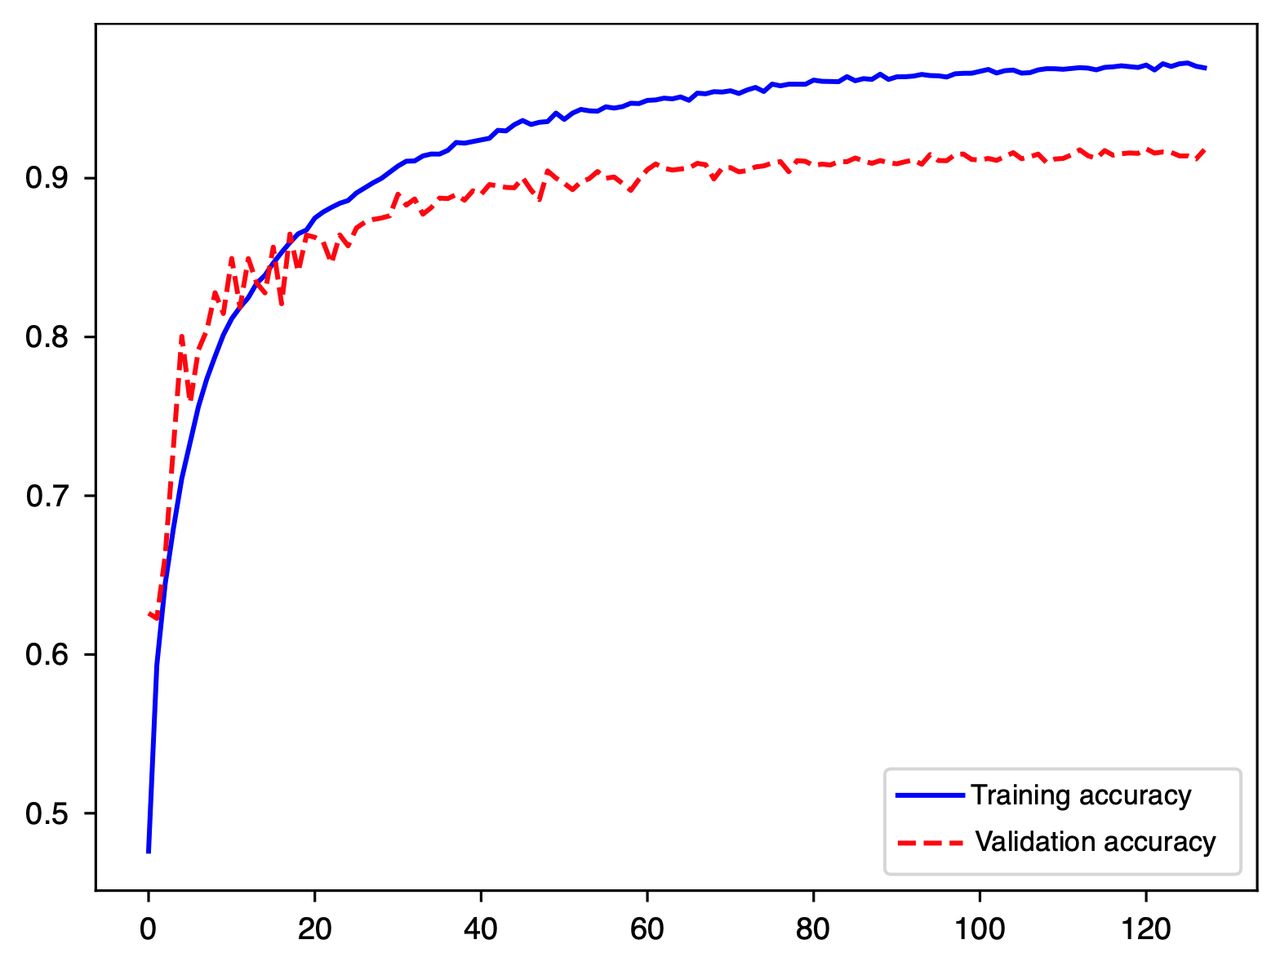
Evolution of the accuracy of the convolutional neural network during training and validation phases, as the training and validation datasets were repeatedly inputted in the neural network.
Overall performance of the CNN
The distribution of results is displayed in table 2. Overall, the mean sensitivity and specificity for the automatic detection of various abnormalities were 87.8%±8.1% and 99.4%±3.7%, respectively. The PPV and NPV were 86.8%±9.0% and 99.4%±3.9%, respectively. The CNN provided accurate prediction in 98%±6.1%.
CNN performance for detection and differentiation of multiple small bowel lesions with distinct haemorrhagic potential
CNN performance for the detection and distinction of various enteric lesions with different bleeding potentials
We aimed to evaluate the performance of the CNN for the detection and distinction of different types of enteric lesions with dissimilar bleeding potential, as assessed by the Saurin’s classification. The results are summarised in table 2. The ROC analyses and respective AUROCs are shown in figure 5. The algorithm detected lymphangiectasias and xanthomas with a sensitivity of 88% and 85%, respectively, and a specificity of >99%. The AUROC for detection of these lesions was 0.99. Mucosal erosions were detected with a sensitivity and specificity of 73% and 99%, respectively, whereas mucosal ulcers were identified with a sensitivity of 81% for P1 lesions and 94% for P2 lesions. The AUROC for detection of mucosal breaks was 0.97 for erosions, 0.99 for P1 ulcers, and 1.00 for P2 ulcers. Vascular lesions with high-bleeding potential were identified with a sensitivity and specificity of 91% and 99%, respectively (AUROC 0.99), whereas mucosal red spots were detected with a sensitivity of 79% and a specificity of 99% (AUROC 0.98). Enteric protruding lesions were detected with high sensitivity (93% and 94% for P1 and P2 lesions, respectively) and specificity (99% and 100% for P1 and P2 lesions). The diagnostic performance of the CNN for these lesions was high, with AUROCs of 0.99 for P1 and P2 protruding lesions. Blood vestiges in the enteric lumen were detected with a sensitivity and specificity exceeding 99% (AUROC 1.00).

ROC analysis of the network’s performance in the detection of small bowel lesions with different bleeding potential. P0L: lymphangiectasia; P0X: xanthomas; P1E: mucosal erosions; P1U: P1 ulcers; P2U: P2 ulcers; P1RS: P1 red spots; P2V: P2 vascular lesions; P1P: P1 protruding lesions; P2P: P2 protruding lesions. The prefixes P0, P1, and P2 refer to the haemorrhagic potential according to Saurin’s classification. B, blood or haematic residues; ROC, receiver operating characteristic.
Overall, the deep learning algorithm was able to detect and differentiate lesions with distinct bleeding potential. The sensitivity and specificity for detection of P0, P1, and P2 lesions were, respectively, 88% and 100%, 87% and 97%, and 94% and 99%. The CNN accurately differentiated P0 from P1 lesions (sensitivity 95%, specificity 98%), P0 from P2 lesions (sensitivity 100%, specificity 99%) and P1 from P2 lesions (sensitivity and specificity of 97%).
Computational performance of the CNN
The CNN completed the reading of the validation dataset in 611 s. This translates into an approximated reading rate of 18 frames per second.
Discussion
CE has revolutionised the etiologic investigation of patients with suspected small bowel disease. OGIB is currently the most common indication for CE.10 It has been shown that is superior to most alternative non-invasive diagnostic methods and provides the most cost-effective approach to these patients.26 Given the uniquely diagnostic role of CE, the interpretation of the bleeding potential of each lesion is essential to guide further diagnostic and therapeutic strategy. Thus, clinical use of a pragmatic tool such as the Saurin’s classification may be helpful to take management decisions.
Reading CE examinations is a burdensome and time-consuming task. Significant lesions may be easily missed as they’re often small and may only appear in a small number of frames.27 28 The development of automated intelligent systems for automatic image analysis has been on the focal point of medical literature over the last decade. Particularly, the application of multilayered CNNs for automatic analysis of CE images has provided interesting results.29 Besides allowing to improve the diagnostic yield of CE for the detection and characterisation of several types of gastrointestinal lesions as well as reducing the time costs associated with reading CE examinations, automated algorithms based on AI may be of value in improving other shortcomings of CE, including image quality, capsule, and lesion localisation. Additionally, parallel computing mechanisms developed to support this progress may also provide assistance in managing the high volume of data produced in every CE procedure.29The automatic detection of lesions of the small bowel mucosa (eg, angiectasia), as well as automatic estimation of their clinical significance (eg, estimating the bleeding potential show promise in improving the management of patients requiring investigation by CE).
Research on the performance of AI tools for application to CE has mainly focused on the detection of a single category of lesions. In this regard, deep learning systems have demonstrated high performance levels for the detection of enteric ulcers, protruding lesions, angiectasia and luminal blood, and locating lesions throughout the gastrointestinal tract.17–20 30 However, identification and differentiation of multiple CE findings using a single CNN has been scarcely reported and, to date, additional automatic assessment of the bleeding potential through a validated classification has not been performed.
In this study, we developed a complex CNN model which was able to detect multiple abnormalities frequently found in CE examinations. Furthermore, our model was able to differentiate lesions with distinct bleeding potential. Thus, we believe that this work has several highlights. First, to our knowledge, this is the first study evaluating the performance of a deep learning system for automatic detection of multiple findings in CE and to simultaneously predict their respective bleeding potential. Second, this is the first study to develop a CNN system for CE using images from two different and widely used CE systems, particularly the Pillcam and OMOM systems. Indeed, our CNN showed excellent performance results using a dataset including images from two different CE systems, with distinct specifications and optical performances. Opposite to current evidence, where results are only applicable to a single CE system, our proof-of-concept results are promising regarding the generalisability of our model to multiple CE systems. Second, our CNN system was trained and validated on a large pool of images. Third, our algorithm demonstrated high performance levels in the identification and classification of bowel lesions according to the Saurin’s classification. In fact, the AUROCs for the detection of the different types of lesions varied between 0.97 and 1.00.
To date, two studies have assessed the potential of deep learning algorithms for diagnosis of multiple types of small bowel lesions. Ding and co-workers31 produced a multicentre retrospective study documenting the development of a CNN model for automatic detection of several small bowel abnormalities. Their system was designed for detection of mucosal abnormalities which were subsequently classified by a gastroenterologist. Although recognising the important role of CE in the setting of OGIB, the impact of this CNN system for assessment of the bleeding risk associated with each finding was not evaluated. More recently, Aoki et al32 shared their experience with the development of a combined CNN for detections of various mucosal abnormalities. Their system showed high performance levels. Although OGIB was the most common indication for CE in their study, the assessment of the bleeding potential of each lesion was not provided. Although these new systems are a clear step forward for increasing the diagnostic yield of CE, assessing the clinical significance of a given mucosal abnormality in the setting of OGIB may help to stratify patient who may require further evaluation. The development of automatic systems providing such evaluation may lead to future gains regarding adequate management of healthcare resources.
This study has several limitations. First, this was a retrospectively conducted study. Second, although this multicentre study included over 5000 patients and 50 000 frames, larger studies are required to assess the clinical impact of these technologies. Third, although our model included images from two distinct CE systems, the number of CE examinations using the OMOM this system was relatively low (22% of the total number of exams). Third, our CNN was developed using still frames. Clinical implementation of this model requires previous studies evaluating the performance of this model using full-length videos.
In conclusion, we have constructed a CNN-based model capable of diagnosing multiple types of small bowel lesions and differentiating their haemorrhagic potential using a widely used scale. Our system achieved high levels of diagnostic performance. This system has the potential to increase the diagnostic rentability of CE while simultaneously providing inputs regarding the clinical significance of detected lesions.
Data availability statement
All data relevant to the study are included in the article or uploaded as supplementary information.
Ethics statements
Patient consent for publication
Ethics approval
The study protocol was approved by the ethics committee of São João University Hospital/Faculty of Medicine of the University of Porto (No. CE 407/2020).
References
Footnotes
Contributors MMS and JA – equal contribution in study design, image extraction and labelling and construction and development of the CNN, data interpretation and drafting of the manuscript. TR – study design, construction and development of the CNN, data interpretation and drafting of the manuscript JPSF – study design, construction and development of the CNN, statistical analysis. HC and PA – equal contribution in study design, image extraction and labelling, construction and development of the CNN and data interpretation. MPLP, RNJ and GM - study design, revision of the scientific content of the manuscript.
Funding The authors acknowledge Fundação para a Ciência e Tecnologia (FCT) for supporting the computational costs related to this study through CPCA/A0/7363/2020 grant.
Competing interests None declared.
Provenance and peer review Not commissioned; externally peer reviewed.
Supplemental material This content has been supplied by the author(s). It has not been vetted by BMJ Publishing Group Limited (BMJ) and may not have been peer-reviewed. Any opinions or recommendations discussed are solely those of the author(s) and are not endorsed by BMJ. BMJ disclaims all liability and responsibility arising from any reliance placed on the content. Where the content includes any translated material, BMJ does not warrant the accuracy and reliability of the translations (including but not limited to local regulations, clinical guidelines, terminology, drug names and drug dosages), and is not responsible for any error and/or omissions arising from translation and adaptation or otherwise.