Article Text

Abstract
Background Clinical delays may be important contributors to outcomes among younger adults (<50 years) with colorectal cancer (CRC). We aimed to describe delay intervals for younger adults with CRC using health administrative data to understand drivers of delay in this population.
Methods This was a population-based study of adults <50 diagnosed with CRC in Ontario, Canada from 2003 to 2018. Using administrative code-based algorithms (including billing codes), we identified four time points along the pathway to treatment—first presentation with a CRC-related symptom, first investigation, diagnosis date and treatment start. Intervals between these time points were calculated. Multivariable quantile regression was performed to explore associations between patient and disease factors with the median length of each interval.
Results 6853 patients aged 15–49 were diagnosed with CRC and met the inclusion criteria. Males comprised 52% of the cohort, the median age was 45 years (IQR 40–47), and 25% had stage IV disease. The median time from presentation to treatment start (overall interval) was 109 days (IQR 55–218). Time between presentation and first investigation was short (median 5 days), as was time between diagnosis and treatment start (median 23 days). The greatest component of delay occurred between first investigation and diagnosis (median 78 days). Women, patients with distal tumours, and patients with earlier stage disease had significantly longer overall intervals.
Conclusions Some younger CRC patients experience prolonged times from presentation to treatment, and time between first investigation to diagnosis was an important contributor. Access to endoscopy may be a target for intervention.
- COLORECTAL NEOPLASM
- CANCER EPIDEMIOLOGY
- EPIDEMIOLOGY
Data availability statement
The dataset from this study is held securely in coded form at ICES. While legal data sharing agreements between ICES and data providers (eg, healthcare organisations and government) prohibit ICES from making the dataset publicly available, access may be granted to those who meet pre-specified criteria for confidential access, available at www.ices.on.ca/DAS (email: das@ices.on.ca). The full dataset creation plan and underlying analytic code are available from the authors upon request, understanding that the computer programs may rely upon coding templates or macros that are unique to ICES and are therefore either inaccessible or may require modification.
This is an open access article distributed in accordance with the Creative Commons Attribution Non Commercial (CC BY-NC 4.0) license, which permits others to distribute, remix, adapt, build upon this work non-commercially, and license their derivative works on different terms, provided the original work is properly cited, appropriate credit is given, any changes made indicated, and the use is non-commercial. See: http://creativecommons.org/licenses/by-nc/4.0/.
Statistics from Altmetric.com
WHAT IS ALREADY KNOWN ON THIS TOPIC
Excessive time to diagnosis and treatment may be associated with worse outcomes, and younger adults with colorectal cancer might be particularly affected. This population is largely not eligible for population-based screening and often presents with advanced disease.
WHAT THIS STUDY ADDS
Using population-based data in Ontario, Canada, we reported time from first presentation to first investigation, diagnosis, and treatment among 6853 colorectal cancer patients <50 years. The median time from presentation to treatment start was 109 days and the greatest component of delay occurred between first investigation and diagnosis (median 78 days).
HOW THIS STUDY MIGHT AFFECT RESEARCH, PRACTICE OR POLICY
While younger adults are investigated in a timely fashion, many have prolonged waits to diagnosis in particular. Given colorectal cancer diagnosis was most often made during endoscopy, access to this resource is an important target for future research or policy.
Introduction
The incidence of colorectal cancer (CRC) is increasing in younger adults (<50 years)—this trend has been identified in Canada, the United States, Italy, Australia and other nations.1–4 CRC mortality in this population is also rising, and these patients are more likely to be diagnosed with advanced and metastatic disease compared with older adults.5–7 Only 16% of younger adults will have an identifiable predisposing factor and therefore most will not be eligible for screening.8
Delays to diagnosis and treatment have been suggested as possible contributors to poor outcomes.8–10 However, the literature reporting delay intervals in younger CRC patients is heterogeneous and of variable quality. The Aarhus statement is an international consensus document that has been published in an effort to improve the methodology of cancer delay studies and includes standardised definitions of delay intervals.11 There is a paucity of large, population-based studies, and few examine pre-diagnostic intervals, which may be particularly important in a younger population.7 Pre-diagnostic intervals include time occurring between the development of cancer-related symptoms and diagnosis. However, it is challenging to identify pre-diagnostic time points such as the date of first presentation using health administrative data.11 Important advances in methodology have been made,12–14 including algorithms developed for population-based databases.15
These newer approaches have not focused specifically on younger adults with CRC, and important intervals in this group remain understudied. Time from the date of first presentation with CRC-related symptoms to the date of first investigation (the doctor interval11 may be a source of delay for younger CRC patients if they experience misdiagnosis or do not receive timely access to initial investigations. Previous studies have not reported this interval for younger CRC patients and have been limited in their ability to understand the relative contributions of individual intervals to the overall delay experienced.
The aim of this study was to describe important time points and delay intervals along the pathway to treatment for adults <50 with CRC using population-based health administrative data and associated factors to understand potential drivers of longer intervals in this population.
Methods
Study design and data sources
This was a population-based cohort study of adults <50 years diagnosed with CRC in Ontario, Canada. Data were obtained from ICES16 (formerly known as the Institute for Clinical Evaluative Sciences), an independent, non-profit research institute that maintains health administrative data for more than 14 million Ontario residents and provides de-identified linked datasets to researchers. Using a unique encrypted identifier, patient data were linked from 15 separate data sources and analysed at ICES (online supplemental material 1). We followed the Strengthening the Reporting of Observational Studies in Epidemiology (STROBE) statement17 and the Aarhus checklist, a quality assessment tool for cancer delay studies11 in the preparation of this manuscript (online supplemental material 2). The Research Ethics Board at the University of Toronto (number 41634) and St. Michael’s Hospital (number 21-207) approved this study.
Supplemental material
Patient population
Using the Ontario Cancer Registry (OCR), we identified Ontario residents aged 15–49 with valid Ontario Health Insurance Plan (OHIP) numbers who were diagnosed with CRC (online supplemental material 3) between 1 October 2003 and 31 December 2018. This time frame accounted for a change in administrative data in Ontario from International Classification of Diseases (ICD)−9 to ICD-10 beginning in 2001.18 The OCR is a high-quality population-based cancer registry operated by Cancer Care Ontario since 1964, with over 94% of included CRCs being microscopically confirmed.19 Exclusion criteria included previous malignancy in the OCR, CRC diagnosis on death certificate only, appendiceal cancer and inflammatory bowel disease (IBD). Patients with IBD were identified20 21 and excluded as we anticipated this population to have a unique diagnostic journey with some eligible for CRC surveillance (online supplemental material 3).
Outcomes
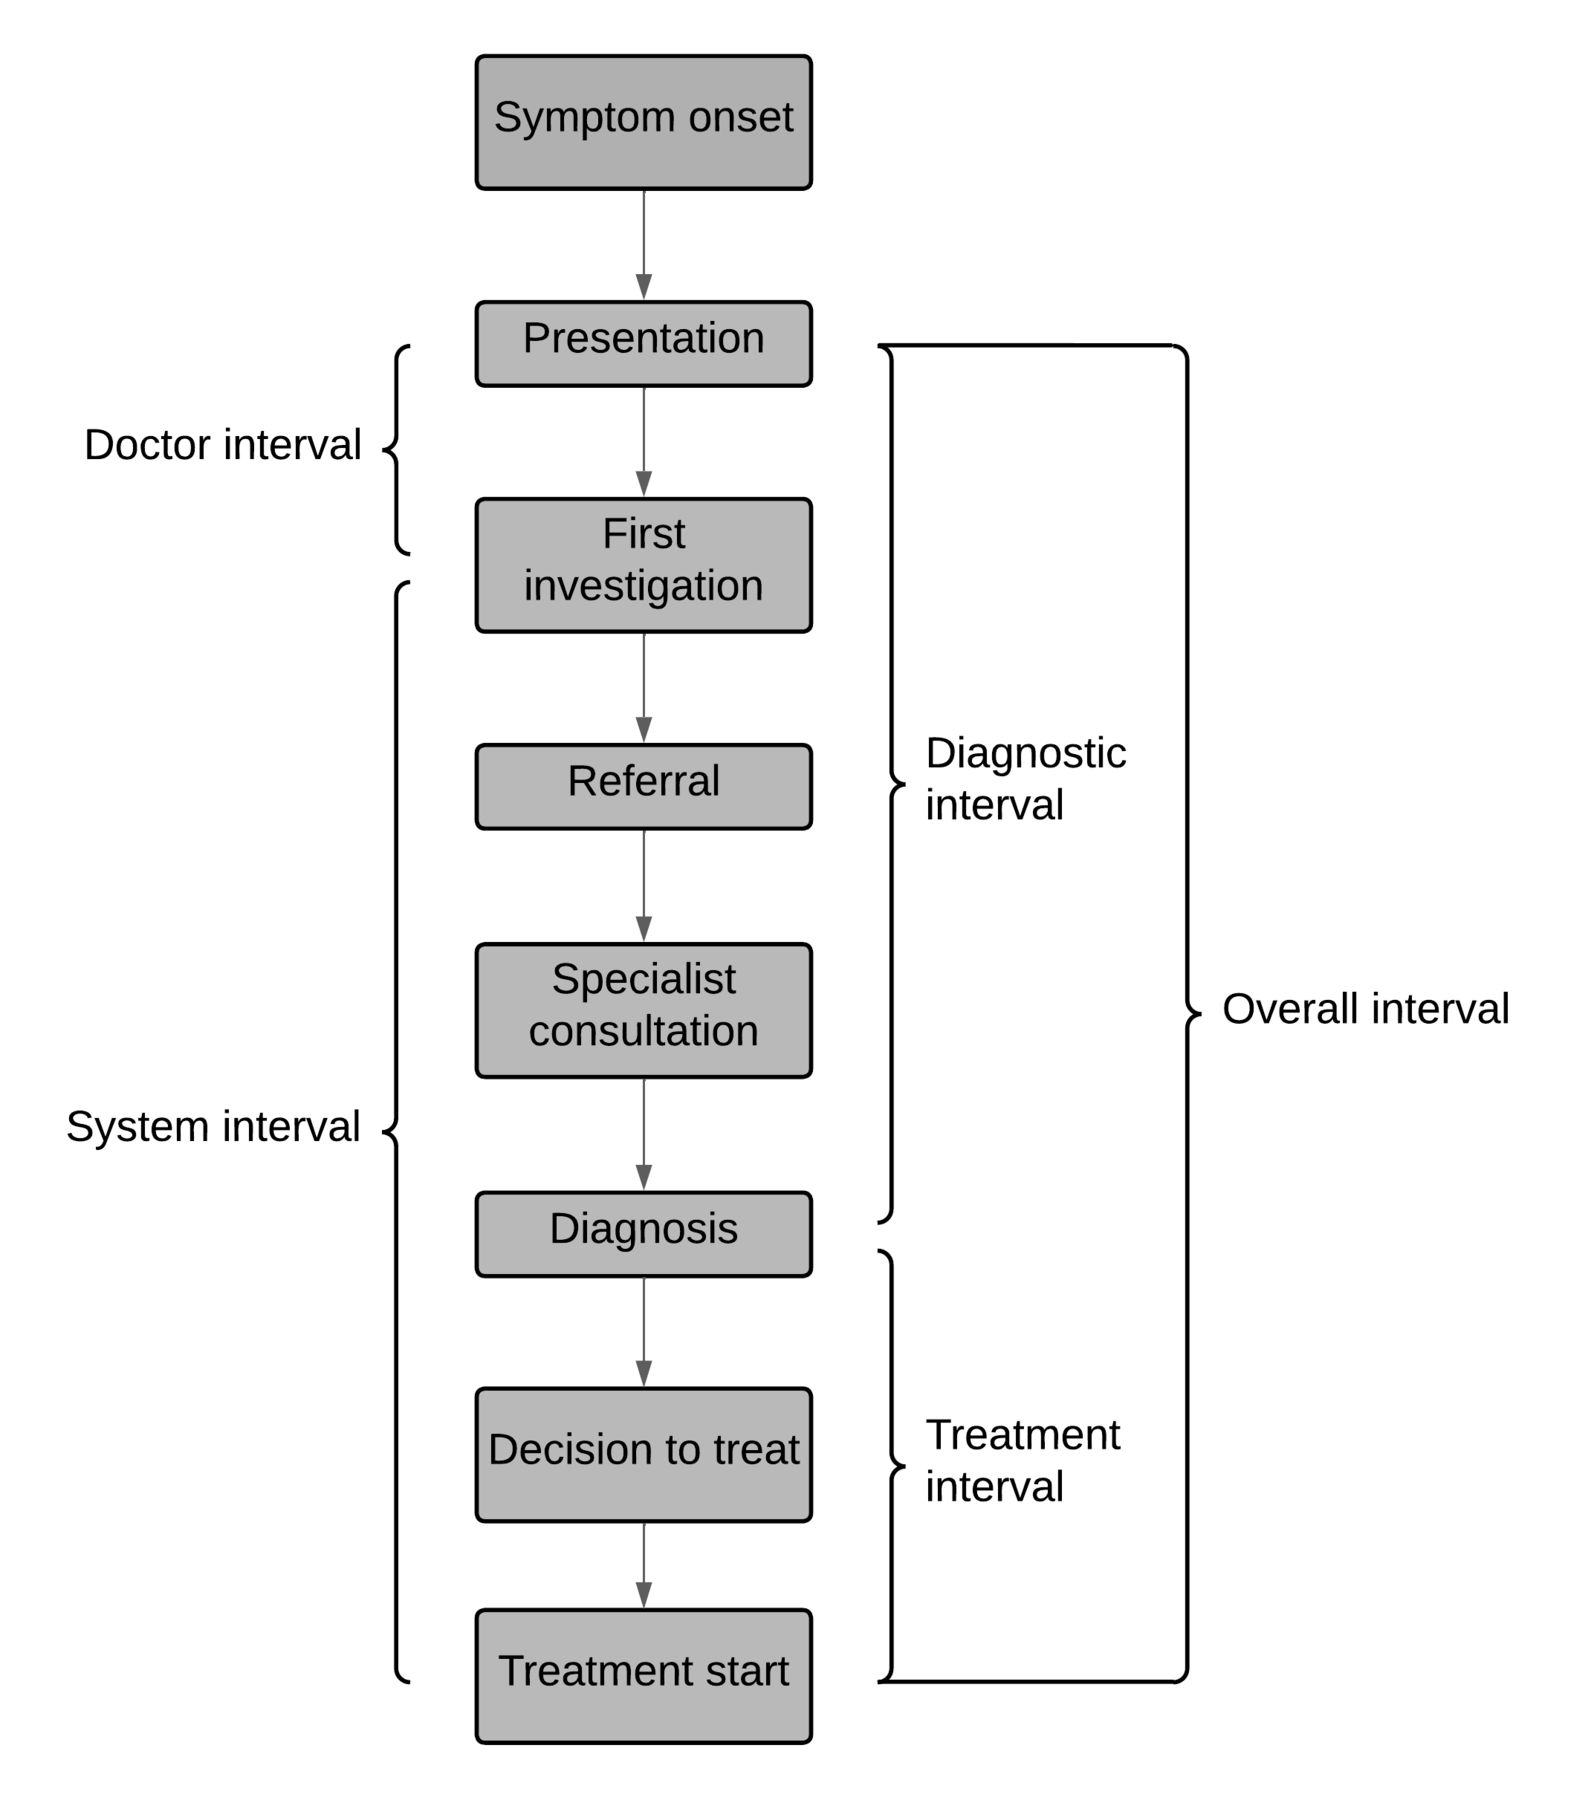
Using detailed health administrative data, we identified four distinct time points along the pathway to treatment22—first presentation with a CRC-related symptom, first investigation, diagnosis date and treatment start. This enabled us to measure five overlapping delay intervals (figure 1). These included the doctor interval (presentation to first investigation), system interval (first investigation to treatment start), diagnostic interval (presentation to diagnosis) and treatment interval (diagnosis to treatment start) as defined by the Aarhus statement.11 We also calculated the overall interval (presentation to treatment start).

Pathway to treatment and delay intervals of interest.
While not intervals recognised in the Aarhus statement, we additionally determined the time from presentation to the first abdominal/pelvic CT or MRI, and the time from presentation to first lower endoscopy for descriptive purposes.
Assigning date of first presentation
In administrative data, to accurately identify the date of first presentation for CRC-related symptoms, which may be non-specific, these visits must be distinguished from routine encounters with the healthcare system. We assigned the date of first presentation with CRC-related signs and symptoms using an algorithm adapted from prior work by Groome et al,15 23 who defined date of first presentation based on procedural and diagnostic codes that occurred more frequently prior to diagnosis compared with a background period. Codes were organised into categories, and category-specific lookback periods were established based on when the frequency of codes was similar to the background rate (online supplemental material 4). This method has been used for oral cancer, breast cancer and CRC15 23 24 and is being tested for use in pancreatic cancer.25 The methodology avoids arbitrary lookback periods, leverages existing health administrative datasets and allows for a more complete assessment of the diagnostic journey.23
Based on this algorithm, we assigned the date of first presentation for each patient using the following steps:
For each patient in our cohort, all administrative codes occurring in the OHIP, National Ambulatory Care Reporting System, Same-Day Surgery and Discharge Abstract Database databases up to 18 months prior to diagnosis were identified.
Codes included in the algorithm were retained and organised by date.
Codes were assigned into their respective categories, and any code recorded at a time exceeding the category-specific lookback period was removed. The date of the earliest code was identified (online supplemental material 4).
Codes included in categories 1–6 were ICD-10 and OHIP diagnostic codes (online supplemental file 4) and do not contain information on referring physicians. If the earliest code was included in one of these categories, this was the date of first presentation.
Code categories 7–19 (online supplemental material 4) contained procedural codes and OHIP billing codes for endoscopy, endoscopic procedures, surgery, specialist consultations and imaging. For these codes, referring physician information was available. If any codes in these categories were identified as the earliest code, the referring physician was identified, and the most recent visit with that physician (within 18 months of diagnosis) was the date of first presentation. If the referring physician was missing, the most recent encounter with the performing or ordering physician was used (within 18 months of diagnosis). If both the referring and performing physician were missing, the code date itself was the date of first presentation.
We performed sensitivity analyses around the date of first presentation. We explored four alternative algorithms to assign date of presentation (online supplemental material 5). We used the original set of administrative codes but removed the category-specific lookback dates from the CRC diagnosis date, instead testing a universal 12-month cut-off and a universal 18 month cut-off. We examined frequency tables of codes occurring in our cohort of younger CRC patients, and identified an additional 201 administrative codes plausibly related to CRC that were not in the original algorithm (online supplemental material 4). This expanded algorithm was tested with a 12 and 18 month cut-off from diagnosis date.
Assigning remaining time points
The date of first investigation was defined as the first occurrence of an intervention or diagnostic test after the date of first presentation (online supplemental material 4). These included endoscopy, faecal occult blood test, imaging and blood work. Codes used to determine the date of presentation were also used for the date of first investigation when these codes represented the above tests or interventions. The date of diagnosis was determined from the OCR, which follows a standardised hierarchical method of assigning cancer diagnosis dates; the earliest among admission date (for hospitalisation), registration date (for emergency visits), diagnosis date in the cancer centre records or collection date for pathology confirmation. Finally, the date of first treatment was defined as the first date of any chemotherapy administration, radiotherapy treatment,or surgical intervention after diagnosis (online supplemental material 4).
Covariates
Age at diagnosis and sex were determined from the Registered Persons Database.26 Marginalisation was measured using the Ontario Marginalization Index (ON-Marg), which is a validated tool that measures residential instability, material deprivation, dependency, and ethnic concentration at the neighbourhood level.27 The ON-Marg contains a number of socioeconomic variables in its derivation, including average number of persons per dwelling, residential mobility, per cent lone-parents families, education, unemployment, per cent recent immigrants, among others.27 A summary score was created by averaging each individual’s quintile for the four measures, with higher scores indicating greater levels of marginalisation.27 Canadian census data were used to assign individuals into income quintiles (1 being the least affluent and 5 being the most affluent), based on their postal code of residence.28 Rural patients were considered in a separate category of income, defined as those living in communities ≤10 000 individuals in size. We did not include both ON-Marg and income quintile in the same model as they are derived using income data from the same source. Disease characteristics were obtained from the OCR, including stage, cancer site, and cause of death. Stage was available for patients diagnosed after 2007. Access to care was assessed by calculating the use of lower gastrointestinal (GI) endoscopy (colonoscopy, sigmoidoscopy or anoscopy) over the year preceding CRC diagnosis in the patient’s Local Health Integration Network (LHIN), a geographic unit of health administration in Ontario.
Statistical analysis
Patient characteristics were described. Differences between age groups (15–39, 40–44 and 45–49 years) were compared using Wilcoxon Rank Sum tests for continuous variables and χ2 tests for categorical variables. Descriptive statistics were presented for the length of each delay interval, in days. Non-linear relationships between intervals and age were explored using restricted cubic spline regression. Tests for non-linearity were performed. A model including age as a linear predictor, and a second model including a restricted cubic spline with three knots were fit. A likelihood ratio test was performed between these two nested models.29
To identify the degree to which the length of delay in one interval was related to the length of delay in other intervals, Pearson correlation coefficients were calculated between all intervals and presented as a correlogram. We used quantile regression to explore associations between patient and disease factors with the median length of each interval. This nonparametric approach has been widely used, as intervals are frequently right-skewed and violate distributional assumptions with standard linear regression.15 30–34 Univariate and adjusted models were presented. Missing data were handled using pairwise deletion. The analysis was performed using SAS V.9.4 (SAS Institute, Cary, North Carolina) and R (R Foundation for Statistical Computing, Vienna, Austria). All statistical tests were two-sided, and a p-value of≤0.05 was considered statistically significant. Because this study was exploratory and hypothesis-generating, adjustments for multiple comparisons were not made.35
Results
Patient and disease characteristics
From the OCR, 8081 patients aged 15–49 were diagnosed with CRC between 2003 and 2018. After exclusions, 7053 patients remained. We were unable to assign a date of first presentation for 200 patients, resulting in 6853 patients included in the analysis (online supplemental material 6). Patient characteristics are presented in table 1. Men comprised 52% (3,587) of the cohort, and the median age was 45 years (IQR 40–47). Rectal cancer patients represented 31% of the cohort. For those diagnosed after 2007 when stage of disease was available, 25% of patients presented with stage IV disease. Patients aged 15–39 were more likely to have stage IV disease (28% age 15–39, 24% age 40–44, 25% age 45–49; p<0.001) and proximal colon cancer (39% age 15–39, 32% age 40–44, 34% age 45–49; p<0.001) compared with older patients (table 1).
Characteristics and delay intervals for a cohort of colorectal cancer patients <50 years
Patient characteristics stratified by sex are presented in online supplemental material 7.
Characterising dates of first presentation, investigation and diagnosis
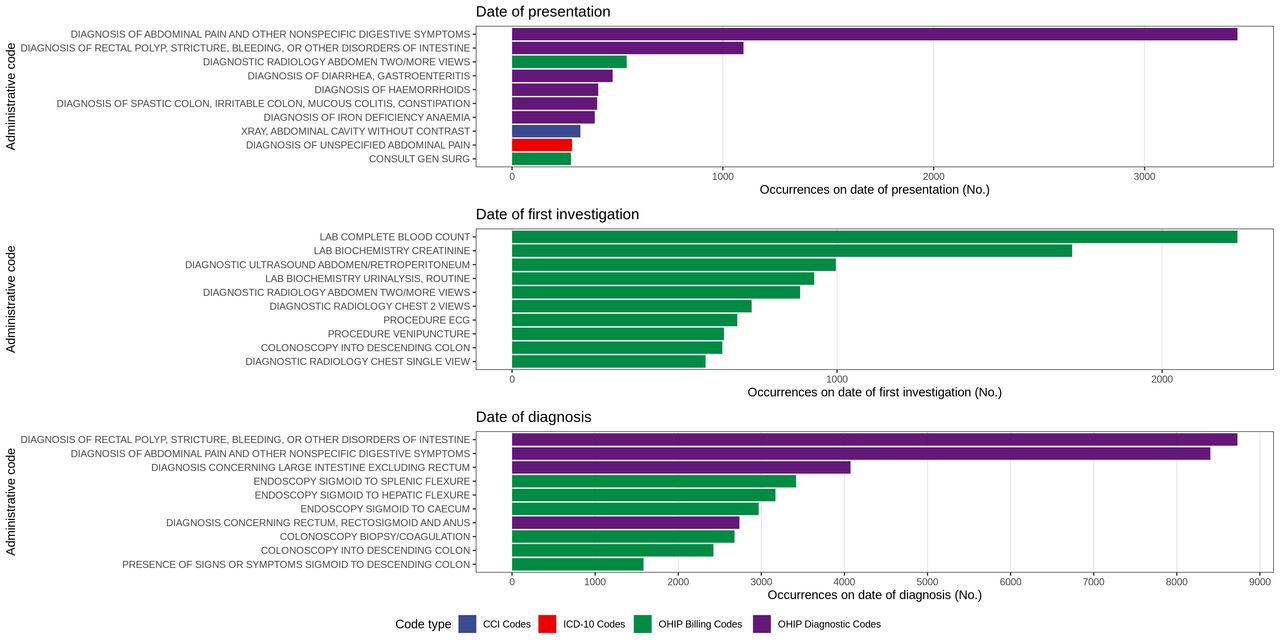
Codes defining the date of first presentation, investigation and diagnosis were visualised and explored (figure 2). The date of first presentation was characterised mainly by physician encounters for abdominal pain, diarrhoea, constipation/obstruction, and rectal bleeding. Additionally, codes for abdominal X-ray and general surgery consultations were common. The date of first investigation consisted of abdominal imaging, endoscopy and more general interventions such as blood work and chest X-rays. The diagnosis date was most often characterised by endoscopy and endoscopic biopsies.

Health administrative codes included in the algorithm occurring on the first date of presentation, investigation and diagnosis. Codes are identified by type, including Canadian Classification of Health Interventions (CCI) codes, International Classification of Diseases version 10 (ICD-10) codes, Ontario Health Insurance Program (OHIP) billing codes and OHIP diagnostic codes. The top 10 codes for each time point by frequency are presented.
Delay intervals
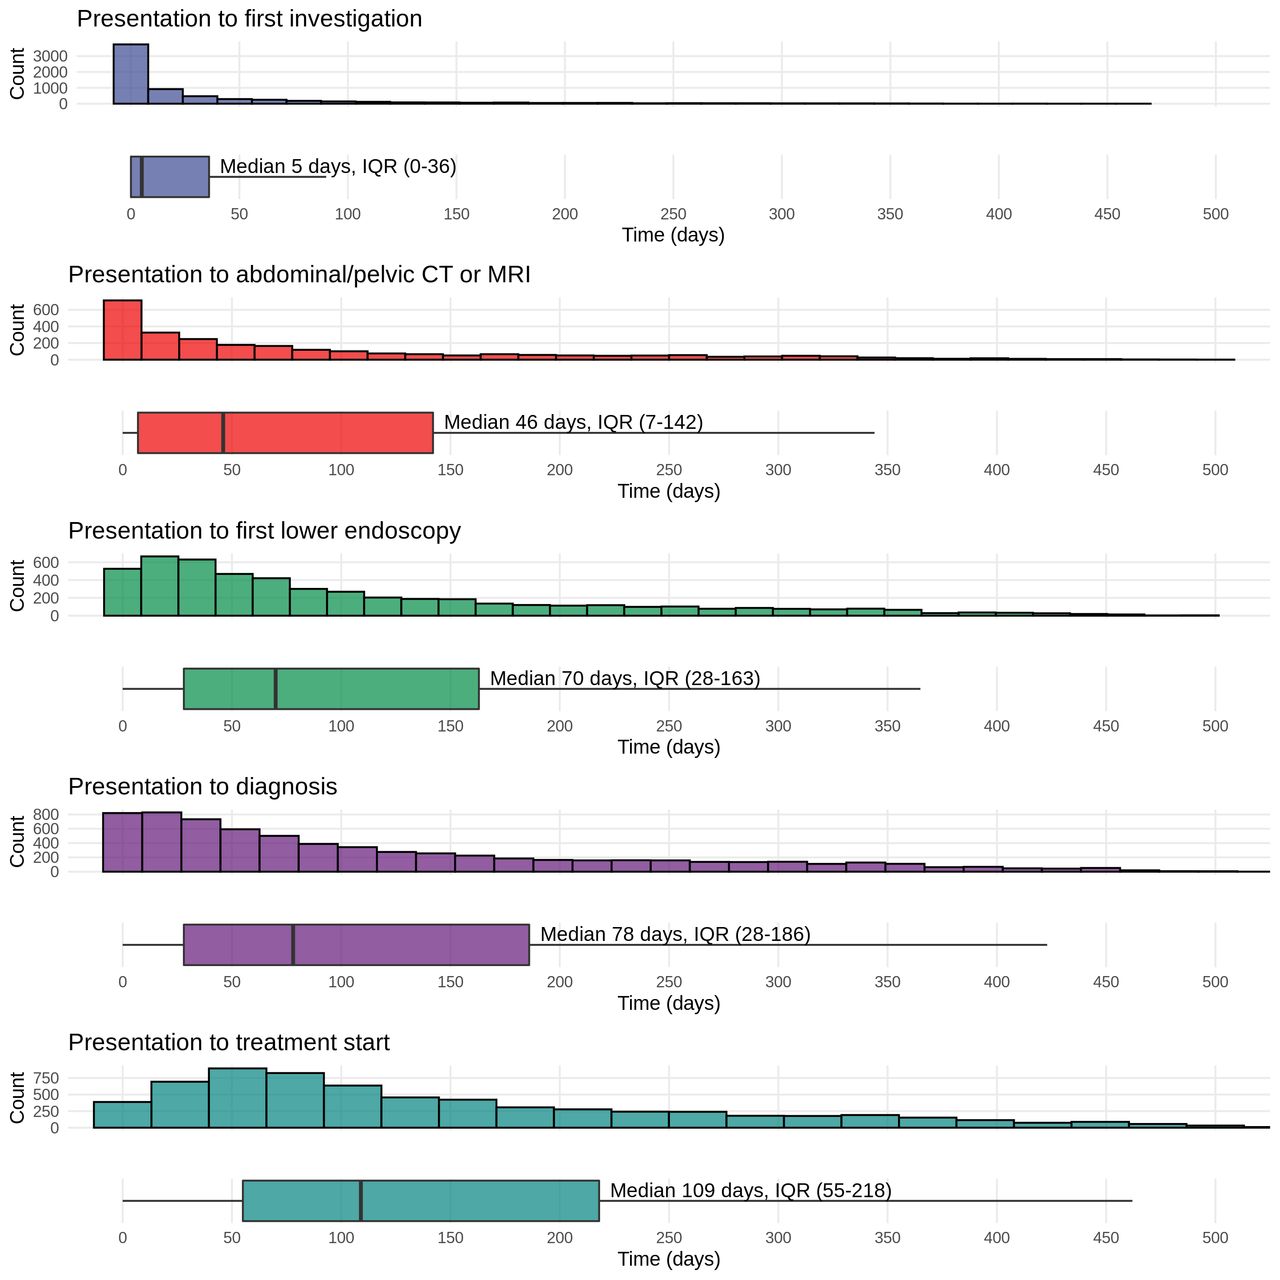
Descriptive statistics for the five intervals are presented in figure 3, table 1. The median time from presentation to treatment (overall interval) was 109 days (IQR 55–218). The overall interval can be divided into the diagnostic and treatment intervals. Most of this time was contained within the diagnostic interval (median 78 days, IQR 28–186). Median time from diagnosis to treatment (treatment interval) was 23 days (IQR 7–40). The overall interval can also be divided into the doctor and system intervals. In our cohort, we found the doctor interval was a median of 5 days (IQR 0–36) and the system interval was a median of 77 days (IQR 36–160). The alternative algorithms produced very similar intervals (median different of 0 days for all intervals).
Length of delay intervals and time from presentation to first abdominal/pelvic CT or MRI, and from presentation to first lower endoscopy in a cohort of colorectal cancer patients <50 years.
There were weak correlations between contiguous intervals (doctor/system intervals and diagnostic/treatment intervals; online supplemental material 8). Longer doctor intervals were weakly and negatively correlated with system intervals (correlation coefficient −0.09; p<0.001). There was no significant correlation between diagnostic interval and treatment interval (correlation coefficient=0.02; p=0.085).
The median time from presentation to first abdominal/pelvic CT or MRI was 46 days (IQR 7–142), and median time from presentation to first lower endoscopy was 70 days (IQR 28–163). There was not a significant difference by age for these measures (table 1).
Factors associated with delay intervals
Table 2 presents adjusted quantile regression for the delay intervals of interest. Univariate regression is presented in online supplemental material 9 and 10. Older age was not significantly associated with the overall interval, doctor interval, or system interval. None of the relationships was found to be significantly non-linear (all p>0.05), and age was modelled as a simple continuous covariate (online supplemental material 11). Increasing age was associated with shorter diagnostic intervals (median difference −3.5 days per 5 year increase, 95% CI −6.4 to −0.6) and longer treatment intervals (median difference 2.0 days per 5 year increase, 95% CI 1.4 to 2.5). Compared with man, women had significantly longer overall intervals (median difference 26.5 days, 95% CI 18.9 to 34.2). More contemporary diagnosis was associated with a statistically significant increase in the treatment interval (median increase 0.5 days per year, 95% CI 0.2 to 0.8) and a statistically significant decrease in the doctor interval (median decrease 0.2 days per year, 95% CI −0.3 to 0). Patients with rectal cancer had longer overall intervals compared with those with proximal colon cancer (median difference 22.1 days, 95% CI 13.2 to 30.9), and most of this difference was contained within the treatment interval (median difference 19.6 days, 95% CI 17.9 to 21.4). More frequent use of lower GI endoscopy in the patient’s LHIN was associated with significantly shorter overall, diagnostic and system intervals.
Multivariable quantile regression for delay intervals of interest with patient and disease characteristics
More advanced stage was consistently associated with shorter delay intervals. Compared with those with stage I disease, the median time from presentation to treatment for patients with stage IV disease was more than 2 months shorter (adjusted median difference for overall interval −61.3 days, 95% CI −72.5 to −50.2). Differences were also apparent between patients with stage I and stage II or stage III disease (stage II vs stage I overall interval median difference −34.3 days, 95% CI −48.1 to −20.4; Stage III versus stage I overall interval median difference −41.7 days, 95% CI −54.1 to −29.3).
Discussion
In this population-based cohort study, 6853 adults <50 years diagnosed with CRC between 2003 and 2018 in Ontario were found to have median intervals from first presentation to first treatment (overall interval) of 109 days. More than 25% of these patients had overall intervals greater than 218 days (7.2 months). We found the greatest contributor to the overall interval was time from first investigation to treatment (median 77 days), while the median time from diagnosis to treatment start was 23 days. We found initial investigations occurred a median 5 days after presentation in younger CRC patients. Among patients with stage available, 25% presented with stage IV disease, and more advanced stage was strongly associated with shorter intervals. Factors associated with longer overall intervals included female sex and distal tumours.
This is the first study to identify the date of initial investigation using health administrative data and report the doctor interval and system interval among younger adults with CRC. We found the median doctor interval was short (5 days), suggesting when younger patients seek medical attention, the initial workup is begun in a timely fashion for most patients. However, most of these consisted of blood work, ultrasound, and X-rays. Time to more definitive investigations, including CT, MRI or endoscopy took longer. After diagnosis, the median time to treatment was also within recommended cutoffs of 1 month for most patients,36 37 although there was a small increase in this interval over the study period. However, our results demonstrate that the period of time most contributory to overall wait time was between the first investigation and diagnosis. For most patients, the date of diagnosis corresponded to the date of endoscopy, indicating that access to endoscopy was a key driver of the overall wait time for patients.
The literature reporting delay intervals in younger adults with CRC is heterogenous.7 15 38 39 Webber et al15 established the algorithm used in this study to identify the date of first presentation and examined the diagnostic interval among 23 961 adults (mean age 68.6 years) with CRC in Ontario. There were 1902 adults <50 years in the study, and the median diagnostic interval was 111.5 days in those <35 years, decreasing to 73 days in patients aged 45–49. An additional Canadian study by Sikdar et al39 examined 822 younger CRC patients in Alberta, demonstrating a median diagnostic interval of 81 days. Finally, Price et al38 studied 1206 younger adults with CRC in the UK using health administrative data and reported the diagnostic interval to be a median of 65 days. Despite using different population-based data sources and a variety of algorithms for determining the date of first presentation, these results are very similar to our result for the diagnostic interval (median 78 days). Our findings regarding the treatment interval are also in keeping with previous large reports. In a very large analysis of the National Cancer Database (NCDB), Gabriel et al7 found the mean time from diagnosis to treatment was 11.2 days among 94 143 younger colon cancer patients, and 22.0 days among 58 947 younger rectal cancer patients. The mean treatment interval was 29 days for our cohort, and we similarly found rectal cancer patients had longer treatment intervals. We identified only two studies reporting the overall interval (presentation to treatment start), both including less than 100 younger CRC patients.40 41 This literature shows many younger patients will wait longer than 2 months from presentation to diagnosis with CRC and some will have much longer delays (>6 months) but will subsequently receive treatment in a timely fashion.
Patients who experienced longer intervals were more likely to have early stage disease. This is consistent with previous work. Webber et al15 similarly showed CRC patients with stage I disease had the longest intervals (median 104 days for the diagnostic interval) compared with those with higher stage disease (stage IV median 62 days for the diagnostic interval), although this included mainly older adults. Among 253 younger adults in the USA, Chen et al42 demonstrated CRC patients with early stage disease had longer times for three intervals (symptom onset to presentation, presentation to diagnosis and symptom onset to diagnosis). This phenomenon has been recognised in cancer populations more broadly than just those with CRC, where it is hypothesised tumours that are more aggressive within the same cancer type may be more likely to cause bothersome symptoms and lead patients to present more quickly, thus shortening the interval to diagnosis.43 This U-shaped relationship between interval length and disease severity/mortality has been demonstrated in patients with colorectal, lung, melanoma, breast and prostate cancer.44
Strengths of this study include the population-based nature of the data and large sample size. Our cohort included a broad sample of younger patients with CRC, including 25% with metastatic disease at presentation. We used previously published algorithms to identify the date of first presentation15 23 24 and extended this work to include the date of first investigation. This allowed us to report novel intervals among younger CRC patients that have not previously been explored (doctor interval and system interval). The algorithms used were able to assign dates of presentation and investigation in over 95% of patients, demonstrating their utility in future research. Our analysis was guided by international consensus-derived guidelines for the definitions of delay intervals (Aarhus statement,11 and we used sensitivity analyses to explore the date of first presentation. Finally, we used quantile regression to examine factors associated with intervals, which is an appropriate nonparametric method for analysing skewed data such as wait times.15 30–34
This study has limitations. While the algorithms used to identify the date of first presentation have been previously reported and published, they are not validated against patient charts directly.15 23 24 Thus, there is the possibility for misclassification. We explored the cohort’s healthcare encounters prior to CRC diagnosis and identified an additional 201 administrative codes that were not present in the original algorithm in a sensitivity analysis. We also varied the lookback periods within the algorithm, and these sensitivity analyses did not change the results of the study. Our results are also comparable to those reported by other high-quality population-based studies on delay in younger adults with CRC using different methods and data sources, providing some degree of external validation.7 15 38 39 While the period between the onset of symptoms and first presentation is highly important in determining the overall length of delay experienced, we were unable to ascertain this interval with health administrative data. Finally, the data used in this analysis do not contain the indication for diagnostic tests and thus investigations such as blood work may not have been conducted as part of investigation of CRC signs or symptoms.
This large population-based study has described five delay intervals among patients <50 years of age with CRC in Ontario, Canada. Some patients in this study experienced prolonged times to treatment, and an important contributor to delay is the time from first investigation to diagnosis. Given the diagnosis of CRC was commonly made with endoscopy, access to this service is an important target for future research, and potentially intervention for younger patients. Further, we have identified an apparent disparity in outcomes between men and women, with young women experiencing a median 26.5 days longer time to treatment from presentation warranting further research.
Data availability statement
The dataset from this study is held securely in coded form at ICES. While legal data sharing agreements between ICES and data providers (eg, healthcare organisations and government) prohibit ICES from making the dataset publicly available, access may be granted to those who meet pre-specified criteria for confidential access, available at www.ices.on.ca/DAS (email: das@ices.on.ca). The full dataset creation plan and underlying analytic code are available from the authors upon request, understanding that the computer programs may rely upon coding templates or macros that are unique to ICES and are therefore either inaccessible or may require modification.
Ethics statements
Patient consent for publication
References
Supplementary materials
Supplementary Data
This web only file has been produced by the BMJ Publishing Group from an electronic file supplied by the author(s) and has not been edited for content.
Footnotes
Contributors MC planned the study, completed the analysis, wrote the manuscript and submitted the study. LP, BEH and AS planned the study, reviewed the analysis and reviewed the manuscript. NF and LN prepared the datasets, assisted in the analysis and reviewed the manuscript. NB planned the study, reviewed the analysis, reviewed the manuscript and supervised the project. NB accepts full responsibility for the work and/or the conduct of the study, had access to the data, and controlled the decision to publish.
Funding This study was supported by ICES, which is funded by an annual grant from the Ontario Ministry of Health (MOH) and the Ministry of Long-Term Care (MLTC). This study also received funding from CIHR. Parts of this material are based on data and information compiled and provided by: MOH, CIHI, CCO, ORG.
Disclaimer The analyses, conclusions, opinions and statements expressed herein are solely those of the authors and do not reflect those of the funding or data sources; no endorsement is intended or should be inferred. Parts of this material are based on data and information provided by Cancer Care Ontario (CCO). The opinions, results, views and conclusions reported in this paper are those of the authors and do not necessarily reflect those of CCO. No endorsement by CCO is intended or should be inferred. Parts of this material are based on data and/or information compiled and provided by CIHI. However, the analyses, conclusions, opinions and statements expressed in the material are those of the author(s), and not necessarily those of CIHI. Parts of this report are based on Ontario Registrar General (ORG) information on deaths, the original source of which is ServiceOntario. The views expressed therein are those of the author and do not necessarily reflect those of ORG or the Ministry of Government Services.
Competing interests None declared.
Provenance and peer review Not commissioned; externally peer reviewed.
Supplemental material This content has been supplied by the author(s). It has not been vetted by BMJ Publishing Group Limited (BMJ) and may not have been peer-reviewed. Any opinions or recommendations discussed are solely those of the author(s) and are not endorsed by BMJ. BMJ disclaims all liability and responsibility arising from any reliance placed on the content. Where the content includes any translated material, BMJ does not warrant the accuracy and reliability of the translations (including but not limited to local regulations, clinical guidelines, terminology, drug names and drug dosages), and is not responsible for any error and/or omissions arising from translation and adaptation or otherwise.