Article Text

Abstract
Research objectives Clostriodiodes difficile infection (CDI) is a major cause of healthcare-associated diarrhoea with high mortality. There is a lack of validated predictors for severe outcomes in CDI. The aim of this study is to derive and validate a clinical prediction tool for CDI in-hospital mortality using a large critical care database.
Methodology The demographics, clinical parameters, laboratory results and mortality of CDI were extracted from the Medical Information Mart for Intensive Care-III (MIMIC-III) database. We subsequently trained three machine learning models: logistic regression (LR), random forest (RF) and gradient boosting machine (GBM) to predict in-hospital mortality. The individual performances of the models were compared against current severity scores (Clostridiodes difficile Associated Risk of Death Score (CARDS) and ATLAS (Age, Treatment with systemic antibiotics, leukocyte count, Albumin and Serum creatinine as a measure of renal function) by calculating area under receiver operating curve (AUROC). We identified factors associated with higher mortality risk in each model.
Summary of results From 61 532 intensive care unit stays in the MIMIC-III database, there were 1315 CDI cases. The mortality rate for CDI in the study cohort was 18.33%. AUROC was 0.69 (95% CI, 0.60 to 0.76) for LR, 0.71 (95% CI, 0.62 to 0.77) for RF and 0.72 (95% CI, 0.64 to 0.78) for GBM, while previously AUROC was 0.57 (95% CI, 0.51 to 0.65) for CARDS and 0.63 (95% CI, 0.54 to 0.70) for ATLAS. Albumin, lactate and bicarbonate were significant mortality factors for all the models. Free calcium, potassium, white blood cell, urea, platelet and mean blood pressure were present in at least two of the three models.
Conclusion Our machine learning derived CDI in-hospital mortality prediction model identified pertinent factors that can assist critical care clinicians in identifying patients at high risk of dying from CDI.
- dietary - gastrointestinal infections
- diarrhoea
- bacterial infection
Data availability statement
Data are available in a public, open access repository. MIMIC-III, a freely accessible critical care database. https://mimic.physionet.org/.
This is an open access article distributed in accordance with the Creative Commons Attribution Non Commercial (CC BY-NC 4.0) license, which permits others to distribute, remix, adapt, build upon this work non-commercially, and license their derivative works on different terms, provided the original work is properly cited, appropriate credit is given, any changes made indicated, and the use is non-commercial. See: http://creativecommons.org/licenses/by-nc/4.0/.
Statistics from Altmetric.com
Summary box
What is already known about this subject?
Clostriodiodes difficile infection (CDI) is one of the most common hospital-acquired infections with high mortality rates.
Several attempts have been made to develop models to predict CDI severity or mortality. However, they are less than ideal due to a lack of routinely recordable variables, low level of discrimination and limited subgroup applicability.
What are the new findings?
Machine learning models are developed to predict in-hospital mortality of patients with CDI.
The proposed machine learning models outperformed existing severity scores in predicting mortality outcomes.
How might it impact on clinical practice in the foreseeable future?
The proposed machine learning models could incorporate variability in laboratory data and comorbidities into prediction.
The proposed models can facilitate early recognition of CDI severity and enable timely intervention to patients in need.
Introduction
Clostridiodes difficile infection (CDI) has been recognised as a major cause of healthcare-associated diarrhoea in adult patients.1 As one of the rising healthcare-associated infections worldwide, it causes a significant burden on hospital resources. The reason for the rise in CDI is largely due to the increasing use of antibiotics in current clinical practice, as well as an ageing patient population in the hospitals.2 Consequently, the disease burden of CDI has been rising, with more elderly patients facing longer hospitalisations, higher healthcare costs, as well as more severe morbidity and mortality.3
C. difficile is transmitted by contact with infected faecal material or spores which can survive in the environment for several months.4 C. difficile is easily passed on via the hands of healthcare workers.5 Antibiotic use is a major risk factor for CDI, causing alterations in gut microbiota that protect against gut infection, resulting in proliferation of C. difficile.6 The primary mediators of inflammation in CDI are large clostridial toxins, toxin A (TcdA) and toxin B (TcdB), which bind to and enter the colonic epithelium. This results in a sequence of host cellular responses to cause diarrhoea, inflammation and tissue necrosis.7 This manifests clinically as asymptomatic colonisation, mild diarrheal illness or more severe disease, including pseudomembranous colitis, toxic megacolon, sepsis and in severe cases, death.8
Treatment recommendations for CDI vary according to disease severity, ranging from oral antibiotics to surgical intervention.9 Metronidazole and vancomycin remain the cornerstone of CDI treatment, while fidaxomicin, a newly approved drug, is a new alternative. In patients with severe CDI, early surgical consultation is recommended by the World Society of Emergency Surgery and the Infectious Diseases Society of America—Society for Healthcare Epidemiology of America.10 Prompt subtotal or total colectomy can reduce mortality11 in patients with megacolon, colonic perforation or for patients with septic shock and associated organ failure.12
Despite the increasing prevalence of CDI in the developed world, validated methods to predict severe disease have not been established.13 We recently published a systematic review of severe CDI predictors, but found that present risk scoring systems have been limited by small sample size and heterogeneity in definition of severe CDI.14 Proposed severity scores such as Clostridiodes difficile Associated Risk of Death Score (CARDS)15 and ATLAS Score16 17 (combination of age, treatment with systemic antibiotics, leucocyte count, serum albumin and serum creatinine) have not been widely adopted in current clinical practice.
The aim of this study is to derive and validate a clinical prediction tool for severe outcomes in CDI. We standardised our measured outcome in this study as mortality to create a straightforward model that predicts for in-hospital CDI mortality. We sought to address limitations of existing severity scores by developing our risk prediction model from a large database, the Medical Information Mart for Intensive Care-III (MIMIC-III)—an open-source, reputable and repeatable electronic-intensive care unit database.
Methods
Data source and extraction
This was a retrospective study, and all patients were de-identified. Thus, informed consent was waived by the ethics committee of Beth Israel Deaconess Medical Center. Data were extracted from MIMIC-III using structure query language (SQL) with PostgreSQL 11.5 (PostgreSQL Global Development Group).18 The MIMIC-III database contains health-related data associated with over 40 000 patients between 2001 and 2012, and it is publicly available.
It comprises health data of over 40 000 patients who stayed in intensive care units (ICUs) of the Beth Israel Deaconess Medical Center, Boston, Massachusetts, USA between 2001 and 2012. The database is comprehensive in nature and includes patient vital sign measurements at 1-hour intervals, demographics, laboratory test results, procedures and caregiver notes. Vincent et al19 and Gehrmann et al20 are notable studies that have leveraged on the MIMIC-III database for large-scale retrospective analyses. Our data-driven approach allows us to develop a CDI severity prediction tool based on clinical outcomes rather than existing literature, eliminating the risk of bias and welcoming new possibilities of CDI severity predictors. Additionally, patients from MIMIC-III are managed in the ICU and thus have comprehensive clinical and biochemical data available, allowing for novel variables to be taken into account when searching for CDI severity predictors.
Inclusion criteria and definition
The patients were extracted based on The International Classification of Diseases, ninth Revision, Clinical Modification code of ‘008.45’, indicating the diagnosis of ‘intestinal infection due to Clostridium difficile’ at hospital discharge. We also extracted data for the first ICU stay of patients aged between 16 and 90 years old. Other extracted information were patients’ demographics (age, gender, comorbidities of diabetes mellitus, chronic kidney disease and chronic ischaemic heart disease), laboratory test results (anion gap, albumin, bicarbonate, bilirubin, creatinine, chloride, glucose, haematocrit, haemoglobin, lactate, platelet, potassium, partial thromboplastin time, international normalised ratio, prothrombin time, sodium, blood urea nitrogen (BUN), white blood cell (WBC) count, calcium, free calcium) and vital signs (heart rate, respiratory rate, SpO2, body temperature, systolic blood pressure, diastolic blood pressure, mean arterial pressure). For patients with multiple measurements of laboratory tests and vital signs, we only kept the results of the first measurement, where the measurement time is closest to the patients’ ICU admission time. Patients’ missing information for laboratory tests and vital signs were imputed with the mean value for each variable in the cohort. Imputation of missing values is crucial for modelling. Removing records with missing values and some other filtering methods have been shown to introduce bias, which affects the performance of models in many ways, thereby limiting their generalisation.21 Imputation with mean values is commonly adopted as it maintains the distribution of predictors.22–24 We also implemented the RidgeRegression model for data imputation with reference to Cosgriff et al25 and similar results were obtained. The endpoint of this study is in-hospital mortality.
Statistical analysis
We trained three machine learning (ML) models: logistic regression (LR),26 random forest (RF)27 and gradient boosting machine (GBM)28 to predict in-hospital mortality based on the clinical features that were commonly measured on patients’ ICU admissions.
LR is commonly used in clinical research to model disease presence (diagnosis) or disease outcomes (prognosis). In our study, we used LR to predict the chance of the outcome based on the characteristics of the risk factors (predictors). A linear combination of predictors is used to fit a ‘logit’ transformation of the probability of the outcome. In the LR model, we reported the results using OR and the corresponding 95% CIs for all covariates.
RF uses random bootstrap samples of raw data samples to construct a series of decision trees and use them for medical prediction and classification tasks. It is a non-parametric classifier that constructs a hierarchical decision tree by splitting the data between the categories of outcome variables at a given step (node) according to the ‘if-then’ rule of a given set of risk factors. The model repeats it into two subnodes, which come from the root node that contains the entire sample (for a detailed description of RF, please refer to Breiman27). This ‘ensemble learning’ classification method could reduce prediction variance and prevent overfitting to training sets.
Similar to RF, GBM model is also a decision tree based approach. Boosting is a group of methods which combine weak learners into strong learners. In decision tree boosting, each decision tree is trained on a subset of original dataset. For example, the first decision tree assigns equal weights to each observation and fits on the equally weighed dataset. After the first decision tree is evaluated, the boosting model re-weights each observation. The weights of difficult cases are increased and the weights of easy cases are decreased. The following decision tree is fitted on this re-weighted data. In this way, the performance of the overall model is improved based on the predictions of the first decision tree. The boosting model is now an ensemble of the first and second decision tree. Next, we evaluate the classification error of the boosting ensemble model and fit the third decision tree to predict the revised residuals. The process is repeated for a defined number of iterations. The new decision trees improve the ensemble model by fitting on the observations that are incorrectly predicted by previous decision trees. The final ensemble model is predicted by the weighted sum of the predicted values of all fitting decision trees. In GBM, particularly, the model uses a loss function to identify weak learners and gradients to minimise the loss.
All three models used the same set of training and testing data. We split the original dataset into 80% train-set and 20% test-set, in which we ensure the proportion of the positive outcomes was the same in both sets by stratifying the dataset based on hospital mortality. An RF-based feature selection method29 was used to detect key features for mortality prediction. The selected features were adjusted as covariates in the three models.
Model performance metrics
In our study, all the models predict the probability of in-hospital mortality for each patient’s ICU stay. We then use this probability as a risk score for clinicians to better understand the overall risk of death for individual patients at admission. If the risk score exceeds a specific threshold, the patient would be classified to a high risk group and receive attention from clinicians in advance.
We plotted receiver operating curve (ROC) according to different selected thresholds and calculated the mean area under ROC (AUROC) to evaluate the performance for each model. To ensure the robustness of our finding, we calculated the 95% CIs of the AUROC with 100 bootstraps of the train-test split. The way of calculating the bootstrapped CIs is inspired by Oh et al,30 where the authors selected the 95th percentile of the predicted probability as the decision threshold for prediction of CDI diagnosis. We computed the AUROC of other proposed severity scores, CARDS and ATLAS, to compare with our model performance. We also computed and compared the selected threshold with accuracy, sensitivity, specificity, positive predictive value (PPV) and negative predictive value (NPV) for all the three models.
In addition, calibration is an important measure of predictive models. Calibration measures the model’s ability to produce predictions that are averagely close to the average observed result. For example, a model is said to be well-calibrated, if for 100 patients with a predicted risk of x%, close to x patients have developed the outcome. We used fivefold cross validation to calibrate each model: for each fold, we used the train set to fit the model and calibrate the trained model on the test set. The probabilities for each of the folds are then averaged for prediction.
Besides, we further investigated features’ importance in each model. For the LR model, we identified statistically significant features with p value <0.05. We ranked the features by the absolute value of their coefficients and obtained the top significant features for LR. For both RF and GBM models, feature importance was determined by counting the times (normalised) when the feature was chosen by the model to split the nodes in the decision trees. The top features are those with more counts. The statistical analyses were performed in Python 3.6. The codes are publicly available.31
Results
From 61 532 ICU stays in the MIMIC-III database, we identified 1315 unique ICU stays with diagnosis of CDI. Demographics and clinical characteristics of the study population are provided (table 1). The mortality rate in the study cohort was 18.33% (241 over 1315 ICU stays). For each bootstrap iteration, train and test set included 1052 and 263 unique ICU stays, respectively. On the test set, CARDS achieved AUROC of 0.57 (95% CI, 0.51 to 0.65) and ATLAS Score achieved 0.63 (95% CI, 0.54 to 0.70). For our proposed models, the LR model achieved a mean AUROC of 0.69 (95% CI, 0.60 to 0.76). RF model achieved AUROC of 0.710 (95% CI, 0.620 to 0.770) and GBM model achieved AUROC of 0.720 (95% CI, 0.64 to 0.78) (figure 1). The calibration was evaluated for each model. In one bootstrapping test set, for example, all of three models demonstrated good calibrations. The Brier scores for LR, RF and GBM models were 0.139, 0.131 and 0.132, respectively.
The basic characteristics of the study cohort
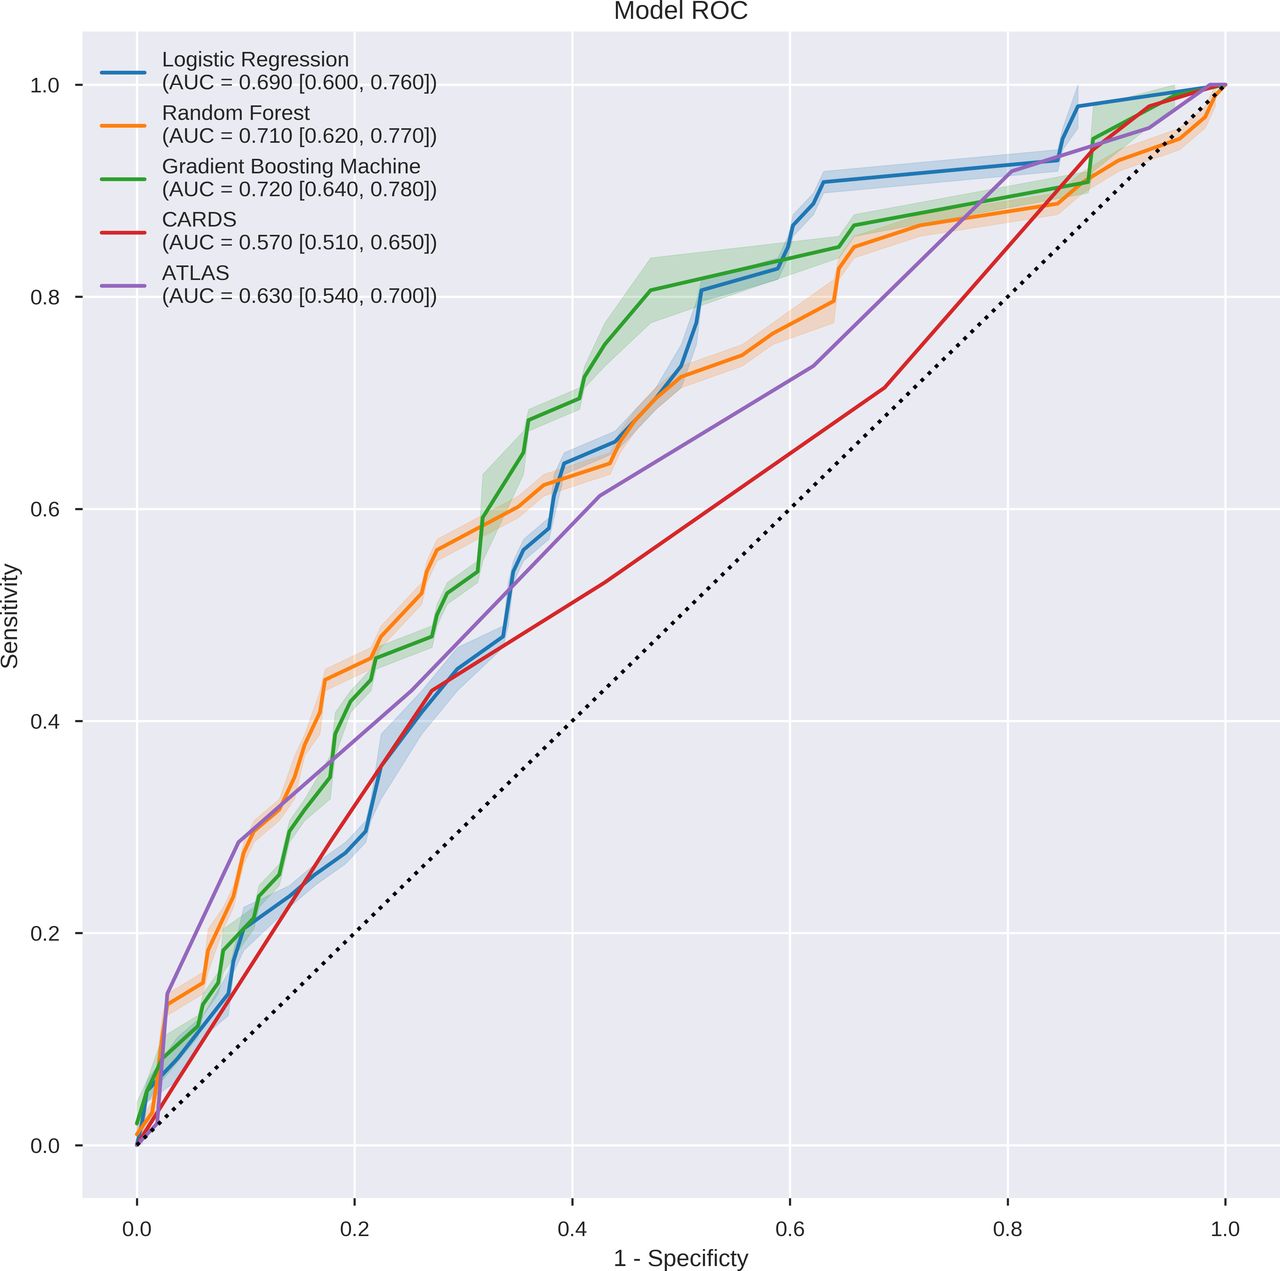
Discriminative performance of the models on the test set. The receiver operating characteristics curves illustrate the trade-off in performance between the false-positive rate (1−specificity) and the true-positive rate (sensitivity). Three models achieved good discriminative performance as measured by the area under the ROC curve (AUROC): logistic regression at 0.69, random forest at 0.71, GBM at 0.72. AUC, Area Under the Curve; ATLAS, Age, Treatment with systemic antibiotics, Leucocyte count, Albumin and Serum creatinine as a measure of renal function; CARDS, Clostridiodes difficile Associated Risk of Death Score; GBM, gradient boosting machine; ROC, receiver operating curve.
The decision threshold of the high risk group was selected based on the 95th percentile of predicted risk scores. LR achieved accuracy of 79.85%, sensitivity of 10.20%, specificity of 95.79% and PPV of 35.71%. RF model achieved accuracy of 84.41%, sensitivity of 22.45%, specificity of 98.60% and PPV of 78.57%. GBM model obtained accuracy of 82.13%, sensitivity of 16.33%, specificity of 97.20% and PPV of 57.14% (figure 2).

Confusion matrices of logistic regression (left), random forest (middle) and GBM (right) on test set. Selecting a decision threshold based on the 95th percentile results in classifiers that achieved good specificity of above 95%. GBM, gradient boosting machine; NPV, negative predictive value; PPV, positive predictive value.
We observed similarities across the models in terms of the top 10 significant features (table 2). Albumin, lactate and bicarbonate were significant for all the models. Free calcium, potassium, WBC, BUN, platelet and mean blood pressure were also important features, which were agreed by two of the three models. Gender and some lab tests results (haemoglobin, hematocrit, anion gap, creatinine) were considered important in the LR model but not in the other two models. Other variables, including heart rate, age, respiratory rate and sodium appeared only once in the list of either RF or GBM but not in LR model.
The top 10 risk/protective factors across three models, ranked from most important to least important
Discussion
In this cohort study, we sought to employ ML in developing a big data-based prediction model to predict in-hospital mortality of patients with CDI admitted to the ICU. All three of our advanced ML algorithms accurately predict the probability of in-hospital mortality for each patient’s ICU stay. All ML models had adequate discrimination (ie, AUROC between 0.69 and 0.72) in predicting patient mortality. Our AUROC was comparable to that of the CARDS proposed by Kassam et al15, which was 0.77. Though the PPV was low for our ML models, the specificity of the three models was high, ranging from 95.79% to 98.60%.
By using RF model and 95% percentile threshold, the cohort can be stratified into high-risk and low-risk groups. In the high-risk group, 100% of the patients had albumin values beyond normal range (3.4 to 5.4 g/dL); 78.57% of the patients had lactate values beyond normal range (0.5 to 2.2 mmol/L); 100% of the patients had bicarbonate values beyond normal range (23 to 30 mEq/L). In the low-risk group, 78.31% of the patients had albumin value beyond normal range; 52.61% of the patients had lactate values out of normal range; 64.66% of the patients had bicarbonate values out of normal range. The mortality of high-risk group is 57.14% while the mortality rate of low-risk group is 18.87%.
We also found several variables which were not typically incorporated into risk scores such as platelet, in addition to more established predictors such as albumin level, BUN level and WBC count. Our ML models could incorporate variability in laboratory data and many comorbidities into prediction, which other standard prognostic tools are unable to perform.
One advantage of ML classifiers, such as random-forest approaches, over purely regression-based classifiers, is that ML can take into account unexpected predictor variables and possible connections.32 There can be many potential predictors, especially with increasing use of electronic health records, which may be overlooked with a predefined hypothesis.33 34 An advanced ML approach allows for evaluation of far more clinical variables than would be present in traditional modelling approaches. Hence ML algorithms can promote identification of clinically important variables in patients with C. difficile which may not be recognised with a more conventional approach.
In our study, we found that albumin, lactate and bicarbonate were significant across all models. The finding of serum albumin being a predictor of mortality is concordant with our previous systematic review, which showed that at least five of the 31 articles identified prior comorbidities, age, white blood cell count, serum albumin, serum creatinine and ICU admission as predictors of severity.14 Interestingly, none of the 31 studies on C. difficile severity predictors included lactate and bicarbonate levels. Furthermore, all international clinical guidelines on severe CDI, such as American College of Gastroenterology and European Society of Clinical Microbiology and Infectious Diseases, do not include lactate and bicarbonate levels. Elevated lactate levels are known to be significantly associated with in-hospital mortality and are featured in the surviving sepsis bundle.35 Likewise, low bicarbonate and anion gap, which is observed in metabolic acidosis, has been used in assessing in-hospital mortality for patients admitted to the ICU36 for patients with acute pancreatitis37 or cardiogenic shock.38 These biomarkers, when taken together and weighted according to their importance in our prediction models, can tell us more about the condition of a patient than just one biomarker alone. Similarly, factors which predicted mortality in CDI in two out of three of our models, namely free calcium, potassium and lactate, were not mentioned by any of the 31 studies. This could be due to the lack of availability of such data in the wards.
Our study is unique as it assesses the patient’s parameters at the point of admission to the ICU instead of the point of diagnosis of C. difficile, as proposed by other studies. Analysing patients’ data at ICU admission would be representative of the patient population whose management can best benefit from our study, as data analysed are reflective of patients with severe CDI requiring ICU management. The ultimate aim of our proposed ML model is to prognosticate patients with CDI and to catch those whose conditions are likely to worsen early on.
We recognise the limitations faced by our study. Data were retrospectively extracted from the MIMIC-III database, an electronic health record of a single academic medical centre in the USA, which may result in concerns regarding the generalisability of conclusions. We attempted to alleviate this limitation by evaluating our models with 100 bootstrapping iterations and obtaining CIs for each model. The data and codes are publicly available to researchers to replicate the study and evaluate the generality of the proposed models. Inherent to the retrospective nature of the study, we face selection bias as the majority of the population are Caucasian with few African Americans and Asians. The future plan of our study is to conduct prospective research to understand the real-time performance of proposed models. In addition, as data were collected over the duration of 2001–2012, treatment and practices may vary from the current standard. However, as the pathophysiology of progression in CDI is likely to remain unchanged, the clinical progression and laboratory values of these patients remain applicable. Another limitation is that the decision threshold of prediction was selected based on 95th percentile of the predicted probability.30 In future studies, cross-validation methods can be used to select the optimal percentile and decision threshold in a data-driven manner. Imputation of missing values can be another limitation of this study. The imputation of mean values may not provide utility in the clinical settings. Regression-based imputation method such as ridge regression could be used as an alternative method. In our experiments, we obtained similar results when the missing values were imputed by ridge regression model. Furthermore, external validation of the model was not performed. External validation in a separate, independent dataset is considered important in fully evaluating the performance of prognostic models, and will be the direction of our future research.
In conclusion, by learning from the shortcomings of previous severity models, we have employed a robust and objective ML approach, while capitalising on one of the most extensive ICU databases to develop a CDI severity prediction model. This can potentially transform hospital care of patients by alerting clinicians of deteriorations and making timely intervention available to patients. Further exploration in clinical studies would be necessary to verify and refine our CDI predictor.
Data availability statement
Data are available in a public, open access repository. MIMIC-III, a freely accessible critical care database. https://mimic.physionet.org/.
Ethics statements
Patient consent for publication
References
Footnotes
HD and KTHS contributed equally.
Contributors HD contributed to study design, data extraction, methods, data analysis and manuscript preparation. KTHS contributed to project director and principal investigator, study design, data interpretation and manuscript preparation. VZR-Y contributed to data interpretation and manuscript preparation. RT contributed to data interpretation and manuscript preparation. WY contributed to data extraction, data interpretation and data analysis. CS contributed to data extraction, data interpretation and data analysis. MTKC contributed to study design and data interpretation. ML contributed to data extraction and data analysis. XL contributed to data extraction and data analysis. YYT contributed to study design, data interpretation and data analysis. MF contributed to project director and principal investigator, study design, method and manuscript preparation. KTHS acting as guarantor. All authors have approved the final version of the manuscript submitted.
Funding This project is partially supported by the National Research Foundation, Singapore under its AI Singapore Programme (AISG Award No: AISG-100E-2020-055).
Competing interests None declared.
Provenance and peer review Not commissioned; externally peer reviewed.