Article Text

Abstract
Objective Cirrhotic patients are at high hospitalisation risk with subsequent high mortality. Current risk prediction models have varied performances with methodological room for improvement. We used current analytical techniques using automatically extractable variables from the electronic health record (EHR) to develop and validate a posthospitalisation mortality risk score for cirrhotic patients and compared performance with the model for end-stage liver disease (MELD), model for end-stage liver disease with sodium (MELD-Na), and the CLIF Consortium Acute Decompensation (CLIF-C AD) models.
Design We analysed a retrospective cohort of 73 976 patients comprising 247 650 hospitalisations between 2006 and 2013 at any of 123 Department of Veterans Affairs hospitals. Using 45 predictor variables, we built a time-dependent Cox proportional hazards model with all-cause mortality as the outcome. We compared performance to the three extant models and reported discrimination and calibration using bootstrapping. Furthermore, we analysed differential utility using the net reclassification index (NRI).
Results The C-statistic for the final model was 0.863, representing a significant improvement over the MELD, MELD-Na, and the CLIF-C AD, which had C-statistics of 0.655, 0.675, and 0.679, respectively. Multiple risk factors were significant in our model, including variables reflecting disease severity and haemodynamic compromise. The NRI showed a 24% improvement in predicting survival of low-risk patients and a 30% improvement in predicting death of high-risk patients.
Conclusion We developed a more accurate mortality risk prediction score using variables automatically extractable from an EHR that may be used to risk stratify patients with cirrhosis for targeted postdischarge management.
- cirrhosis
- mortality
- risk prediction
- survival models
- time-varying covariate models
This is an open access article distributed in accordance with the Creative Commons Attribution Non Commercial (CC BY-NC 4.0) license, which permits others to distribute, remix, adapt, build upon this work non-commercially, and license their derivative works on different terms, provided the original work is properly cited, appropriate credit is given, any changes made indicated, and the use is non-commercial. See: http://creativecommons.org/licenses/by-nc/4.0/.
Statistics from Altmetric.com
Summary box
What is already known about this subject?
Cirrhosis has a high mortality and early risk stratification, especially in hospitalised patients, is important.
Current risk models have widely varying performances depending on the study and cohort.
Existing models are built assessing patients at a single point in time, for example, at hospital discharge.
What are the new findings?
This paper builds a model with 73 976 patients comprising 247 650 hospitalisations with granular clinical data, resulting in a model with a C-statistic of 0.863.
The Net Reclassification Index, a measure of model improvement, shows a 25% improvement in predicting survival of low-risk patients compared with existing models.
How might it impact on clinical practice in the foreseeable future?
Increasing efforts to implement real-time models within electronic health record systems may allow more complex models to guide interventions such as care management and referral to hospice.
Introduction
Cirrhosis has increased from being the fourteenth to being the eighth cause of death in the USA1 with similar increases seen globally.2 Patients with cirrhosis are at increased risk of hospital admission due to various causes, increased risk of readmission, and increased risk of death compared with the general population.3 Prognostication can help guide clinical decision making, transplant referral, care coordination, and hospice enrolment. Performance of the most common cirrhosis risk prediction models, including the model for end-stage liver disease (MELD),4 model for end-stage liver disease with sodium (MELD-Na),5 Chronic Liver Failure Consortium-Sequential Organ Failure Score,6 CLIF Consortium acute decompensation (CLIF-C AD) score,7 and the CLIF Consortium Acute on Chronic Liver Failure score,8 has been varied.7–10
A systematic review of cirrhosis survival models by D’Amico and colleagues found 181 studies11; however, these studies were still limited by focusing on a selected group of patients with relatively small sample sizes, built on purely administrative databases with limited information, lacking validation, controlling for overfitting, or providing calibration metrics. Risk prediction models require revalidation and recalibration when applied in a new cohort as their performance often degrades due to changes in prevalence of risk factors and case mix.12 Model performance can also degrade over time even when used within the same institution.13 Because of widespread electronic health record (EHR) system adoption, very large datasets have become available for advanced analytics and machine learning.14
Due to these reasons, it is imperative that the models be anchored into the health system of use. It is also important to deploy many of these tools within an EHR in an automated fashion because of the increasing use of these tools and the need to minimise user burden and facilitate scalability. The Department of Veterans Affairs (VA) faces a higher burden of patients with cirrhosis than the general US population,15 and the literature evaluating cirrhosis mortality in this cohort has been limited.16–19 Opportunities exist for improved cirrhosis care for veterans,19–21 and better mortality prediction may help motivate this care. Numerous studies have focused on posthospital discharge risk stratification in order to more effectively target care, either for the purpose of preventing inappropriate readmission or leveraging shared decision making to motivate palliative care referral.22 We hypothesised that a model built using a large EHR database, using present-on-admission data and information collected automatically during the hospitalisation, could outperform traditional mortality risk measures.
Methods
Study population
This work was part of a multiyear, multisite study to improve cirrhosis care at the Department of VA. We have previously published our efforts on predicting hospital readmission, and we refer readers to that study for further details on this cohort.23 We analysed a retrospective cohort of patients with cirrhosis hospitalised for any cause from among 123 medical centres in the Department of VA between 1 January 2006 and 31 December 2013, with historical data from 1 January 2005 to allow for variable ascertainment. Patients were identified by using International Classification of Diseases, Ninth Revision (ICD-9) codes 571.2 (alcoholic cirrhosis), 571.5 (non-alcoholic cirrhosis), or any code identifying a history of a cirrhosis complication (varices, hepatic encephalopathy, hepatorenal syndrome, or portal hypertension). The full list of ICD-9 codes used is provided in online supplementary appendix table 1. Previous studies have shown that using administrative codes for cirrhosis or one of its cardinal complications can accurately identify a retrospective cohort with a positive predictive value (PPV) ranging from 84% to 92%.24
Supplemental material
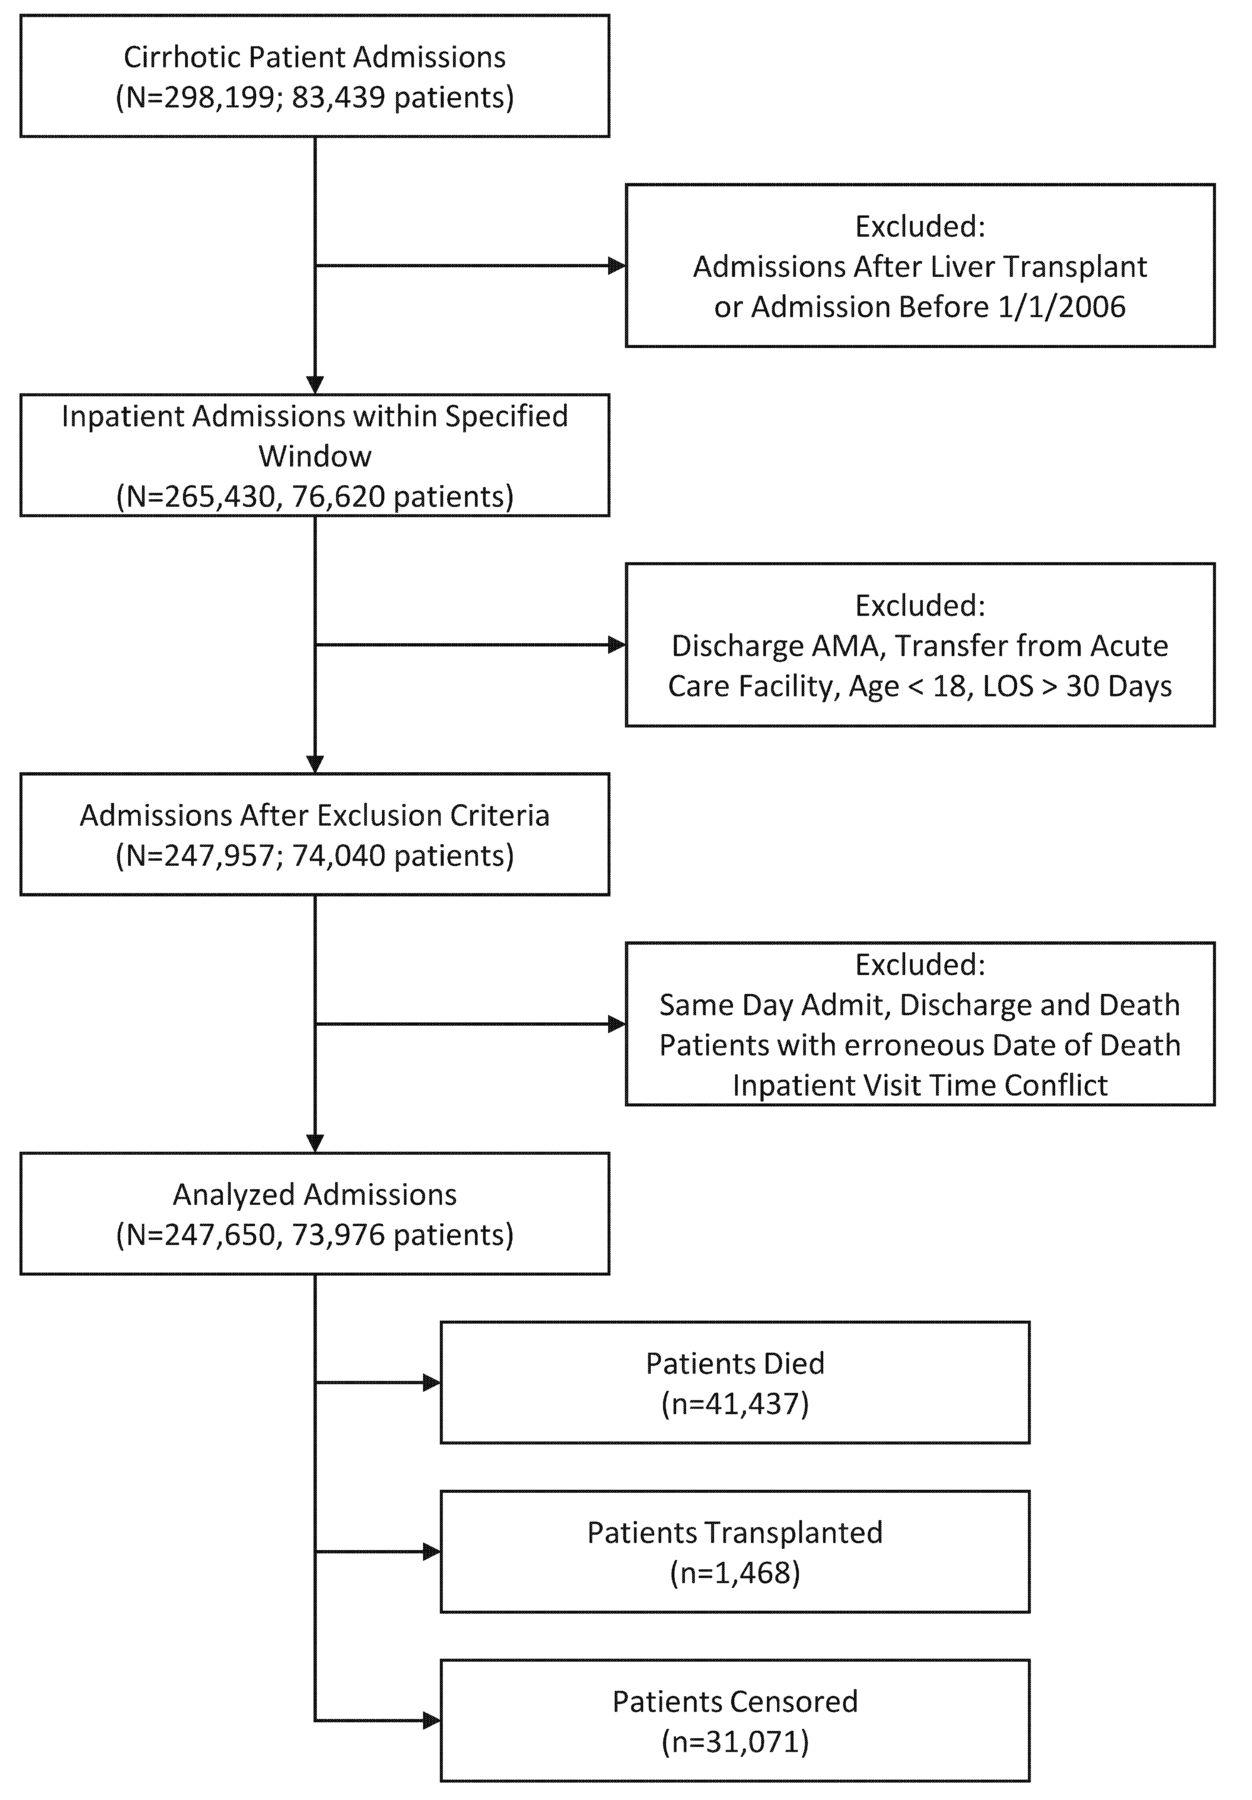
We included hospitalisations from patients who had the previously mentioned cirrhosis or cirrhosis complication codes at any time prior to the index hospitalisation. We excluded hospitalisations if the patient was discharged against medical advice, all hospitalisations after liver transplant (including the transplant hospitalisation itself), if the patient was transferred from another acute care hospital, paediatric patients, or if the hospital length of stay was greater than 30 days. We excluded hospitalisations with lengths of stay greater than 30 days because they were related frequently to issues with identifying a discharge disposition for the patient, rather than severity of illness. Refer to figure 1 for cohort flow diagram.

Flow of patients from total number of patients before exclusion criteria to total number of patients included in the study. AMA, against medical discharge; LOS, length of stay.
Data collection
The Veterans Health Administration is America’s largest integrated healthcare system, serving nine million enrolled military veterans each year, and including acute inpatient hospitals, outpatient primary care and subspecialist clinics, outpatient pharmacies, rehabilitation facilities, and long-term care facilities. All VA personnel use the same EHR for documentation and clinical care.25 The VA Informatics and Computing Infrastructure project has colocated and harmonised data from all VA sites into a corporate data warehouse.26
Predictor variables
We initially evaluated a broad range of variables encompassing demographics, medications, laboratory values, diagnoses and procedures, vital signs, and healthcare use. To eliminate noise variables and to reduce overfitting, we performed variable selection using a penalised Cox proportional hazards model, using the L1 penalty (least absolute shrinkage and selection operator (LASSO)), to select a subset of the predictor variables.27 Our final model contained 45 variables.
The creatinine value was transformed with the natural logarithm. Restricted cubic splines modelled three continuous variables (age, Body Mass Index (BMI), and creatinine) to take into account the non-linear effect on the hazard. Medications were represented by their drug class, for example, ‘beta blockers’, using VA drug class codes.28 We also represented certain medications frequently used to treat cirrhosis-related complications, for example, lactulose, as separate, individual variables.
Each variable was calculated during the following time points: start of every inpatient stay, discharge of every inpatient stay, patient death, and patient censoring. This pattern of repeated sampling of the predictor variables in our time-dependent model led to the natural occurrence of two time windows: the outpatient and the inpatient windows (refer to figure 2). We performed multiple imputation for missing values using non-negative matrix factorisation29 via the R Non-Negative Linear Models (NNLM) package.30 We refer the reader to online supplementary appendix table 2 and Further clarification subsection, for further details regarding the methods and a description of all candidate variables.
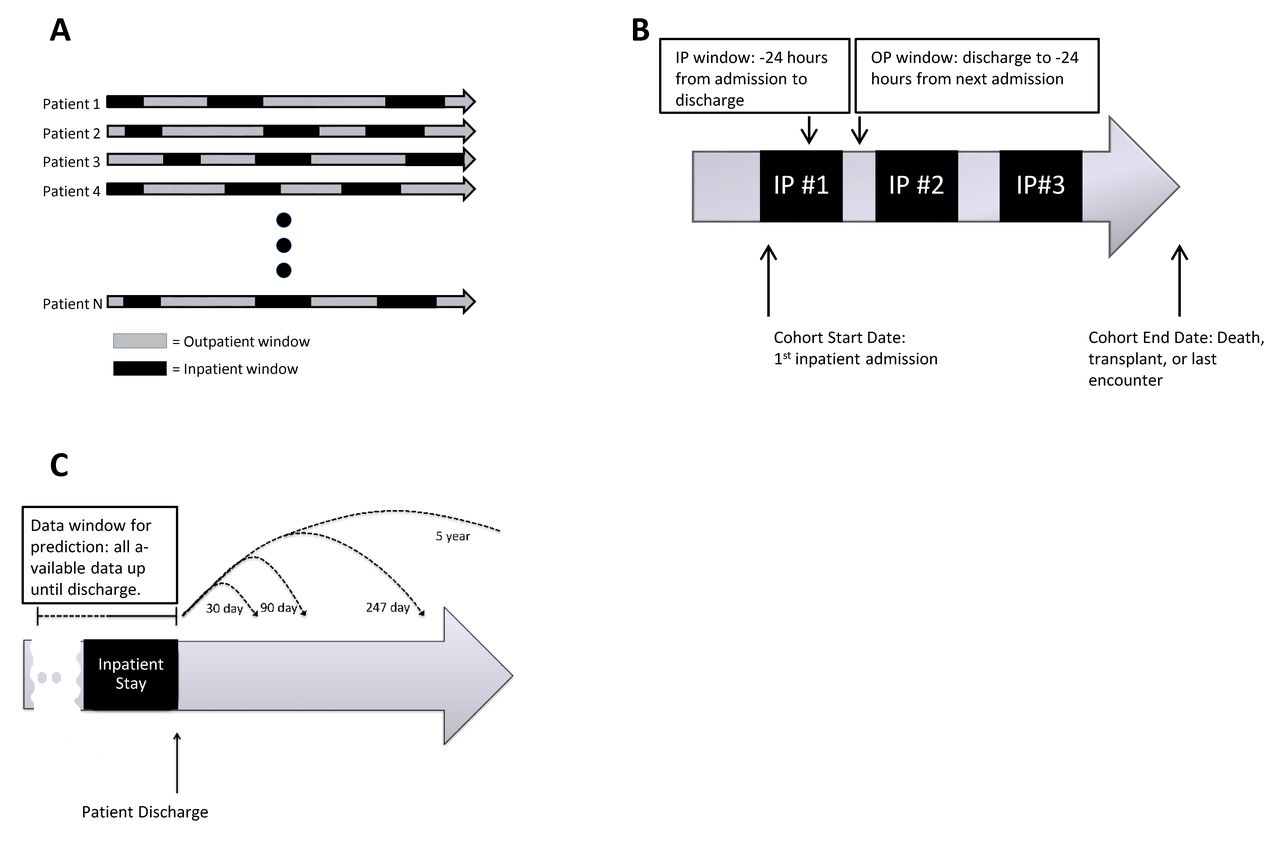
Outpatient (OP) versus inpatient (IP) time windows and variable ascertainment. Each patient’s clinical course is summarised by a series of IP and OP time periods. The patient’s clinical course, represented by all of the variables in the model, was calculated during the following time points: start of every IP stay, discharge of every IP stay, patient death, and patient censoring, allowing for time-varying coefficients in the Cox proportional hazards model. (A,B) Data used for model creation. (C) Model being used for prediction, where a clinical prediction can be made for any time point using the same survival model.IP, inpatient; OP, outpatient.
Statistical analysis
We constructed an unpenalised time-dependent covariate Cox proportional hazards model31 with the primary outcome being all-cause death and using the 45 features identified by the variable selection procedure; we censored at liver transplant, date of last encounter with the VA health system, or study end. We used a time-dependent covariate model to incorporate information from multiple time points from the patient’s clinical course for improved model performance. We assessed overall discrimination using Harrell’s C-statistic.32
Unlike logistic regression, survival models allowed us to perform prediction at any postdischarge time point (refer to figure 2). To better contrast our model against extant models, in addition to global performance, we specifically assessed performance at predicting 90-day mortality. We evaluated discrimination and calibration using the area under the receiver operating characteristic curve (AUC) and the Estimated Calibration Index (ECI). The ECI looks at the squared difference between the predicted probability and an estimated observed probability, ranging between 0 and 100, with 0 meaning perfect calibration.33 Additionally, we graphically analysed calibration by investigating the smoothed observed-to-predicted probability plot.33
We internally validated our model by conducting 100 bootstrap evaluations to build the 95% bootstrap CI for the overall C-statistic, 90-day AUC, 90-day ECI, and Net Reclassification Index (NRI). We refer the reader to the online supplementary appendix figure 1 and Further clarification subsection for a graphical overview of our methods and further details. All statistical analyses were performed using the R statistical programming suite V.3.5.1.
Model comparison
We compared our model against the MELD,4 MELD-Na,5 and the CLIF-C AD7 scores calculated at discharge. We recalibrated the three scores by constructing separate univariate survival models. We tailored the three extant models to the validation cohort because of differences in mortality and risk factors among VA patients.12
To demonstrate clinical utility, we analysed performance for two use cases: (1) identifying patients at very low risk of dying, <5%; and (2) finding very high-risk patients, >40% risk of dying.34 35 We report the PPV and the NRI of our model compared with the extant models. The NRI offers a global assessment of the trade-off between true positives and false positives, with values of >0 indicating improved prediction performance.
Sensitivity analyses
We performed four sensitivity analyses (1) treating death and liver transplant as a composite outcome, (2) assessing model performance for cirrhosis-related admissions, (3) comparing model performance for patients with and without heart failure, and (4) comparing model performance for patients with and without diabetes. Although treating transplant as a competing risk may be optimal, it does not easily extend to a time-dependent model.36 Because a minority of our patients underwent a transplant (1468, 2%) we chose to treat it as a censoring event; however, we report the sensitivity analysis to assess for risk of bias. Importantly, in order to provide additional directly comparable results to pre-existing models, we evaluated a new and prior model performance on cirrhosis-related admissions (definition in online supplementary appendix, Further clarification subsection).
Results
Study population
After applying inclusion and exclusion criteria, 73 976 patients were included in the study with a total of 247 650 hospitalisations. Men represented 97.8% of the total admissions, with an age of 60.7±9.0 (mean±SD). Caucasian and African–American patients accounted for the majority of hospital admissions (73.7% and 18.3%, respectively). The aetiology of cirrhosis was mainly alcoholic (30.9%), viral hepatitis (14.2%), or alcoholic and viral (35.7%). In the remaining patients, the causes of cirrhosis were NAFLD (30 921, 12.5%), other/cryptogenic (40 309, 16.3%), primary biliary cirrhosis (1096, 0.4%), haemochromatosis (1087, 0.4%), and autoimmune hepatitis (393, 0.2%) . The average MELD score across all hospitalisations was 12.7±5.2 (mean±SD), though of note,we had 39 529 admissions with a MELD score of ≥18. Refer to table 1 for a description of the cohort.
Demographic, clinical and laboratory variables of included patients across all admissions
There was a median follow-up of 474 days (IQR 111–1159) for a total of 149 232 patient-years. Adjusting for bias from early deaths using the Kaplan-Meier estimate of potential follow-up, follow-up improved to 1054 days (IQR 359–1993).37 The median survival from time of first hospitalisation was 1064 days (IQR 207–2444). There were 41 437 events for an overall mortality of 56.0%. Figure 2 within the online supplementary appendix depicts the stratified survival curves.
Predictors of mortality
Table 2 presents the statistically significant HRs for the variables in the model. Refer to online supplementary appendix table 3 for HRs for all variables. All cirrhosis complications, vitals indicating haemodynamic instability, and lower BMI increased mortality. Many of the laboratory variables were statistically significant but had an overall weak effect size when predicting mortality except for albumin and total bilirubin. Every gram per decilitre increase in serum albumin concentration decreased the HR by 30% (HR 0.70, 95% CI 0.68 to 0.71) and every gram per decilitre increase in bilirubin increased the HR by 5% (HR 1.05, 95% CI 1.05 to 1.05). Using splines allowed us to investigate the non-linear effect of serum creatinine on mortality, with increasing mortality at the extremes (refer to online supplementary appendix figure 3). Compared with a baseline creatinine of 1.0 mg/dL, a creatinine of 2.0 and 0.4 has HRs of 1.43 (95% CI 1.39 to 1.47) and 1.12 (95% CI 1.05 to 1.20), respectively. Discharge to any location other than home significantly increased mortality from 1.30 (95% CI 1.01 to 1.67) for unknown discharge disposition up to 4.73 (95% CI 3.66 to 6.10) for discharge to hospice. Medications had varied effects on mortality, though overall themes included medications being used to treat complications, for example, lactulose (HR 1.24, 95% CI 1.19 to 1.28), associated with higher mortality.
Statistically significant HRs from the time-dependent Cox proportional hazards model
Mortality risk model performance
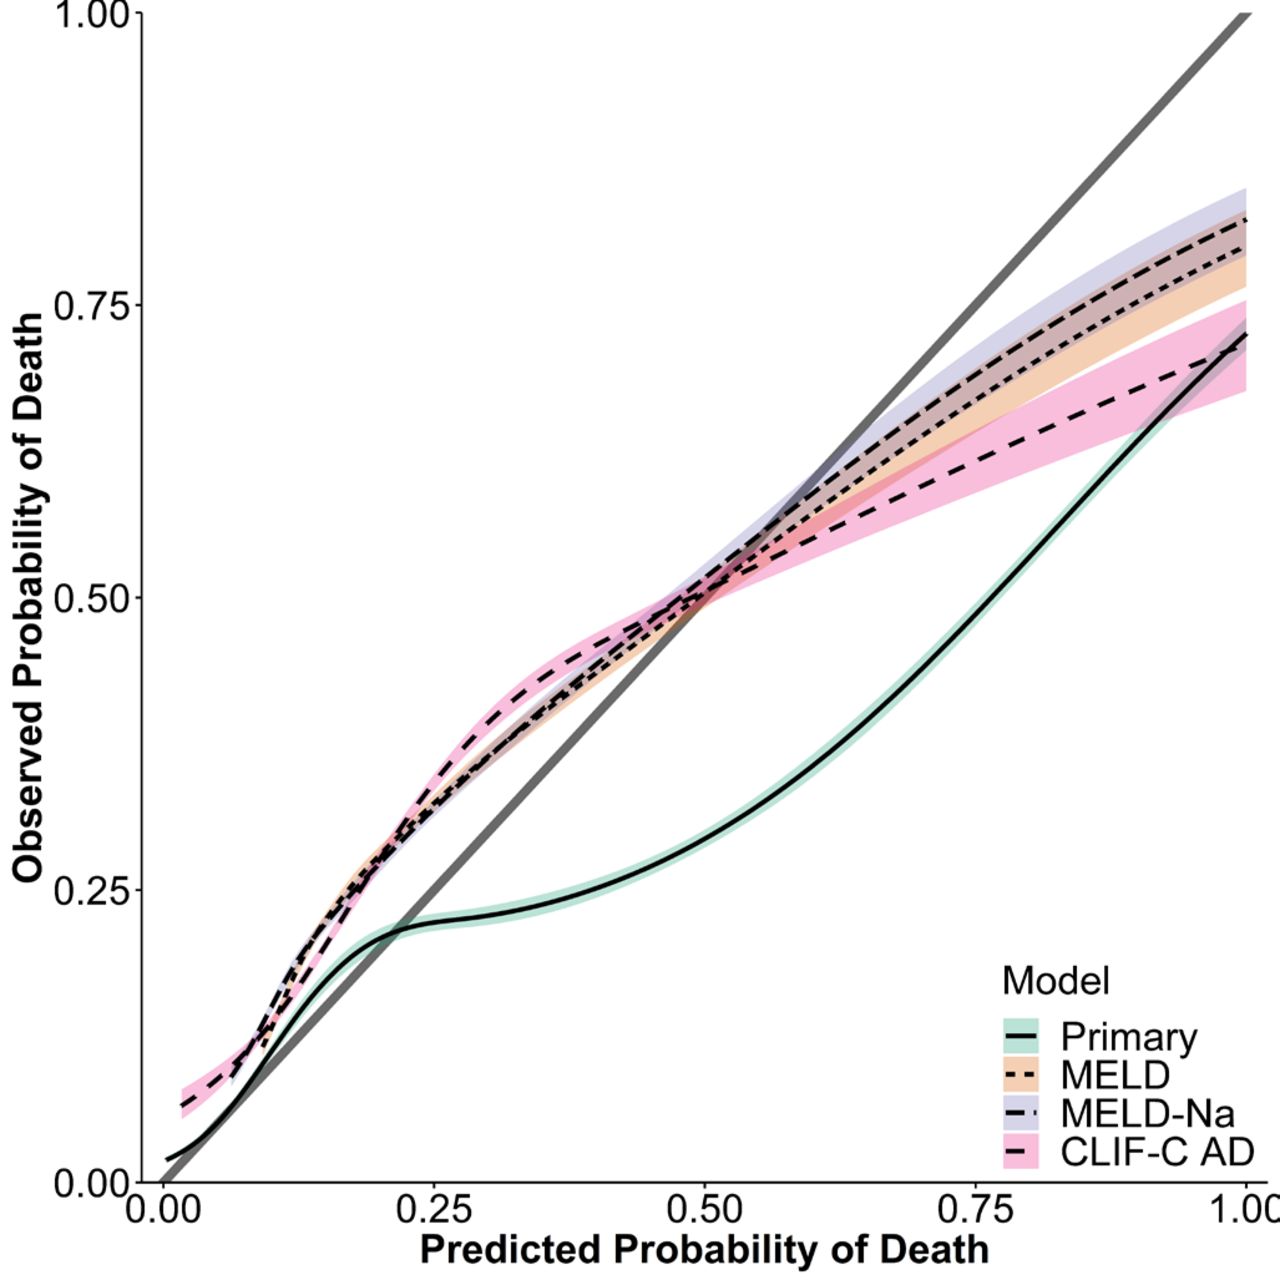
The model presented good discrimination with a C-statistic of 0.863 (95% CI 0.863 to 0.864). For the specific use case of predicting 90-day mortality, our model showed good discrimination, with an AUC of 0.79 (95% CI 0.79 to 0.79). Figure 3 demonstrates the observed-to-expected probability plot for the 90-day prediction. We see excellent calibration for predicted probabilities less than 0.25, which represented 23 286/50 108 (46.5%) of the observations in our model validation dataset. The three extant models, however, show systematic underpredicion and overprediction for probabilities less than and over ~0.60, respectively.
Observed-to-expected probability plot for 90-day prediction compared with MELD, MELD-Na, and CLIF-C AD. Perfect calibration lies along the identity line as depicted by the grey line. MELD, model for end-stage liver disease; MELD-Na, model for end-stage liver disease with sodium; CLIF-C AD, CLIF Consortium acute decompensation score.
Comparison to existing models
Our model’s performance, as measured by the C-statistic, was significantly better than the MELD, MELD-Na, and CLIF-C AD scores: 0.863 vs 0.655, 0.675, and 0.679, respectively (table 3). Global prediction error rate, when compared with other scores, improved by 27.1%–31.8% (refer to online supplementary appendix, Further clarification subsection, for details). When looking at the classification error, our model had a PPV of 9816/10 092 (97.3%) when identifying low-risk patients (predicted mortality at 90 days of <5%). Due to overprediction, the MELD and MELD-Na models did not generate any predictions of <5%. The CLIF-C AD had a PPV of 88.5% for identifying low-risk patients; however, the CLIF-C AD only predicted low risk for 407 out of the 50 108 patient validation cohort, resulting in a sensitivity of 1.0%. Similarly, for high-risk patients, our model afforded the highest PPV (54.5%) at the highest sensitivity (28.5%) compared with the other models. Refer to table 3 for details.
Predictive performance for our model versus the MELD, MELD-Na and CLIF-C AD
Using the NRI, our model achieved a 24% improvement in predicting survival of patients at low mortality risk and a 29%–31% improvement in predicting death accurately for high-risk patients. Refer to the online supplementary appendix figure 4 for details.
Sensitivity analyses
The sensitivity analyses, treating transplant as a composite outcome with death and cirrhosis-related readmission performance, demonstrated little change in model discrimination. Model performance for predicting 90-day mortality did not differ between patients with and without heart failure (AUC of 0.78 (95% CI 0.78 to 0.79) vs 0.79 (95% CI 0.78 to 0.79)). There was a slight degradation in performance in predicting 90-day mortality for patients with versus without diabetes (AUC of 0.77 (95% CI 0.77 to 0.78) vs 0.80 (95% CI 0.79–0.80)). We refer the reader to online supplementary appendix tables 4–7, online supplementary appendix figures 5 and 6 for details.
Discussion
In this national VA cohort study of patients with cirrhosis, the overall mortality was 56%, with 90-day, 6-month, and 1-year postdischarge mortalities of 18%, 24%, and 32%, respectively. We used data analytical techniques with the entire medical record to develop a model with good discrimination and calibration, and we were able to identify a large group of patients in the model validation cohort (10 092/50 108, 20.1%) with a very low 3-month mortality (predicted probability of death of <5%, observed survival rate of 97.3%), suggesting possible reallocation of healthcare resources for these patients. Though calibration was modest for high-risk patients, the model still outperformed the MELD, MELD-Na, and CLIF-C AD at identifying patients with poor prognosis who should be targeted for increased scrutiny and case management, in order to either prevent early readmission or motivate hospice referral.38
Though the MELD and the MELD-Na have become the de facto standards for mortality prediction in cirrhosis, their performance in subsequent studies has been highly varied.7–10 39 Because the models were built using small-sized to modest-sized cohorts, changes in case mix and unmeasured factors can have significant effects on subsequent model performance. Despite recalibrating the MELD, MELD-Na, and CLIF-C AD scores to our VA cohort and limiting the analysis to comparable subcohorts, they performed modestly in this population. Our NRI analysis shows that our model would correctly classify an additional 24 out of every 100 discharged hospital patients as low risk compared with existing models while keeping false positives at <3%.
Compared with these traditional risk scores, opportunities exist for advanced clinical decision support using state-of-the-art models, potentially involving tens or hundreds of variables. Our database of over 250 000 hospitalisations allowed us to evaluate a wide range of predictors. More importantly the EHR allows automated calculation and integration of risk stratification into the clinical workflow for decision support. Similar to recent work on advanced predictive analytics, our model is not intended to be directly calculated by the clinician at the bedside, but instead automatically assessed by the EHR and compiled into dashboards for care coordination efforts.40 41 For example, Amarasingham et al42 reduced heart failure readmissions by 27% by integrating a complex, automated predictive model with the EHR.
Our analysis has limitations. Because the Veterans Health Administration care system is limited to American military veterans, our cohort largely comprises male patients and may not generalise to a population with a greater proportion of female patients. Second, the models we used were internally validated, and the generalisability of those models will need to be assessed through external validation in other populations. We used variables that are present in all EHRs and healthcare delivery environments, making generalisability more likely. Third, our model’s predictor variables were extracted from the EHR and susceptible to coding errors and may have to be revalidated for ICD-10 codes. Fourth, the majority of VA patients seek care within the VA’s integrated care system; however, there will be a small minority who are hospitalised at other facilities. However, of note, the VA clinical data warehouse does capture administrative claims data for outside hospitalisations if the VA acts as the payer.
In summary, this study identified a high mortality rate in patients with advanced liver disease. To our knowledge, this is the largest study predicting cirrhosis mortality using granular clinical data. Our model, one of the first employing a time-dependent covariate survival model for cirrhosis mortality, also allows predictions at any time point within our study’s 4-year follow-up time frame. We demonstrate the promise of big data analytics over traditional risk measures and suggest opportunities for an EHR-derived risk algorithm that can help stratify patients to personalise care.
Acknowledgments
We thank Dr Siddharth Singh for helpful comments on this manuscript.
References
Footnotes
Twitter @@JejoKoola
Contributors JDK, MEM and SH contributed to the concept and design. JDK, GC, AMP, AC, SED, and MEM contributed to the statistical analysis. All authors contributed to writing the manuscript.
Funding JK was supported by the Department of Veterans Affairs, Office of Academic Affiliations, Advanced Fellowship Program in Medical Informatics, and the Department of Biomedical Informatics, Vanderbilt University, Nashville, Tennessee. GC was supported by the NIH Precision Medicine Initiative Cohort Program Data and Research Support Center (1U2COD023196). MEM, GC, AMP, and SBH were supported by Veterans Health Administration Health Services Research & Development Investigator Initiated Research (IIR 13-052). SED was supported by the National Library of Medicine (5T15LM007450).
Competing interests None declared.
Patient consent for publication Not required.
Ethics approval The institutional review board and research and development committees of the Tennessee Valley Healthcare System VA Medical Center, Nashville, Tennessee, approved this study.
Provenance and peer review Not commissioned; externally peer reviewed.
Data availability statement No data are available. The Department of Veterans Affairs does not allow release of patient data, even in de-identified format.