Article Text

Abstract
Objective Obesity is a risk factor for colorectal cancer (CRC), accounting for more than 14% of CRC incidence. Microbial dysbiosis and chronic inflammation are common characteristics in both obesity and CRC. Human and murine studies, together, demonstrate the significant impact of the microbiome in governing energy metabolism and CRC development; yet, little is understood about the contribution of the microbiome to development of obesity-associated CRC as compared to individuals who are not obese.
Design In this study, we conducted a meta-analysis using five publicly available stool and tissue-based 16S rRNA and whole genome sequencing (WGS) data sets of CRC microbiome studies. High-resolution analysis was employed for 16S rRNA data, which allowed us to achieve species-level information to compare with WGS.
Results Characterisation of the confounders between studies, 16S rRNA variable region and sequencing method did not reveal any significant effect on alpha diversity in CRC prediction. Both 16S rRNA and WGS were equally variable in their ability to predict CRC. Results from diversity analysis confirmed lower diversity in obese individuals without CRC; however, no universal differences were found in diversity between obese and non-obese individuals with CRC. When examining taxonomic differences, the probability of being classified as CRC did not change significantly in obese individuals for all taxa tested. However, random forest classification was able to distinguish CRC and non-CRC stool when body mass index was added to the model.
Conclusion Overall, microbial dysbiosis was not a significant factor in explaining the higher risk of colon cancer among individuals with obesity.
- colonic bacteria
- colorectal cancer
- obesity
This is an open access article distributed in accordance with the Creative Commons Attribution Non Commercial (CC BY-NC 4.0) license, which permits others to distribute, remix, adapt, build upon this work non-commercially, and license their derivative works on different terms, provided the original work is properly cited, appropriate credit is given, any changes made indicated, and the use is non-commercial. See: http://creativecommons.org/licenses/by-nc/4.0/.
Statistics from Altmetric.com
Introduction
The health risks associated with overweight and obesity include diabetes, cardiovascular disease and cancer. The National Cancer Institute estimates that 3.2% of all new cancers are due to obesity and that 14% of deaths from cancer in men and 20% in women are attributed to obesity.1 2 Colorectal cancer (CRC) accounts for approximately 142 000 new cancer cases and 50 000 cancer deaths annually, making it the second most lethal cancer in the USA (SEER). Several epidemiological studies demonstrate that adult obesity increases the risk of colon cancer 1.2-fold to 2-fold, with obesity accounting for 14%–35% of total colon cancer incidence.1 3–5 For these reasons, it is imperative to identify new methods to reduce the burden of obesity on the risk and mortality from colon cancer. Three areas of inquiry are important for understanding the aetiology of CRC: obesity, inflammation and the microbiome.
Several studies indicate that specific microbial taxa are playing a role in the aetiology of colon cancer.6–9 However, whether the microbiome is also contributing to development of obesity-associated colon cancer in humans is completely unknown. One method that has shown promise for identifying early stage colon cancer is through analysing the microbiome of the gastrointestinal tract (GI). Several studies have found colon cancer-associated microbiota in precancerous colon tissue (adenomas) and have used the microbiome to distinguish precancerous adenomas from CRC, though with variable rates of accuracy.10–12 Further, specific bacteria have been identified as promoters in colon cancer development, including enterotoxigenic Bacteroides fragilis (ETBF) and Fusobacterium nucleatum.8 9 13–15
Multiple lines of evidence demonstrate that both diet and obesity can significantly alter the microbiome.16–22 A seminal study illustrating the impact of the microbiome on obesity, transferred the faecal microbiota from monozygotic twins who were obese or lean to germ-free mice. From this study, they were able to recapitulate the obesity phenotype in humanised mice.23 When examining microbiota and subsequent changes in metabolism after faecal transfer from obese mice to germ-free mice, it was found that this obesogenic microbial community had an increased production of SCFAs, which was later shown to abrogate lipid storage.20 23 More research, however, is necessary to identify the microbiome–host relationship in individuals with obesity.24 25
Chronic inflammation is a hallmark of both obesity and CRC aetiology. Obesity is characterised by proinflammatory adipose tissue macrophages that secrete high levels of IL-17, a cytokine which is also induced by ETBF in murine models of colon cancer.9 26 27 Given the reciprocal relationship between the microbiome and the immune system, it is logical to hypothesise that obesity-associated microbial dysbiosis, combined with a state of chronic inflammation, contributes to the increased risk of colon cancer among obese individuals. In support of this hypothesis, animal models of colon cancer (Apc1638N) have demonstrated that a high fat diet or genetically (ob/ob) induced obesity can significantly alter the microbiome leading to a loss of Parabacteroides distasonis and an increase in proinflammatory factors.19 In a separate model of colon cancer (K-rasG12Dint), faecal transfer from high-fat fed mice with intestinal tumours to genetically susceptible mice on a standard diet replicated the disease phenotype.28 Thus, it appears that a high fat diet may be sufficient to change the microbiome into a tumour-promoting community independent of obesity and glucose response. As these data demonstrate, there are a variety of dysbiotic states that exist in obese individuals, which could further enhance the inflammatory state of the GI tract leading to an increased risk of CRC. No human studies to date have addressed the obesity-associated differences in the microbiome and its relationship to CRC however.
In this study, we used multiple publicly available data sets in which either stool or tissue microbiome sequencing was conducted, and from which body mass index (BMI) was also available. Using the bioinformatics tools QIIME (16S rRNA) and Pathoscope (whole genome sequencing [WGS]), we processed the 16S rRNA and WGS reads and derived a taxonomic profile from each of the samples. We used these taxa and the metabolic pathway information to determine if a taxonomic signature or if specific taxa were associated with both obesity and CRC. From this analysis, we observed that the dysbiosis associated with obesity was independent from the dysbiosis associated with CRC.
Methods
Sample population
For this study, we identify studies relevant to assess the relationship between obesity and CRC using the microbiome as the independent variable. Together, five studies were identified that assessed both BMI and the microbiome in stool or tissue from individuals with adenomas, carcinomas or individuals without disease (table 1 and online supplementary material 1). Three of these studies conducted 16S rRNA sequencing on stool or tissue and three conducted WGS on stool or tissue, with one using RNA sequencing. One study conducted both 16S rRNA and WGS on tissue and stool.
Supplemental material
Summary of demographic characteristics, sequencing methods and OTUs for included data sources
Processing of microbial reads and calculation of diversity
All sequence data were downloaded from the NCBI Sequence Read Archive. In order to eliminate differences between studies, we processed the reads using the same methods, either QIIME (V.1.9.0) plus the algorithm Resphera Insight for 16S rRNA sequencing or Pathoscope (V.1.0) for processing WGS or RNA-seq reads. For the studies sequencing the 16S rRNA gene, the V4 region was used for all stool samples as well as tissue, with the exception of the subsample of tissue from another study used as part of the Zeller et al (2014) data set. Prior to Resphera Insight and statistical analysis we rarefied the 16S rRNA sequencing data to the sample with the lowest number of reads; Zackular 25 000 per sample, Zeller 16S tissue and stool 10 000 per sample, and Baxter 10 000 per sample. Details regarding sequencing methods and variable regions amplified for each data set are listed in table 1 and online supplementary material 1.
Statistical analyses
In order to test the association between BMI and the microbiome, we grouped our statistical analyses into four subgroups: (A) normal stool samples (healthy controls), (B) CRC stool or CRC tissue and (C) pooled samples (healthy controls and CRC), all of which were adjusted for age and sex. Group C was further adjusted for disease status.
For alpha diversity measurements, we used both the observed number of Operational Taxonomic Unit (OTUs) and the Shannon Index. To determine associations with BMI, we treated it as a continuous variable (as a covariate) in the main analysis. For additional analyses, we also dichotomised the subjects into non-obese (BMI<30) and obese (BMI≥30) according the WHO guidelines.
For beta diversity measurements, we used four distance measurements unweighted UniFrac, weighted UniFrac, generalised UniFrac and Bray-Curtis for 16S datasets. For WGS/RNA-seq data, where we do not have the phylogenetic tree, we instead used two non-tree-based distance measurements Jensen-Shannon and Bray-Curtis.29 Different distance measurements represent different views of the microbial community and multiple distance measurements were used to have a more comprehensive view. In order to determine the difference in community membership between BMI categories, we used the PERMANOVA test on single distance measures, with the omnibus test on the combination of all distance metrics (PermanovaG, ‘GUniFrac’ R package).30
In order to compare taxonomic abundance between groups, we used as input OTU (16S rRNA) and species (WGS) counts. Negative binomial regression was used with BMI as a continuous variable for analysis of the microbiome while controlling for age and sex. Using multilevel modelling, the effects of confounders in study designs were examined. Details of all taxonomic analyses including random forest and mediation are found in online supplementary material 1.
Results
Database and study selection
We performed a systematic review and meta-analysis guided search of the literature. Within this search we included five studies that analysed the microbiome of the stool or tissue from patients with colon cancer and which also had clinical information from patients on BMI (table 1). Given that our central hypothesis is predicated on a difference in microbial structure and composition between obese and non-obese individuals, we focused our initial analyses on the Baxter et al study, which has adequate sample size to detect differences between these two groups.11 The remaining studies were used as comparators to support or negate any associations found between the microbiome and obesity.
Characterisation of cofounders between studies
A major issue facing microbiome studies is the lack of standardised methods for collection, storage, nucleotide extraction, sequencing methodology and bioinformatic analysis. Thus, we began our analysis by characterising the effect of 16S rRNA variable region and sequencing methods (16S rRNA or WGS) on observed OTUs and Shannon diversity for prediction of CRC. Unfortunately, we could not fully test the effect of nucleotide extraction as the Feng et al study did not provide this information. We chose to focus on alpha diversity for this analysis given that it is a low-resolution measure, which allows for comparison across studies. Using multilevel modelling to predict CRC status, we calculated the average log2 OR (logit) for each study when these level 2 predictors (variable region and sequencing method) were included in the model. The results of this analysis demonstrated that alpha diversity and obesity vary by study but do not significantly change the probability of having CRC (figure 1A,B; online supplementary figure S1). Between the studies that used different extraction techniques, Zeller (GNOME DNA Isolation Kit, MP Biomedical) vs Baxter and Zackular et al (Power Soil, Mo Bio), we did not observe an effect of extraction technique on the relationship between alpha diversity and probability of CRC (figure 1A,B). Further, the predictive ability of 16S rRNA data, alpha diversity, to classify CRC varies among studies but using WGS does not improve this predictive ability nor does variable region choice (figure 1A,B). Overall, among the potential confounders we tested, we did not observe a significant effect on the ability of alpha diversity to classify CRC cases and controls when controlling for obesity.

Variance in ability of alpha diversity to predict odds (log2) of CRC controlling for obesity and study confounders. The log2 OR of CRC using observed OTUs (left panel) or Shannon Index (right panel) as predictors. The multilevel model includes obesity (level 1) and sequencing method (16S rRNA or WGS) and variable region (V4 or V3-4) (level 2) as coefficients. CRC, colorectal cancer; WGS, whole genome sequencing.
Alpha diversity analysis
We next sought to validate previous studies showing differences in alpha diversity between obese and non-obese individuals without CRC. In order to analyse alpha diversity within each sample study population, we calculated both richness, observed OTUs and Shannon diversity. We conducted linear modelling analysis using BMI as a continuous measurement and calculated the observed OTUs and Shannon diversity controlling for age and sex. Confirming previous microbial studies of stool from healthy (non-CRC) individuals,25 we also found significantly lower Shannon diversity in individuals that are obese without CRC from two of the 16S rRNA data sets (Baxter and Zeller et al [WGS]) and lower richness in the Zeller et al (16S) data; unadjusted Mann-Whitney U tests did not show this same result comparing individuals with and without obesity (figure 2A; online supplementary figure S2A and table 2). Supporting previous meta-analyses, however, studies with N<100 subjects displayed similar trends but did not reach statistical significance. When we asked if this same trend of lower Shannon diversity was present in obese individuals with CRC, we saw no association, with the exception of the Feng et al dataset, which demonstrated a significantly higher alpha diversity with higher BMI both as continuous and categorical models, but not in the unadjusted analysis (figure 2B; online supplementary figure S2B and table 2). These results may be due to geography and diet of Asian populations. Together, these data indicate that while there is an association between community composition and obesity in those without CRC, this association is not present in those with both obesity and CRC.

Alpha diversity in individuals with or without obesity and with or without CRC. (A) Observed OTUs and Shannon diversity in individuals without CRC or (B) with CRC comparing individuals with or without obesity. Reporting p values are from Mann-Whitney U test comparing the alpha diversity of individuals with or without obesity. BMI, body mass index; CRC, colorectal cancer; WGS, whole genome sequencing.
Alpha-diversity analysis comparing obese and non-obese within cases and controls
Beta diversity analysis
We next asked whether we could detect microbial community differences in structure between obese and normal weight individuals with or without CRC. To conduct this analysis, we calculated the omnibus p value for comparison of all distance matrices.31 In all of the data sets analysed, except Vogtmann et al (WGS), Zeller et al (WGS) and Zeller et al (16S rRNA/tissue), we observed a significant difference (omnibus p<0.05) in community structure between obese and non-obese individuals without CRC (table 3; see online supplementary figure S3A). This same analysis in individuals with CRC (obese vs non-obese), however, yielded only one significant observation in the Feng et al dataset (table 3; online supplementary figure S3B), supporting the observations with community composition. Thus, similar to community composition, community structure is associated with BMI in individuals without CRC but not in those with CRC.
Beta-diversity analysis comparing obese and non-obese within cases and controls
Taxonomic diversity analysis
Again, we began our taxonomic analysis comparing individuals with and without obesity among individuals without CRC as a means of validating previous studies, using as our reference the largest study dataset.11 From this analysis, controlling for age and sex, a significantly lower relative abundance of several Ruminococcus spp. was identified in the two of the datasets (Zackular et al, Zeller et al [16S rRNA stool], Zeller et al [WGS]) as well as Coprococcus spp. (Baxter et al, Zackular et al, Zeller et al [16S rRNA stool]), Bacteroides spp. (Baxter et al, Zackular et al, Feng et al, Vogtmannn et al, Zeller et al, [WGS]), Bifidobacterium spp. (Zeller et al [WGS]) and Akkermansia muciniphila (Zackular et al, Zeller et al [WGS]) (online supplementary figure S4 and online supplementary table 1). When combining all differentially significant species, those from genus Bacteroides and Bifidobacteria appeared most often to differentiate individuals with and without obesity (online supplementary table 1). While no one genera or species was found to be differentially abundant (higher or lower) between all five datasets comparing individuals with or without obesity among individuals without CRC, the genus Bacteroides contained the greatest number of differentially abundant species in individuals with obesity in all but one dataset (online supplementary table 1).
Mediation effect of differentially abundant taxa on obesity-associated CRC classification
In order to determine if any taxa were affecting (mediating) the relationship between BMI and CRC probability, we took two approaches. The first approach was a classical mediation test, in which we constructed three tests. First, we estimated the OR of individuals with higher BMI being more likely to be classified as having CRC. Second, we estimated the same relationship between BMI and CRC status while controlling for the mediating effect of differentially abundant bacteria. Meaning, if the bacterium mediates the relationship between BMI and CRC probability, then the OR for BMI will decrease. Third, we calculated how much change in the OR occurred from the first to second model. Thus, from this change in ORs, we estimated how much of an effect including each taxa had on increasing or decreasing the probability of being classified as CRC for each one unit increase in BMI. From this analysis, we identified several taxa that increased or decreased the probability of CRC (online supplementary table 2) and the overall presence or absence of each taxa in cases and controls (online supplementary table 3). Species from the Bacteroides, Ruminococcus and Prevotella genera as well as Bifidobacterium catenulatum decreased the probability of CRC with increasing BMI, except for two species of Prevotella which increased CRC probability. The mediation effect of these taxa, however, was relatively weak; less than 1% change in OR (change in probability of CRC, OR range=−9e-05 to −0.01) (online supplementary table 2), with the majority showing a negative effect and only 8/34 showing a positive effect; none showed a significant mediation effect (online supplementary table 2).
In our second approach, we derived an overall mediation effect using the FDR adjusted p values (q values); the q values were calculated for each data set and q values for taxa <20% were considered to have a significant mediating effect (see online supplementary material 1). Using this approach, we looked for taxa that had a significant mediating effect between studies and identified two, Phascolarctobacterium succinatutens and Streptococcus salivarius; however, they were only shared between 2/6 studies each (online supplementary table 4). Overall, these results indicate the majority of bacteria associated with CRC and BMI decrease the odds of CRC in individuals with obesity, but only weakly.
In addition, to determine if previously identified CRC-associated taxa, F. nucleatum, F. prausnitzii, B. fragilis or A. muciniphila, were altered in individuals with obesity in their ability to differentiate CRC from non-CRC, we calculated the log2 ORs for each species (online supplementary figure S5). Overall, among individuals with obesity, F. nucleatum consistently showed stronger prediction (log2 OR) of CRC.
Ability of the microbiome to classify obesity-associated CRC
Given that previous studies have demonstrated the predicative capability of the microbiome in generating classifiers for CRC, we next asked whether a taxonomic consortium could accurately predict obesity-associated CRC. Using the machine learning method random forest, we calculated importance scores among obese individuals at the OTU or genus level using 10-fold cross-validation in individuals with adenomas or CRC. These values were then used to calculate area under the receiver operator curve (AUC) using age and sex as covariates or the microbiome alone. Among all obese individuals, the average of all AUC values predicting CRC cases at the OTU and genus level was 0.66 (0.47–0.84) and 0.68 (0.47–0.94), respectively (figure 3B). Similarly, among obese adenoma cases, average AUC values at the OTU and genus level were 0.61 (0.48–0.86) and 0.60 (0.52–0.73), respectively (figure 3A), demonstrating high heterogeneity among studies in predicting CRC or adenomas in obese individuals. Last, we sought to validate CRC classifiers developed by Baxter et al and Zeller et al by agnostic application of our random forest classifier on each dataset using all genera or OTUs. Overall, the microbiome by itself or controlling for BMI, age and sex had low and variable AUC values (OTU; AUC=0.53–0.79; Genus; AUC=0.59–0.81) in most studies. We were able, however, to validate the classifier from the Baxter et al and Feng et al studies; our AUC values were 0.79 (Baxter et al) and 0.81 as compared with Baxter et al (AUC=0.84) and Feng et al (AUC=0.96). Although we could not approach the classifier values from the Zeller et al study (AUC=0.84; without FOBT), this was likely due to the difference in their approach in building the classifier. In general, these data indicate that the microbiome together with clinical data, and likely FOBT or similar tests, could have diagnostic utility.
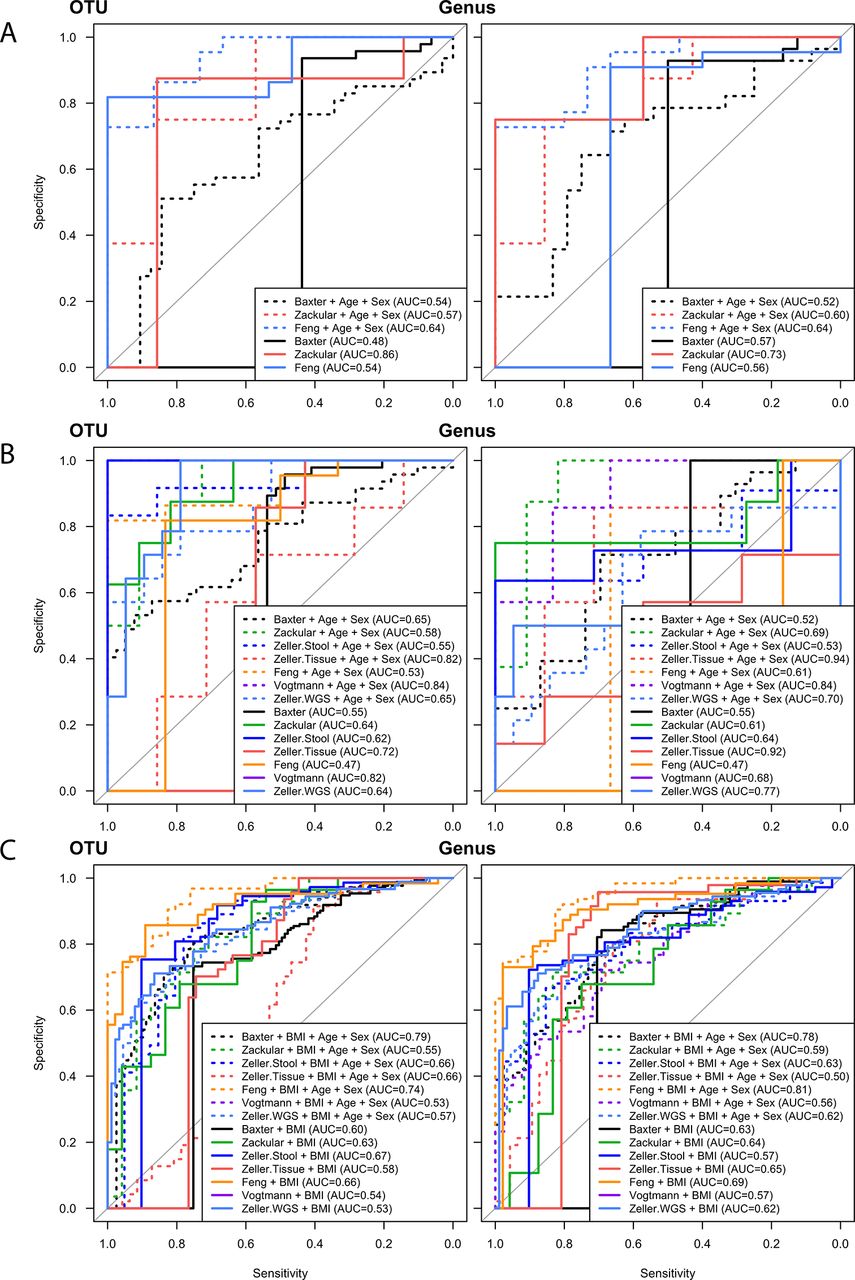
Microbial classifiers of CRC and obesity-associated CRC. (A) ROC for the random forest classification analyses for obese vs non-obese in individuals with CRC for each study. AUC is the 10-fold cross validated area under the curve. (B) ROC for the random forest classification analyses of obese vs non-obese in individuals with adenomas for each study. Due to a lack of cases with adenomas in some studies, a random forest was not possible and are therefore not shown. (C) ROC for the random forest classification analyses of CRC vs non-CRC in each dataset adjusted for BMI, age and sex. AUC, area under the receiver operating curve; BMI, body mass index; CRC, colorectal cancer; ROC, receiver operating curve; WGS, whole genome sequencing.
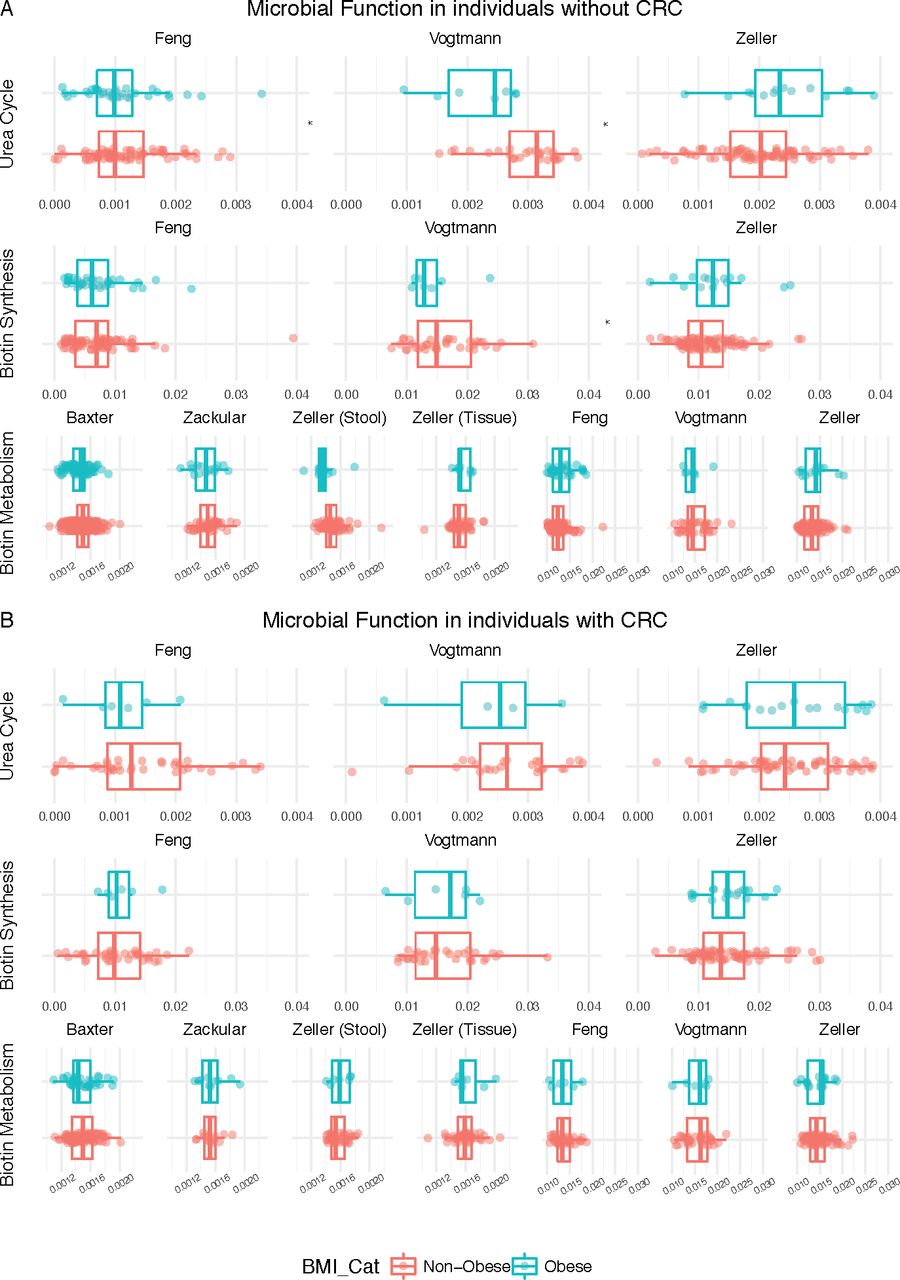
Finally, we interrogated the metabolic potential of the bacterial community using the bioinformatics tool PICRUSt in order to obtain predicted functions. However, none of these predicted functions differentiated obese individuals among all studies (figure 4A,B). Predicted functional analysis, therefore, did not further distinguish obesity-associated CRC from those with CRC and normal BMI.
Pathway abundance analysis in individuals with or without obesity among individuals with or without CRC. relative abundance of KEGG metabolic pathways (16S rRNA) or modules (WGS) inferred from PICRUSt or HUMAnN, respectively. Significance was calculated using the Wilcox test correction for multiple hypothesis testing; asterisks are representative of significance at adjusted p<0.2. CRC, colorectal cancer; WGS, whole genome sequencing.
Discussion
Evidence clearly demonstrates an intimate link between inflammation, obesity and the microbiome.32–41 In vivo, multiple studies indicate an interaction or mediating effect of the microbiome in promoting colon tumourigenesis in the presence of a high-fat diet or genetic-induced obesity.18 19 42–44 In this study, using BMI as a measure of obesity, we were able to initiate the first analysis addressing this outstanding question in human subjects.
This is the most comprehensive high-resolution study of the microbiome in individuals with and without obesity among those with CRC, using multiple sequencing platforms and methods. In this meta-analysis, we describe both obesity-associated and CRC-associated results. First, we found both community structure and composition in stool and tissue samples from individuals with CRC are independent of BMI. Second, we identified a weak effect of the majority of species associated with both BMI and CRC on risk of CRC. Last, we show the microbiome, by itself or modelled with age and sex, is insufficient to classify adenomas or CRC from obese controls. However, when controlling for clinical variables and BMI, we are able to achieve similar levels of CRC classification to other studies.45 Overall, by combining species-level resolution from 16S rRNA and WGS data, we were able to define the microbial community structure and function at a high resolution, revealing overall a weak effect of the microbiome on mediating CRC risk among individuals with obesity as compared with those with normal BMI.
While this study did not identify any strong universal BMI-associated microbial biomarkers of CRC, many mechanisms are likely key in driving the increased risk of CRC in obese individuals that we could not account for in this study. These include tumour location (left vs right), mutation profile, differentiation, mismatch repair status and diet, many of which are able to differentiate individuals with obesity among those with CRC.46–49 A high fat diet, however, may be more important than BMI or obesity in driving the deleterious changes in the microbiome in individuals with obesity. In support, feeding a high-fat diet to K-rasG12Dint mice is sufficient to drive tumourigenesis from 30% to 60%.28 Moreover, when faeces from high fat fed mice (K-rasG12Dint) are transferred to healthy (K-rasG12Dint) mice, tumour burden is increased along with diminished immune cell recruitment.28 This was prevented, however, when supplemented with butyrate, which also increased Bifidobacterium abundance as compared with mice not supplemented with butyrate.28 We also found several species of Bifidobacterium lower in individuals with obesity among those with and without CRC. Interestingly, butyrate and butyrate producing bacteria were shown to be increased in African-American men after switching to a traditional high fibre, low-fat rural African diet.50 Again, similar to the results of high-fat feeding promoting CRC, which was abrogated with butyrate treatment, the aforementioned study found that the high-fat Western diet of African-Americans was associated with higher secondary bile acids, known promoters of carcinogenesis. Together, these studies indicate that a high fat diet, specifically from saturated fats, may be interacting with the microbiome to create a proinflammatory environment conducive to colon carcinogenesis.
BMI is crude measure of obesity, and other more accurate measures (eg, waist circumference, adipokines and so on) are required to fully explore the relationship between obesity, inflammation and the microbiome in development of CRC. An exemplar of this relationship is demonstrated for lung cancer, wherein the use of BMI demonstrates that a lower risk of lung cancer is associated with higher BMI but use of waist circumference or waist to hip ratio demonstrates and increased risk of lung cancer.51 Thus, this study sets the stage for future research to consider adding measures of adiposity beyond BMI when studying the aetiology and risk of CRC as well as other cancers influenced by obesity.
Overall, our validation of microbiome-based classifiers indicates this approach, in combination with FOBT or FIT tests, is well supported for continued development. More important, while this study did not assess diet directly, other studies suggest that diet, rather than obesity, is creating a proinflammatory microbial community increasing CRC risk.28 50 Hence, characterising the role of the diet in addition to the microbiome in CRC aetiology is necessary, which will require more detailed molecular analyses and well-designed longitudinal human studies to identify dietary and early stage microbial biomarkers prior to disease.
Acknowledgments
We would like to thank the participants in each of the studies for their time dedication to supporting colon cancer research. Also, we thank all of the authors from each study for making their data publicly available for analysis and to allow for transparency and reproducibly. Our thanks to the members of the Baylor Writing Group, Joe Taube, Karen Melton, Elise King, Elyssia Gallagher, for their feedback and editing.
References
Footnotes
Contributors KLG conceived of the study, analysis plan, analysed data, interpreted results and participated in writing and review. JW downloaded and processed all sequencing data. JC, GDJ and RNP conducted statistical analyses. BGP processed data. JRW, KLG, JC, GDJ, RNP, BGP and NC provided technical and data interpretation assistance and manuscript review. All authors read and approved the final manuscript.
Funding This work was supported by the Baylor University Summer Sabbatical Grant (PI–summer salary support). NC was supported by the NCI award R01CA179243.
Competing interests JRW is a significant shareholder in the company Resphera Biosciences LLC.
Patient consent for publication Not required.
Provenance and peer review Not commissioned; externally peer reviewed.
Data sharing statement All data are publicaly availably and all processed data are available at https://github.com/GreathouseLab/CRC_BMI_meta_analysis