Article Text

Abstract
Background Differentiating between malignant and normal cells within tissue samples is vital for molecular profiling of cancer using advances in genomics and transcriptomics. Cell-surface markers of tumour–normal discrimination have additional value in terms of translatability to diagnostic and therapeutic strategies. In gastric cancer (GC), previous studies have identified individual genes or proteins that are upregulated in cancer. However, a systematic analysis of cell-surface markers and development of a composite panel involving multiple candidates to differentiate tumour from normal has not been previously reported.
Methods Whole transcriptome sequencing (WTS) of GC and matched normal samples from the Singapore Gastric Cancer Consortium (SGCC) was used as a discovery cohort to identify upregulated putative cell-surface proteins. Matched WTS data from the The Cancer Genome Atlas (TCGA) was used as a validation cohort. Promising candidates from this analysis were validated orthogonally using multispectral immunohistochemistry (mIHC) with automated quantitative analysis using the Vectra platform. mIHC was performed on a tissue microarray containing matched normal, marginal and tumour tissues. The receiver-operating characteristic (ROC) curves were analysed to identify markers with the highest diagnostic validity independently and in combination.
Results Analysis of putative membrane protein transcripts from the SGCC discovery cohort WTS data (n=15 matched tumour and normal pairs) identified several differentially and highly expressed candidates in tumour compared with normal tissues. After validation with TCGA data (n=29 matched tumour and normal pairs), the following proteins were selected for mIHC analysis: CEACAM5, CEACAM6, CLDN4, CLDN7, and EpCAM. These were compared with established glycoprotein markers in GC, namely CA19-9 and CA72-4. Individual ROC curves yielded the best performance for CEACAM5 (area under the ROC curve (AUC)=0.80), CEACAM6 (AUC=0.82), EpCAM (AUC=0.83), and CA72-4 (AUC=0.76). Combined multiplexed imaging of these four markers revealed improved specificity and sensitivity for detection of tumour from normal tissue (AUC of 4-plex=0.91).
Conclusion CEAMCAM5, CEACAM6, EpCAM, and CA72-4 form a versatile set of markers for robust discrimination of GC from adjacent normal tissue. As cell-surface markers, they are compatible with both IHC and live imaging approaches. These candidates may be exploited to improve automated identification of tumour tissue in GC.
- gastric adenocarcinoma
- gastric carcinoma
- diagnostic and therapeutic endoscopy
- tumour markers
- cancer genetics
This is an open access article distributed in accordance with the Creative Commons Attribution Non Commercial (CC BY-NC 4.0) license, which permits others to distribute, remix, adapt, build upon this work non-commercially, and license their derivative works on different terms, provided the original work is properly cited, appropriate credit is given, any changes made indicated, and the use is non-commercial. See: http://creativecommons.org/licenses/by-nc/4.0/.
Statistics from Altmetric.com
- gastric adenocarcinoma
- gastric carcinoma
- diagnostic and therapeutic endoscopy
- tumour markers
- cancer genetics
Summary box
What is already known about this subject?
Prior studies done have identified several individual genes and proteins in gastric cancer.
What are the new findings?
To complement previous studies examining individual genes upregulated in gastric cancer (GC), our work describes a pan-transcriptomic comparison of the relative performance of markers for robust differentiation of tumour and normal tissues.
How might it impact on clinical practice in the foreseeable future?
This proof-of-concept study provides a combination of GC markers to increase the diagnostic precision of tumour–normal discrimination in a variety of potential applications.
Introduction
Gastric cancer (GC) is one of the leading causes of cancer mortality globally.1 Early diagnosis and curative resection represent the best option for improved survival in this disease. Machine-learning algorithms are being developed to assist with identification, diagnosis and classification of tumour in pathology samples,2 especially in settings where access to pathological expertise is limited.
All artificial intelligence (AI) and machine-learning algorithms rely on identification of specific features on the tumour to assist with recognition and differentiation from normal tissue. These differentiating features are especially important in GC that is well-known to have significant intertumoural and intratumoural heterogeneity.3 In addition to morphological features that are ‘visible’ on endoscopy or histology, the identification of molecular features that distinguish normal from tumour will enhance the performance of machine-learning algorithms. To retain compatibility with digital pathology and live imaging, it is necessary for these molecular features to be present on the cell surface to enable their detection by labelled antibodies. A rational approach to this process is to first identify moieties on the cell surface which are differentially overexpressed on the gastric tumours relative to adjacent normal tissue. However, a comprehensive discovery of cell-surface proteins in clinical material is challenging due to technical challenges with clinical proteomic studies.4 Gene expression data on the other hand has been widely studied, and these data are readily available in public databases. Yet, few matched comparisons of cell-surface targets between tumour and adjacent normal samples for GC have been performed.
In this study, we analysed whole-transcriptomic sequencing data in two GC cohorts with matched tumour–normal pairs to identify putative cell-surface markers of tumour–normal discrimination, followed by orthogonal validation of these results using spectral microscopy. We reported the identification of a combination of cell-surface markers that robustly discriminate tumour from normal in GC. This is a proof-of-concept study for the relative comparison of cell-surface markers, which may eventually be developed further towards tools for GC diagnosis, screening and AI-based algorithms.
Methodology
Cohort selection
Singapore Gastric Cancer Consortium (SGCC) database was used as the discovery cohort (online supplementary figure S1 in online supplementary material), while The Cancer Genome Atlas (TCGA) was used as validation cohort. A list of integral components of membrane genes from Gene Ontology (GO:0016021) was referenced to analyse only putative membrane targets from matched RNA sequence data from TCGA (n=29) and SGCC (n=15). GO:0016021 comprises gene products with covalently attached moiety embedded in the membrane, with peptide sequence spanning part of, or the entire membrane.
Supplemental material
RNA transcriptomic analysis
Gene expression values were normalised to B-actin (ACTB gene) and library size. Genes from GO:0016021 membrane list were compared between tumour and normal tissues for differential expression. Fold changes in expression between tumour and normal tissues were sorted according to magnitude of overexpression. This method allowed identification of genes that were ‘differentially and highly’ expressed on the tumour surface.
Immunohistochemistry and quantitative analysis
To validate these findings at a protein level and compare these hits with published markers of GC, top transcripts from SGCC validated in TCGA were selected and immunohistochemistry (IHC)-compatible antibodies specific to these were purchased.
Tissue microarray samples comprising gastric adenocarcinoma and early gastric adenocarcinoma were immunostained with antibodies against CEACAM5, CEACAM6, EpCAM, and CA72-4 (online supplementary methods). Vectra 2 multispectral imaging was done to derive the mean cellular intensity (Vectra score) for each marker to be used as a descriptive value for each normal or tumour region, as previously described5 (online supplementary figure S2 in online supplementary material).
Supplemental material
The top four markers from the individual staining (1-plex) were elected for multiplex staining in early GC, which can be potentially used for screening purposes.
Statistical analysis
Gene expression values were extracted from TCGA and SGCC databases and analysed using R (V.3.6.1). Differential expression between normal and tumour samples was analysed using the Wilcoxon signed-rank test. A mean fold change of at least 100× between tumour and normal samples was utilised to identify transcripts of interest from the SGCC cohort. Sample numbers were limited by the availability of matched RNAseq data for tumour–normal pairs in SGCC and TCGA.
In the IHC analysis, mean staining intensity was compared between normal and tumour tissues. The sensitivity and specificity for each antibody were calculated by comparing the cohort of normal and matched tumour tissues. A receiver-operating characteristic (ROC) curve was generated for each marker using sensitivity and specificity.
Results
Our analysis focused on transcripts that code only for integral membrane proteins with at least part of their peptide sequence embedded in the hydrophobic region of the membrane based on gene ontology. Importantly, as these analyses were performed on RNAseq data, we designed a method to identify candidate membrane transcripts that showed (a) high expression in cancer relative to matched normal tissue and (b) high overall levels of expression. This allowed us to focus only on those proteins that had high probability of being easily detected preferentially in cancer tissue. Analysis of SGCC matched RNA sequencing cohort for transcripts encoding membrane proteins that were differentially expressed between normal and matched tumour tissues and also showed high levels of expression in tumours revealed several important genes: EpCAM, CEACAM5, CEACAM6, CLDN7, and CLDN4 (figure 1A). Remarkably, a similar analysis performed on the TCGA database using this methodology yielded comparable results with a high overlap of candidate genes fulfilling these criteria (figure 1B).

Transcriptome analysis: integral genes of the plasma membrane (GO:0005887) were chosen for further analysis using RNA-sequence data of matched tumour and normal tissues from public data sets of TCGA (n=29) and SGCC (n=15). Top hits (red) of both (A) SGCC and (B) TCGA data were chosen for further immunohistochemistry analysis. TCGA, The Cancer Genome Atlas; SGCC, Singapore Gastric Cancer Consortium.
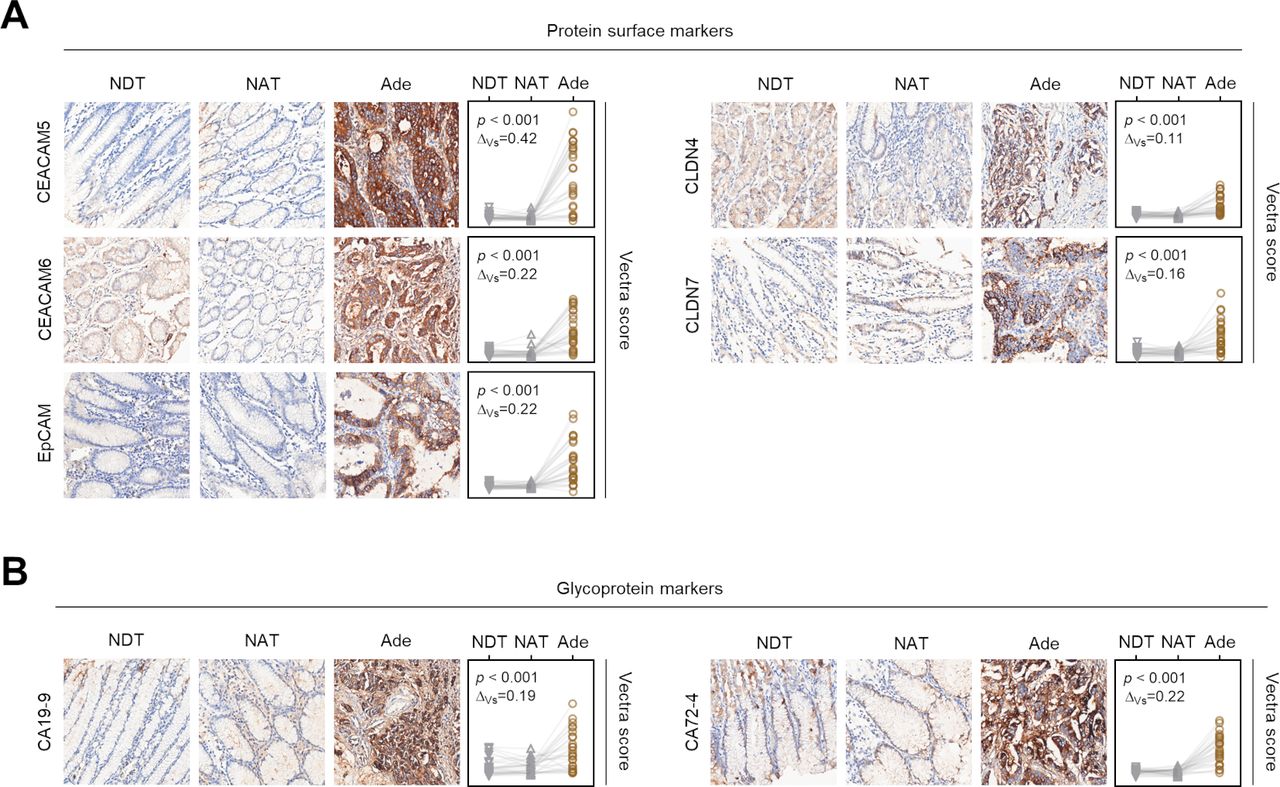
The genes with the highest median fold change expression between matched GC and normal tissues which proved statistically significant (p<0.05) across both TCGA and SGCC data sets (figure 1) were chosen for further IHC analysis. To validate transcriptomic findings at the protein level and compare them with known markers of GC, we performed quantitative IHC for the following genes: CEACAM5 (alias CEA), CEACAM6, CLDN4, CLDN7, and EpCAM. As a comparator, we included two known glycoprotein antigens CA72-4 and CA19-9, which are published biomarkers of GC.6 Using quantitative assessment of antibody staining in these histological samples, the overexpression of CEA, CEACAM6, CLDN4, CLDN7, EpCAM, CEA72-4, and CA19-9 in GC compared with normal tissue was confirmed (figure 2).

Immunohistochemistry. (A) IHC staining of a TMA containing 29 cases of gastric cancer Ade tissue along with NAT and NDT. Images were quantified using the Vectra system. Staining intensity of CEACAM5, CEACAM6, CLDN4, CLDN7, and EpCAM were higher in tumour samples compared with NDT and NAT regions. (B) The same samples were also evaluated for established glycoprotein cell-surface markers by IHC. The quantitative Vectra score range is from 0 to 1.1, and all evaluations are scaled equally. ΔVs denotes the difference between mean Vectra score of NAT and Ade. Paired t-test. Ade, adenocarcinoma; IHC, immunohistochemistry; NAT, normal adjacent tissue; NDT, normal distant tissue; TMA, tissue microarray.
After performing immunohistochemical staining of our panel of seven markers, we imaged these on the Vectra multispectral microscopy platform to derive the mean cellular intensity (Vectra score) for each marker in the given tissue. The difference in the Vectra score between normal and cancer tissues (ΔVs; see figure 2) was used to rank the markers for their tumour–normal discriminatory ability.
The top four antibodies were selected for multiplex analysis, where all the markers were stained concurrently. The top markers in terms of their individual ΔVs were CEA, CEACAM6, EpCAM, and CA72-4 (all above 0.2). As an important clinical scenario of interest is in early diagnosis of GC, we studied the relationship between these markers by multiplex imaging specifically in early GC samples with matched adjacent normal tissue.
For each of the individual markers, we calculated the staining intensity and compared between normal and tumour tissues both for T1 and T2 malignancies. Following this, the sensitivity and specificity were calculated, and ROC curves were generated as seen in figure 3. The area under the ROC curve (AUC) for each individual marker in the ROC analysis ranged from 0.67 to 0.84 in T1 and 0.71 to 0.86 in T2, while the combined AUC was 0.81 in T1 and 0.85 in T2. We also calculated AUC based on combinations of 1-plex, 2-plex, 3-plex, and 4-plex. Combined multiplexed imaging of these four markers revealed improved specificity and sensitivity for detection of tumour from normal tissue (ROC AUC of 4-plex=0.91), compared with ROC curves for individual single markers, namely CEACAM5 (AUC=0.80), CEACAM6 (AUC=0.82), EpCAM (AUC=0.83), and CA72-4 (AUC=0.76). However, several of the 2-plex combinations yielded comparable AUC values to the 4-plex (figure 3B).

ROC analyses. (A) ROC curves for individual single markers (left) and means of multiplexed combinations (right). (B) AUC and discriminating power of Ade from NAT samples for all marker combinations (n=29). Discriminating power is defined as at least 1.5-fold increase of Ade Vectra score compared with matched NAT Vectra score. Ade, adenocarcinoma; AUC, area under the ROC curve; NAT, normal adjacent tissue; ROC, receiver-operating characteristic.
Discussion
Cell-surface markers of cancer are an important source of diagnostic and therapeutic targets. While ad-hoc research investigating individual surface markers in GC has uncovered candidates of interest, to date there are no composite comparative studies specifically focusing on this topic. The goal of this study was to identify and rank cell-surface targets in GC in terms of tumour–normal discrimination. Using transcriptomic analysis of matched tumour and normal samples of two independent cohorts followed by proteomic validation using spectral microscopy, we identified potential surface markers in GC which have high tumour–normal discriminatory value. The top candidates we describe have all been previously demonstrated to be high in GC,7 but this is the first study to demonstrate their relative value in comparison with other putative markers.8–10 The bioinformatic techniques employed in our study have conceptual similarities to biomarker discovery approaches in industry, but specifically focusing on matched tumour–normal samples. This methodology may be further extrapolated beyond GC and employed in similar studies of other tumour types.
Identifying a panel of cell-surface markers with high tumour–normal discrimination can have several potential applications. In our study, the transcriptomic findings from the SGCC and TCGA cohorts were validated at the protein level in the setting of digital pathology using quantitative IHC and spectral microscopy to visualise multiple targets on a single section. However, as cell-surface targets, these retain future compatibility with live imaging experiments in vivo and could be utilised to improve endoscopic diagnosis. While Japan and South Korea have national endoscopy screening programmes to allow early diagnosis of GC,11 12 accurate identification of tumours on endoscopy is subjective and operator-dependent. As with many other branches of medicine, AI is being evaluated to ameliorate diagnostic uncertainty in endoscopy13; a panel of markers with high tumour–normal discriminatory capability may in the future help refine AI-based identification of abnormal tissue to guide the site of biopsy.
The composite panel of putative genes identified in this study also has applications in the fields of spatial transcriptomics and single-cell transcriptomic sequencing or scRNA-Seq. Novel methods such as the NanoString GeoMx assay allow for digital spatial profiling of multiple RNA and protein targets from a single formalin-fixed, paraffin-embedded (FFPE) slide.14 Incorporating our panel of genes into the GeoMx assay for studies involving GC will allow for improved tumour/normal differential analysis. Similarly, bioinformatic pipelines involved in analysis of scRNA-Seq may incorporate this composite panel of genes while performing clustering and dimensionality reduction to identify specific tumour and normal cellular populations.15 One major area of research interest in this field involves composite transcript expression mapping to achieve tumour versus normal discernment.
This study does have several limitations. Starting with RNAseq information excludes post-translational modifications that may be highly enriched in cancer samples. Examples are cell-surface glycoprotein moieties like CA19-9 that were identified through unbiased antibody-screening approaches. Advances in proteomic methodologies will extend our findings in the future to yield a comprehensive portfolio of proteins and post-translationally modified versions that can help discriminate normal from cancer tissue in the stomach. Furthermore, antibodies that work in IHC need to be further validated for safety and efficacy in the in-vivo setting. Nonetheless, our identification of antibodies to CEACAM6, EpCAM, CEA, and CA72-4 as a set of reagents to provide a high level of discrimination between cancer and normal tissues is an important step. It provides a framework to build on for further validation in larger data sets of GC. The tissue that is adjacent to cancer in a stomach is also unlikely to be truly ‘normal’ and likely to contain a mild degree of inflammation/metaplastic change. However, the ability to discriminate frank cancer from even these states will be valuable for the scRNAseq and AI-based imaging approaches mentioned earlier. Our case selection was specifically limited by samples in SGCC with matched tumour and normal data, which largely comprised poorly and moderately differentiated tumours. Thus further research will be required to confirm the relevance of these findings in well-differentiated tumours. A key clinical challenge is the identification of reliable gastric markers specifically for early GC, where the molecular changes may not be as pronounced as in advanced GC. As each individual marker may not have an adequately high sensitivity and specificity in this setting, we hypothesised that the simultaneous use of multiple markers will potentially improve this. Importantly, we were able to demonstrate that the simultaneous use of multiple IHC markers improved both sensitivity and specificity for identification of tumour versus early GC. The use of such a set of genes with tumour–normal discrimination may help increase the diagnostic precision in multiple downstream applications.16
Footnotes
JT, MMH and TT contributed equally.
Contributors The following people contributed in large to the work: JT and MMH: data collection, data analysis and interpretation, drafting manuscript, critical revision of manuscript, final approval of version to be published. TT: data collection, data analysis and interpretation, drafting manuscript, final approval of version to be published. HY, KTT, BP, SH, and RR: data collection, data analysis and interpretation, final approval of version to be published. KYH, KGY, and PT: data collection, final approval of version to be published. RS: design of work, data collection, data analysis and interpretation, drafting manuscript, critical revision of manuscript, final approval of version to be published. AJ: conception and design of work, data collection, data analysis and interpretation, drafting manuscript, critical revision of manuscript, final approval of version to be published.
Funding RS is supported by the National Medical Research Council (NMRC), Singapore (NMRC/Fellowship/0059/2018). AJ is a recipient of the Singapore Ministry of Health’s National Medical Research Council Transition Award (NMRC/TA/0052/2016), and an NMRC clinician–scientist new investigator grant (CS-NIG). This research is supported by Singapore Ministry of Health’s National Medical Research Council under its Translational Clinical Research (TCR) grant to the Singapore Gastric Cancer Consortium (PIs; YKG/PT). AJ’s laboratory is also funded through the National Research Foundation Singapore and the Singapore Ministry of Education under its Research Centres of Excellence initiative.
Competing interests AJ: honoraria from AstraZeneca, Janssen and MSD, travel funding from Perkin Elmer, and research funding from Janssen. RS: Advisory board: BMS, Merck, Eisai, Bayer, Taiho; honoraria for talks: MSD, Eli Lilly, BMS, Roche, Taiho; Travel funding: Roche, Astra Zeneca, Taiho, Eisai; Research funding: Paxman Coolers, MSD.
Patient consent for publication Not required.
Ethics approval The study has been approved by the National Healthcare Group Domain-Specific Ethics Review Board (Institutional Review Board Number: 2019/2617).
Provenance and peer review Not commissioned; externally peer reviewed.
Data availability statement Data are available upon reasonable request. Email corresponding author: Dr Raghav Sundar (ORCID 0000-0001-9423-1368).