Article Text

Abstract
Background Patients with decompensated hepatitis C virus (HCV) cirrhosis experience various outcomes after sustained virological response (SVR), ranging from clinical recovery to further deterioration. We hypothesised that the genetic risk for steatosis, namely the polymorphisms rs738409 of Patatin-like Phospholipase Domain-Containing 3 (PNPLA3), rs58542926 of Transmembrane-6-Superfamily-2 (TM6SF2), and rs641738 of Membrane-bound O-acyltransferase Domain-Containing 7 (MBOAT7), is predictive of recovery.
Methods We prospectively enrolled 56 patients with Child-Pugh (CPT) B/C cirrhosis who underwent antiviral therapy. The primary outcome was change in CPT score at 12, 24, and 48 weeks after SVR. We used a linear mixed-effects model for analysis.
Results Forty-five patients (PNPLA3: 21 CC, 19 CG, 5 GG) survived to the first endpoint without liver transplantation. The mean change in CPT score at 12, 24, and 48 weeks was −1.57 (SE=0.30), –1.76 (SE=0.32), and −2.0 (SE=0.36), respectively, among the patients with the PNPLA3 CC genotype and −0.50 (SE=0.20), –0.41 (SE=0.25), and −0.24 (SE=0.27), respectively, among the other 24 patients. After adjustment for baseline characteristics, the PNPLA3 CG/GG genotypes were associated with a 1.29 (SE=0.30, p<0.0001) point higher CPT score. Most of the difference came from differences in hepatic encephalopathy and bilirubin. The results for rs58542926 and rs641738 were not significant.
Conclusion The PNPLA3 CG/GG genotypes could identify a subgroup of patients with decompensated HCV cirrhosis that had suboptimal clinical recovery despite SVR. An understanding of the genetic factors that influence clinical outcomes will help target patients for liver transplant based on individual genetic risk factors and provide insight leading to new therapeutic approaches.
- decompensated cirrhosis
- hepatitis C
- PNPLA3
- recovery
This is an open access article distributed in accordance with the Creative Commons Attribution Non Commercial (CC BY-NC 4.0) license, which permits others to distribute, remix, adapt, build upon this work non-commercially, and license their derivative works on different terms, provided the original work is properly cited, appropriate credit is given, any changes made indicated, and the use is non-commercial. See: http://creativecommons.org/licenses/by-nc/4.0/.
Statistics from Altmetric.com
Summary box
What is already known about this subject?
Patients with decompensated cirrhosis experience a variety of outcomes after sustained virological response (SVR), and the factors responsible for this variability in clinical recovery are currently unknown.
Recently, the BE3A score, which is a sum of five factors, was identified to be associated with clinical recovery from decompensated cirrhosis after direct-acting antiviral agent treatment. This score does not perform well in our patient cohort with Child-Pugh (CPT) class B/C cirrhosis in a liver transplant centre setting because 100% of our patients are classified as high risk.
What are the new findings?
The rs738409 single nucleotide polymorphism of PNPLA3 identified a subgroup of patients with decompensated hepatitis C virus cirrhosis that had suboptimal clinical recovery despite achieving SVR.
Compared with the patients with the PNPLA3 CC genotype, those with the PNPLA3 CG/GG genotypes had slower biochemical recovery (ie, higher Model for End-Stage Liver Disease score mainly from total bilirubin) and slower clinical recovery (ie, higher CPT score from hepatic encephalopathy and total bilirubin).
How might it impact on clinical practice in the foreseeable future?
An understanding of the genetic factors that influence clinical outcomes will help target patients for liver transplant based on individual genetic risk factors and provide insight leading to new therapeutic approaches.
Introduction
The current generation of direct-acting antiviral agents (DAA) provides a virologic cure for most patients with hepatitis C virus (HCV) cirrhosis. Patients with precirrhotic disease and those with compensated cirrhosis generally do well after achieving sustained virological response (SVR).1–3 Approximately one-quarter of patients with cirrhosis no longer have liver stiffness in the cirrhotic range within 1 year of SVR.4 Greater liver stiffness and higher alanine aminotransferase (ALT) level at baseline correlate with improvement, but more specific factors for recovery have yet to be discovered. Patients with compensated cirrhosis continue to have a hepatocellular carcinoma (HCC) incidence of 1.14 per 100 person-years (py5) and a small risk of liver failure. Advanced age and lower albumin level and platelet count are risk factors for post-SVR complications.6 For patients with decompensated cirrhosis, the introduction of interferon-free DAA regimens has led to a 32% reduction in the rate of referral to liver transplant waiting lists.7 Overall, the treatment of decompensated patients before liver transplant has been shown to be cost-effective.8 Individually, patients with decompensated cirrhosis experience a variety of outcomes,9 10 and the prognostic factors for clinical recovery from decompensated cirrhosis after SVR remain unknown.
Our a priori hypothesis is that genetic variability in genes related to steatosis accounts for the heterogeneous clinical recovery of patients with HCV cirrhosis after DAA treatment. We tested our hypothesis by examining rs738409 of PNPLA3, rs58542926 of TM6SF2, and rs641738 of MBOAT7 in a prospective, real-world cohort of patients with decompensated HCV cirrhosis who were treated with an interferon-free DAA regimen and had an undetectable viral load 12 weeks after the end of DAA therapy (SVR12). We used changes in Child-Pugh (CPT) score and Model for End-Stage Liver Disease (MELD) score to measure clinical recovery.
The rationale for our initial focus on steatosis was that chronic HCV infection is associated with steatosis, which promotes fibrosis progression.11 12 The genetic determinant of hepatic steatosis (ie, the rs738409 single nucleotide polymorphism (SNP) of the Patatin-Like Phospholipase Domain-Containing 3 (PNPLA3) gene) has also been associated with cirrhosis and fibrosis progression in HCV infection.13 We postulate that factors associated with fibrosis progression during the active disease are inversely associated with clinical recovery and fibrosis regression after the resolution of the active disease. Other SNPs linked to hepatic steatosis, including rs58542926 of Transmembrane-6-Superfamily-2 (TM6SF2) and rs641738 of Membrane-bound O-acyltransferase Domain-Containing 7 (MBOAT7), have been mainly studied in the setting of non-alcoholic steatohepatitis.
Methods
Study population
We enrolled patients with CPT class B or C cirrhosis due to HCV infection who received interferon-free DAA therapy at the University of Kansas Medical Center (KUMC). The patients received standard of care while consented to the collection of genetic material and longitudinal follow-up based on electronic medical records.
Our exclusion criteria were: alcohol consumption ≥12 drinks per week within the last 6 months, HIV or hepatitis B virus coinfection, other causes of cirrhosis, history of HCC prior to starting DAA, liver transplantation prior to 12 weeks after SVR12, and failure to achieve SVR with DAA treatment.
DNA repository and genotypes
We collected DNA from each patient using a cheek swab and determined the genotype of rs738409, rs58542926, and rs641738 using a TaqMan probe (Applied Biosystems, Carlsbad, CA). We used a C1000 Thermal Cycler (Bio-Rad, Hercules, CA) for real-time PCR.
Outcomes
The primary outcomes were changes in CPT and MELD scores 12, 24, and 48 weeks after SVR12, relative to the baseline scores prior to DAA treatment. The variance of actual CPT and MELD scores is wider than that of the changes, as it encompasses the variance of the baseline as well as that of the change. Therefore, we used the change in CPT and MELD scores, rather than the actual scores, for statistical comparison. We used the last encounter before treatment and the first encounter after 12, 24, and 48 weeks after SVR12 to calculate the changes in CPT and MELD scores for the respective time points.
We assigned the subjective components of the CPT score as follows. Patients receiving medical treatment for portosystemic encephalopathy (PSE) not requiring hospitalisation within the previous 12 weeks were assigned 2 points. Patients with refractory PSE requiring hospitalisation within the previous 12 weeks were assigned 3 points. Patients taking lactulose or polyethylene glycol for constipation who had never had a diagnosis of PSE were assigned 1 point for PSE. Patients receiving diuretics specifically for ascites (documented by imaging or clinical examination) were assigned 2 points. Patients taking diuretics for oedema who had never had a diagnosis of ascites were assigned 1 point for ascites. Patients with refractory ascites requiring paracentesis within the previous 12 weeks were assigned 3 points. The clinicians assessing PSE and ascites were blinded to the patients’ genotypes.
CT scan liver and spleen attenuation
A subset of patients had a non-contrast CT scan of the chest or abdomen that included both liver and spleen before DAA treatment so that the liver minus spleen attenuation (CTL−S) could be calculated to estimate hepatic steatosis.
Statistical analysis
We used a linear mixed-effects model to account for testing among three time points. We adjusted the models for confounders including baseline CPT and MELD scores, age, gender, body mass index (BMI), history of diabetes, previous heavy alcohol use, HCV genotype 3, treatment with a protease inhibitor regimen, treatment with ribavirin, and treatment duration. We tested for interaction between the genotypes and baseline CPT and MELD scores, age, gender, BMI, history of diabetes, previous heavy alcohol use, and study time points. PNPLA3 G-risk alleles have mostly been associated with inferior outcomes in patients with fatty liver disease. To determine if the unfavourable outcome is confounded by metabolic risk factors, we will calculate the change in CPT and MELD with and without adjustment for BMI, history of diabetes, and previous heavy alcohol use. We used the Bonferroni correction with a significance level of 0.0083 to test three genotypes with two primary outcomes (CPT and MELD). We compared the patients with the PNPLA3 CC genotype with the combined group of patients with either the CG or the GG genotype. For TM6SF2, we compared the patients with the CC genotype with those with the CT genotype, as none had the TT genotype. For MBOAT7, we used an additive genetic model because of the relatively similar prevalence of the C and T alleles. In addition to the primary analysis, we used mixed models to analyse the changes in CPT score subcomponents and t-tests to compare changes from baseline CPT and MELD scores between genotype groups at each time point. We also compared our genetic model to the recently developed BE3A score14 (based on five baseline factors: the absence of ascites or encephalopathy, serum level of albumin ≥3.5 g/dL or ALT ≥60 U/L, and BMI <25 kg/m2).
Results
We enrolled 56 patients with CPT class B or C cirrhosis who were treated with an interferon-free DAA regimen. Of those, five had a relapse (PNPLA3: 2 CC, 3 CG). Before our first endpoint (12 weeks after SVR12), two patients had liver transplantation (PNPLA3: 1 CC, 1 CG), and four patients died (PNPLA3: 4 CG).
The remaining 45 patients (PNPLA3: 21 CC, 19 CG, 5 GG) survived to the first endpoint without liver transplantation. The minor allele frequency is 32% consistent with samples enriched with patients with cirrhosis.15 The demographic and baseline clinical characteristics of the 45 patients are outlined in table 1. The patients with the PNPLA3 CC genotype had slightly higher age and BMI than the other patients, but no baseline differences were statistically significant. The average baseline MELD and CPT scores were 13 and 8.8, respectively, for the patients with the PNPLA3 CC genotype and 12 and 8.4, respectively, for those with the PNPLA3 CG/GG genotypes.
Demographic characteristics of the patients at baseline
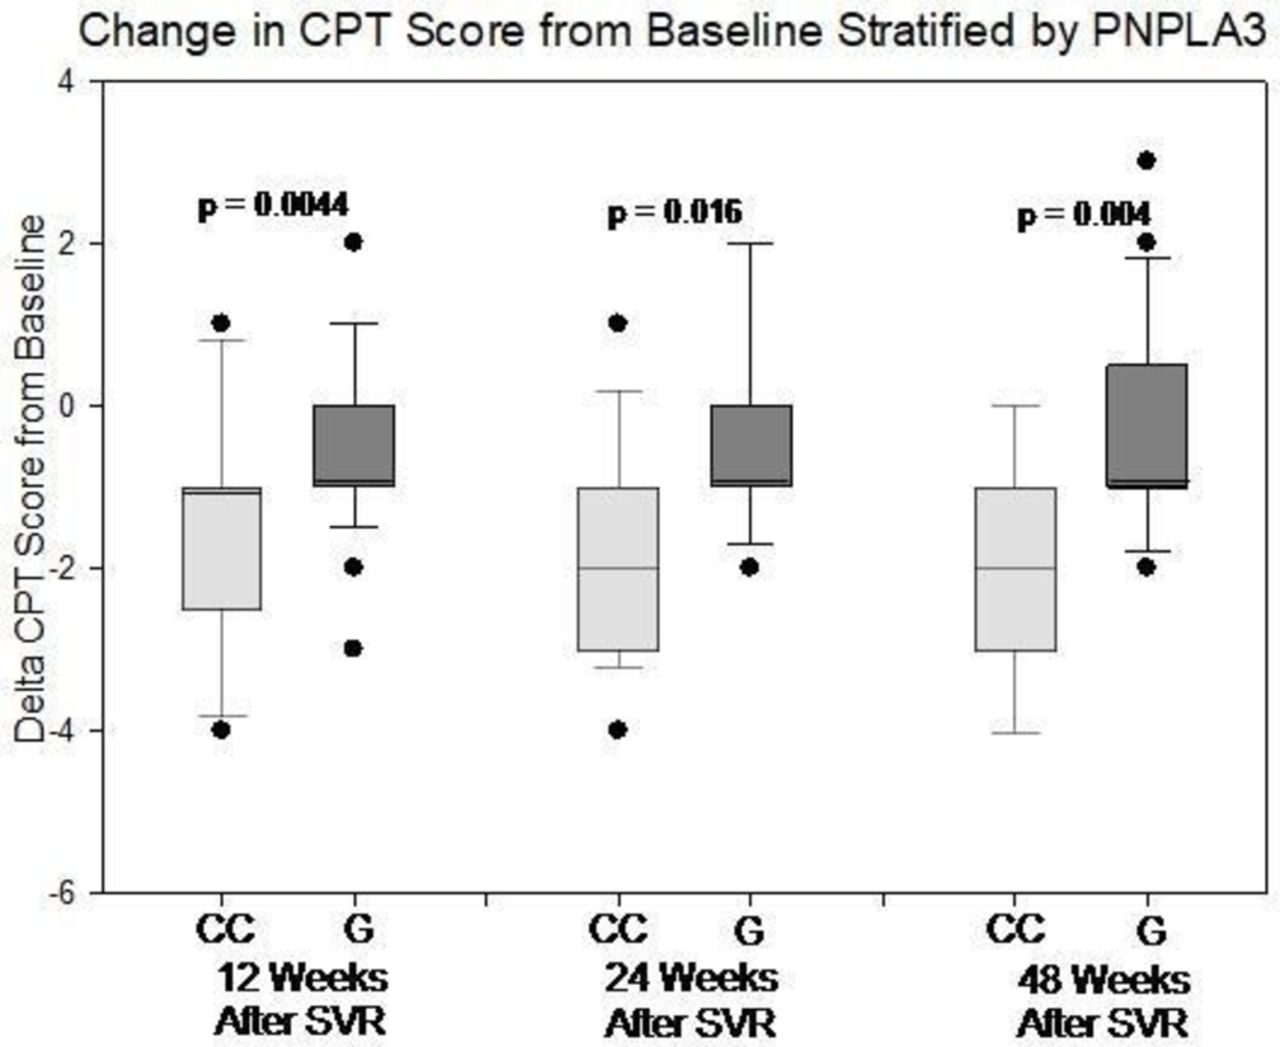
Among the 21 patients with the PNPLA3 CC genotype who achieved SVR12, the mean change in CPT score was −1.57 (SE=0.30), −1.76 (SE=0.32), and −2.0 (SE=0.36) at 12, 24, and 48 weeks after SVR12, respectively. Among the 24 patients with the PNPLA3 CG/GG genotypes, the mean change in CPT score was −0.50 (SE=0.20), –0.41 (SE=0.25), and −0.24 (SE=0.27) at the same time points, respectively. Figure 1 shows the distribution of the changes in CPT score from baseline at the three endpoints. There was a significant difference in the change in CPT score between the PNPLA3 CC genotype and the other two genotypes at all three endpoints (p=0.0044, 0.0016, and 0.0004, respectively). The mixed-effects model showed no evidence of PNPLA3 interaction with age, gender, BMI, diabetes, or previous heavy alcohol use. The effect of the PNPLA3 genotype was consistent over time (ie, the time interaction term was not significant). After adjustment for baseline characteristics, the patients with the PNPLA3 CC genotype had more overall CPT improvement on average than those with the other two genotypes (1.29, 95% CI 0.69 to 1.90, p<0.0001). With and without adjustment for BMI, history of diabetes, and previous heavy alcohol use, the magnitude of CPT score improvement was comparable (1.29 vs 1.25), suggesting that these risk factors are not important confounders. After adjustment for BE3A score only, the PNPLA3 CC genotype was associated with 1.13 (95% CI 0.50 to 1.76) points more CPT improvement, while each point of BE3A score14 was associated with 0.22 (95% CI −0.11 to 0.57) point CPT improvement.

Change in Child-Pugh (CPT) score from baseline at 12, 24, and 48 weeks after SVR12, stratified by PNPLA3 genotypes. The box represents 25th and 75th percentiles while the whisker represents 10th and 90th percentiles. The p value is value based on t-test comparing CC genotype and those with the other genotypes at each time point. SVR, sustained virological response.
Secondary analysis of each of the subcomponents of the CPT score with a mixed-effects model and adjustment for the same confounders showed that only the bilirubin subscore (0.66, SE=0.15, p=0.0001) and the PSE subscore (0.40, SE=0.11, p=0.0013) were lower in the patients with the PNPLA3 CC genotype. Table 2A–D shows the pretreatment and post-treatment evolution of the bilirubin and PSE subscores.
Baseline and post-treatment evolution of the CPT bilirubin subscore in patients with the PNPLA3 CC genotype
The mean change in MELD score among the patients with the PNPLA3 CC genotype was −1.87 (SE=−0.43), –1.85 (SE=0.46), and −1.34 (SE=0.63) at 12, 24, and 48 weeks after SVR12, respectively. For the patients with the PNPLA3 CG/GG genotypes, the mean change in MELD score was −0.73 (SE=0.71), 0.79 (SE=0.86), and 0.20 (SE=0.63) at the same time points, respectively. Figure 2 shows the distribution of the changes in MELD score from baseline at the three time points. The change in MELD score was significantly different between the patients with the PNPLA3 CC genotype and those with the PNPLA3 CG/GG genotypes at 12 and 24 weeks (p=0.0041 and p=0.013, respectively) but not at 48 weeks (p=0.099). The mixed-effects model showed no evidence of PNPLA3 interaction with age, gender, BMI, diabetes, or previous heavy alcohol use. The effect of the PNPLA3 genotype was consistent over time (ie, the time interaction term was not significant). After adjustment for baseline characteristics, the patients with the PNPLA3 CC genotype had more MELD score improvement on average than those with the other genotypes (1.92, 95% CI 0.74 to 3.11, p<0.0020). With and without adjustment for BMI, history of diabetes, and previous heavy alcohol use, the magnitude of MELD score improvement was comparable (1.92 vs 1.79), suggesting that these risk factors are not important confounders. After adjustment for BE3A score only, the PNPLA3 CC genotype was associated with 2.39 (95% CI 1.12 to 3.66) points more MELD improvement, while each point of BE3A score14 was associated with 0.22 (95% CI −0.46 to 0.89) point of MELD improvement.
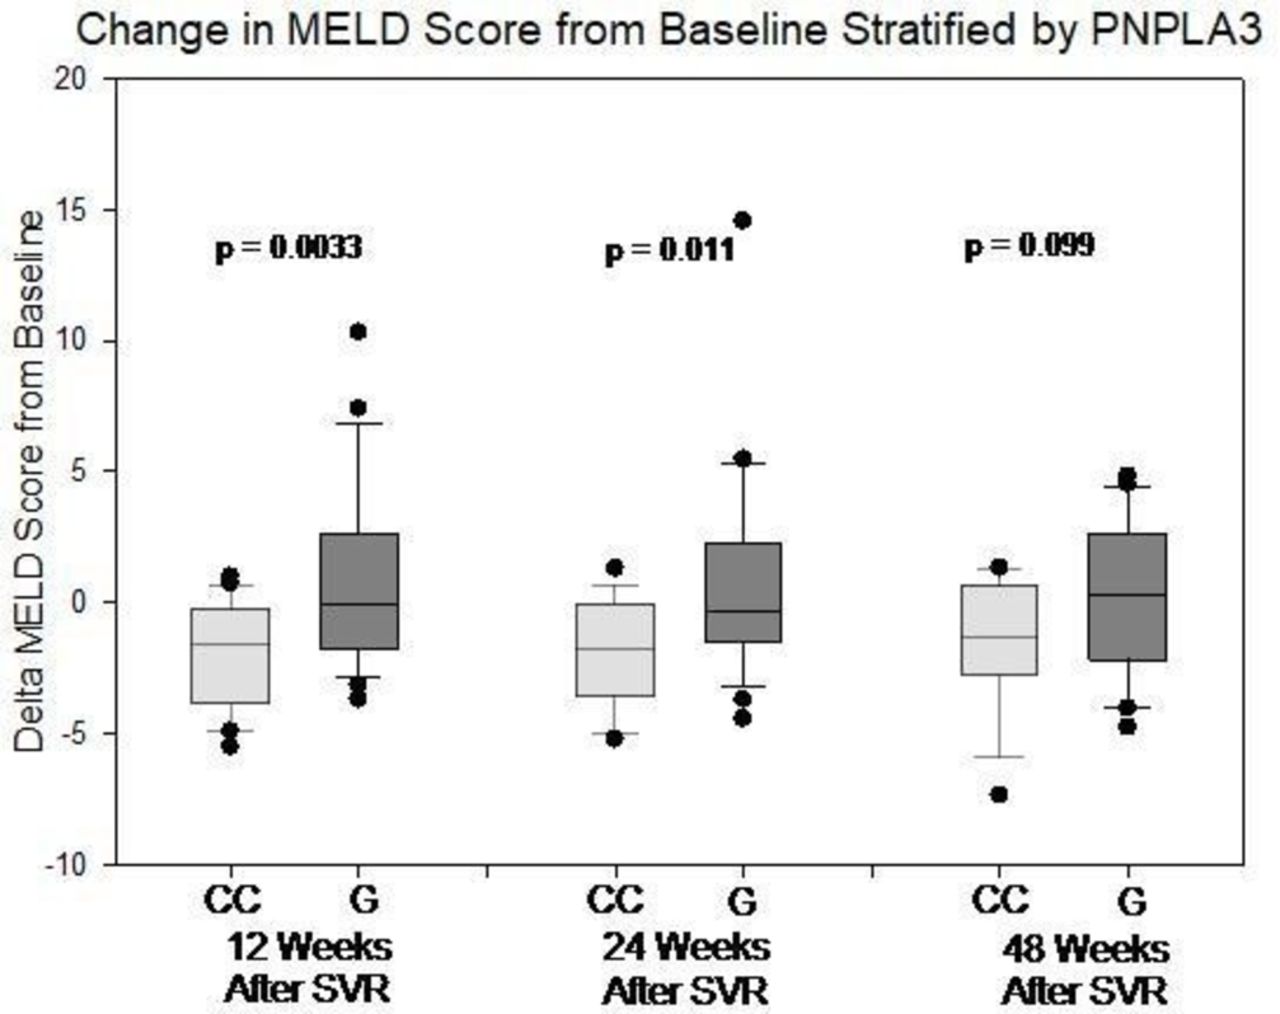
Change in Model for End-Stage Liver Disease (MELD) score from baseline at 12, 24, and 48 weeks after SVR12, stratified by PNPLA3 genotypes. The box represents 25th and 75th percentiles while the whisker represents 10th and 90th percentiles. The p value is value based on t-test comparing CC genotype and those with the other genotypes at each time point. SVR, sustained virological response.
We do not have evidence that patients of PNPLA3 genotypes recover from portal hypertension differently. The mean change in platelet count score among the patients with the PNPLA3 CC genotype was 5.1 (SE=7.2), 6.8 (SE=7.8), and 6.6 (SE=9.4) at 12, 24, and 48 weeks after SVR12, respectively. For the patients with the PNPLA3 CG/GG genotypes, the mean change in MELD score was 7.5 (SE=6.7), 8.6 (SE=8.9), and 7.0 (SE=6.4) at the same time points, respectively (t-test 0.81, 0.89, and 0.97, respectively).
Some data were censored or missing at 24 and 48 weeks. Of the patients with the PNPLA3 CC genotype, two died prior to week 24, one was lost to follow-up before week 48, and one was taking warfarin at week 48. Of the patients with the PNPLA3 CG/GG genotypes, one had liver transplantation before week 48, one was lost to follow-up before week 24, and one was taking warfarin at 24 and 48 weeks. One patient in each group was not eligible for the 48-week follow-up at the time of our analysis.
The TM6SF2 (online supplementary figures 1S and 2S) and MBOAT7 (online supplementary figures 3S and 4S) genotypes had little effect on the changes in CPT and MELD scores. Based on the allelic frequency in our sample, for TM6SF2, the power of detecting a difference in CPT and MELD score of 1 is 46% and 10%. For MBOAT7, the power of detecting a difference in CPT and MELD score of 1 is 88% and 18%.
In the subset of patients (n=22) for which CTL-S was available for measurement before DAA treatment, CTL-S did not correlate with the changes in CPT or MELDscores. Additionally, we found that CTL-S was correlated with PNPLA3, TM6SF2, and MBOAT7 genotypes, BMI, and diabetes status.
Discussion
The rs738409 SNP of PNPLA3 identified a subgroup of patients with decompensated HCV cirrhosis who had suboptimal clinical recovery despite achieving SVR. Our study focused on patients who achieved SVR and excluded those who failed to achieve SVR, died, or required liver transplantation before 12 weeks after SVR12. Compared with the patients with the PNPLA3 CC genotype, those with the PNPLA3 CG/GG genotypes had slower biochemical recovery (ie, higher MELD score) and slower clinical recovery (ie, higher CPT score). Improvements in hepatic encephalopathy and bilirubin appeared to be impaired in patients with the PNPLA3 CG/GG genotypes compared with those in patients with the PNPLA3 CC genotype.
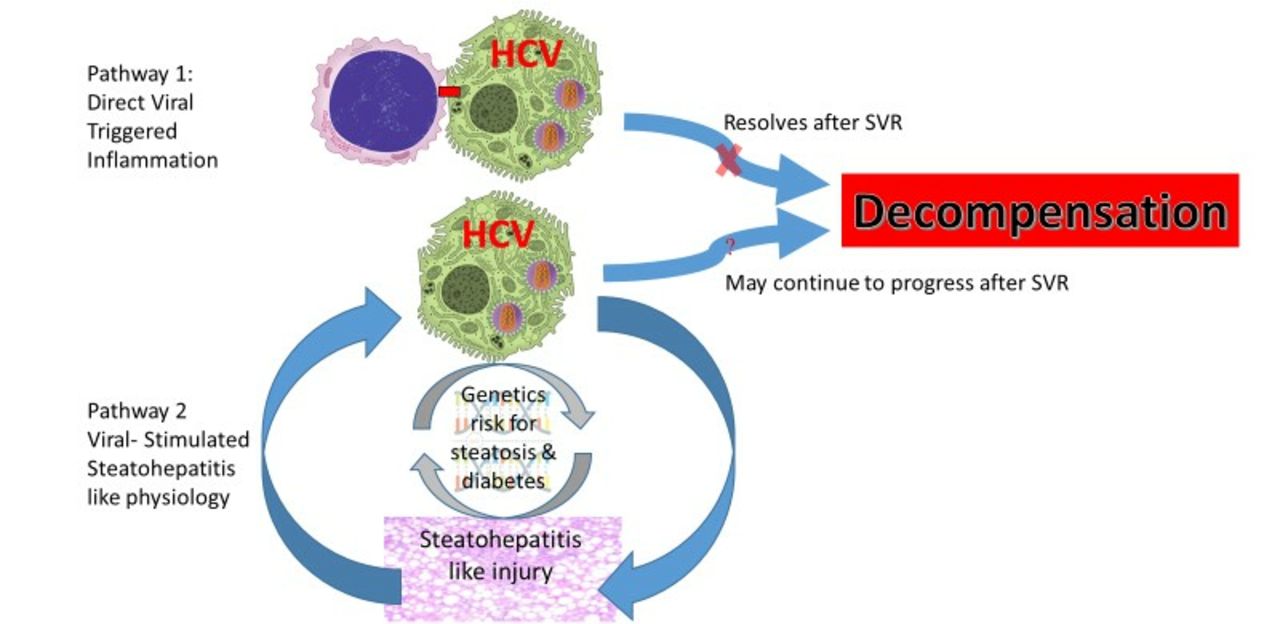
The rationale for our initial focus on steatosis was that chronic HCV infection is associated with steatosis, which promotes fibrosis progression.11 12 HCV-associated liver injury consists of direct, virus-triggered inflammation as well as indirect, virus-simulated, steatohepatitis-like injury. We propose that in some patients, there is a positive-feedback loop of HCV-related steatohepatitis physiology: HCV infection induces steatosis, which stimulates HCV replication. Host genetic factors for steatosis can exacerbate that positive feedback. Once the HCV is cleared, the direct, virus-triggered, inflammatory component resolves rapidly, but the resolution of the steatohepatitis-like component depends on the relative contributions of viral factors and host genetic factors to the steatosis. Our hypothesis is represented schematically in figure 3. In some patients, the steatohepatitis-like component is absent. Those patients improve rapidly following viral clearance. In other patients, the steatohepatitis-like component is an important part of the disease.16 In some of those patients, the steatohepatitis phenomenon is largely virus driven17 and resolves after treatment, whereas in others, the steatohepatitis phenomenon is predominantly driven by host genetic factors. We hypothesise that patients of the latter type undergo continued decompensation after viral clearance and can be identified by a combination of genetic susceptibility markers and pretreatment and post-treatment measures of non-alcoholic steatohepatitis.
Steatosis can perpetuate decompensation after virological cure. Hepatitis C virus (HCV)-associated liver injury consists of direct, virus-induced inflammation (pathway 1) as well as indirect, virus-simulated, steatohepatitis-like injury (pathway 2). Simple, virus-induced inflammation resolves after sustained virological response (SVR). We hypothesise that in patients with a genetic risk for steatosis and diabetes, virus-triggered steatohepatitis-like injury persists despite SVR and continues to perpetuate further decompensation.
That hypothesis is currently highly speculative and only serves as a plausible explanation for our broader hypothesis that patients with PNPLA3 risk alleles have delayed recovery. Our results showed that one of the genetic risk factors (PNPLA3) for steatosis was predictive of the outcome of decompensated HCV cirrhosis (recovery vs further decompensation) after SVR. Our sample size calculation showed that we are underpowered with TM6SF2 and may be underpowered with MBOAT7. The effect of time and time interaction with PNPLA3 cannot be demonstrated due to sample size limitation. We were unable to support that the effect of PNPLA3 is mechanistically related to hepatic steatosis. We measured hepatic steatosis using CTL−S, a method widely validated in the field of living-donor liver transplantation18 and in the general population,19 and found that it did not correlate with the primary outcome nor with any other genetic (PNPLA3, TM6SF2, MBOAT7) or phenotypic (BMI, diabetes) parameters. We speculate that in the setting of advanced cirrhosis, liver density is overwhelmingly increased relative to hepatic steatosis.
The reasons for the variable outcomes of decompensated cirrhosis after DAA treatment are unclear. In a shorter term follow-up (eg, 12 weeks after SVR),20–22 47%–68% of patients who achieved SVR and did not require liver transplantation by week 12 had CPT score improvement, whereas 11%–24% had worsened CPT scores. Among patients with CPT class B cirrhosis or low (<15–18) MELD score, 35%–61% had improved MELD scores, whereas 22%–33% had worsened MELD scores. Among patients with CPT class C cirrhosis or high (>15–18) MELD score, 81%–87% had improved MELD scores, whereas 13%–33% had worsened MELD scores. In a longer term follow-up (36 weeks after SVR, DALTON-C study NCT02292706), two-thirds of surviving patients with CPT class B cirrhosis improved by one CPT class, while two-thirds and one-third of patients with CPT C cirrhosis improved by one CPT class and two CPT classes, respectively.23
Recently, the BE3A score,14 which is a sum of five factors, was identified to be associated with clinical recovery from decompensated cirrhosis after DAA treatment: BMI <25, absence of encephalopathy, absence of ascites, ALT>60 IU/L, and albumin >3.5 g/dL. Patients with BE3A score ≥4 have a 75% chance of recovering to CPT class A after DAA treatment. Our study population came from a transplant centre, however, and we studied only patients with CPT class B or C. Therefore, all of our patients had BE3A score ≤3. When we entered both PNPLA3 and BE3A score into the mixed-effects model, only PNPLA3 was statistically significant.
Unpredictable responses to DAA treatment require clinicians to refer patients with advanced cirrhosis for liver transplant evaluation,11 even after the primary disease is cured. In published reports, approximately one-third of those patients experienced further decompensation and required liver transplantation.9 The ability to stratify patients after treatment for HCV would allow resources to be used more efficiently. We aimed to identify genetic factors that can predict prognosis after HCV clearance.
Our results indicate that a genetic polymorphism associated with hepatic steatosis (rs738409 of PNPLA3) affects biochemical (MELD score) and clinical (CPT score) recovery following DAA treatment for HCV cirrhosis. The magnitude of the effect is too small, however, to expedite or defer patients for liver transplant evaluation. On the other hand, an understanding of the genetic factors that influence clinical outcomes will provide insight into the pathophysiology of clinical recovery, leading to new therapeutic approaches that improve outcomes for patients with poor prognostic factors.
CC genotype, those with the PNPLA3 CG/GG genotypes had slower clinical recovery (ie, higher CPT score) from higher PSE subscore. The first clinical encounters 12, 24, and 48 weeks after SVR were used to calculate the PSE component of the CPT score. Patients requiring hospitalisation for PSE in the 12 weeks before the clinical encounter were assigned 3 points. Patients continuing to take any treatments for PSE including rifaximin, lactulose, or polyethylene glycol were assigned 2 points. Patients able to cease all treatments for PSE were assigned 1 point. Patients who took lactulose or polyethylene glycol for constipation but never had a diagnosis of PSE were assigned 1 point.
BMI <25, absence of encephalopathy, absence of ascites, ALT>60 IU/L, and albumin >3.5 g/dL. Patients with BE3A score ≥4 have a 75% chance of recovering to CPT class A after DAA treatment. Our study population came from a transplant centre, however, and we studied only patients with CPT class B or C. Therefore, all of our patients had BE3A score ≤3. When we entered both PNPLA3 and BE3A score into the mixed-effects model, only PNPLA3 was statistically significant.
Unpredictable responses to DAA treatment require clinicians to refer patients with advanced cirrhosis for liver transplant evaluation,11 even after the primary disease is cured. In published reports, approximately one-third of those patients experienced further decompensation and required liver transplantation.9 The ability to stratify patients after treatment for HCV would allow resources to be used more efficiently. We aimed to identify genetic factors that can predict prognosis after HCV clearance.
Our results indicate that a genetic polymorphism associated with hepatic steatosis (rs738409 of PNPLA3) affects biochemical (MELD score) and clinical (CPT score) recovery following DAA treatment for HCV cirrhosis. The magnitude of the effect is too small, however, to expedite or defer patients for liver transplant evaluation. On the other hand, an understanding of the genetic factors that influence clinical outcomes will provide insight into the pathophysiology of clinical recovery, leading to new therapeutic approaches that improve outcomes for patients with poor prognostic factors.
Supplemental material
![[bmjgast-2018-000241supp001.JPEG]](https://bmjopengastro.bmj.com/content/bmjgast/6/1/e000241/DC1/embed/inline-supplementary-material-1.jpg?download=true)
Supplemental material
![[bmjgast-2018-000241supp002.JPEG]](https://bmjopengastro.bmj.com/content/bmjgast/6/1/e000241/DC2/embed/inline-supplementary-material-2.jpg?download=true)
Supplemental material
![[bmjgast-2018-000241supp003.png]](https://bmjopengastro.bmj.com/content/bmjgast/6/1/e000241/DC3/embed/inline-supplementary-material-3.png?download=true)
Supplemental material
![[bmjgast-2018-000241supp004.JPEG]](https://bmjopengastro.bmj.com/content/bmjgast/6/1/e000241/DC4/embed/inline-supplementary-material-4.jpg?download=true)
References
Footnotes
Contributors Study concept and design, critical revision of the manuscript, obtained funding: WD, SAW. Analysis and interpretation of data: WD, Brooke Fridley, JH. Drafting of the manuscript: WD. Facilitation of access to patients: RMT, JCO, MSO, NT, BNF, PKP, ML, TMS. Acquisition of data: AV, Brian Bridges, JZ, Cindy Garcia, MW, RA, CG, SF, Hillary Smith.
Funding This study was supported in part by an NIH Clinical and Translational Science Award grant (UL1 TR000001, formerly UL1RR033179), awarded to the University of Kansas Medical Center and NIH_NOA_1K23DK109294-01A1 awarded to WD. The study is also supported by the University of Kansas Medical Center Liver Center.
Competing interests WD reports speaking and consultation fees from Gilead and Merck. RT reports speaking fees from Bristol-Myers Squibb, Gilead, Intercept, Merck and Salix/Valeant, and consultation fees from Bayer and Gilead. PKP reports speaking fees from AbbVie and Gilead.
Patient consent for publication Not required.
Ethics approval The study was approved by the KUMC Human Research Protection Program (STUDY00002047).
Provenance and peer review Not commissioned; externally peer reviewed.
Data sharing statement No additional data are available.