Article Text

Abstract
Objective The range of normal serum alkaline phosphatase is not well defined. We used data from the National Health and Nutrition Examination Survey from 2009 to 2016 to generate normal ranges for a racially diverse sample of healthy adults.
Methods Respondents 18 years or older were included. Conditions known to elevate alkaline phosphatase were cause for exclusion. Alkaline phosphatase was measured using a colorimetric method based on standardised National Health and Nutrition Examination Survey protocols. Because alkaline phosphatase values were not normally distributed, log transformation was used. We calculated upper limits of normal (97.5 percentile), stratified by sex and race/ethnicity, and 90% CIs for the upper limits of normal.
Results 1199 respondents (673 female, 526 male) had body mass index from 18.5 to less than 25. Upper limits of normal were highest among Hispanics (123.2 IU/L (90% CI 110.2 to 136.7) for females; 123.8 IU/L (90% CI 112.0 to 135.1) for males), followed by African Americans (109.9 IU/L (90% CI 97.3 to 122.4) for females; 116.3 IU/L (90% CI 105.0 to 126.1) for males) and whites (97.1 IU/L (90% CI 91.0 to 103.4) for females; 109.6 IU/L (90% CI 102.1 to 116.3) for males). Asian American/Pacific Islander respondents had the lowest results: 93.8 IU/L (90% CI 88.2 to 99.5) for females and 95.3 IU/L (90% CI 88.1 to 102.1) for males.
Conclusions The upper limit of normal alkaline phosphatase varies by race/ethnicity in a large US sample with body mass index of 18.5<25.
- alkaline phosphatase
- primary biliary cirrhosis
- hepatitis B
- hepatitis C
This is an open access article distributed in accordance with the Creative Commons Attribution Non Commercial (CC BY-NC 4.0) license, which permits others to distribute, remix, adapt, build upon this work non-commercially, and license their derivative works on different terms, provided the original work is properly cited, appropriate credit is given, any changes made indicated, and the use is non-commercial. See: http://creativecommons.org/licenses/by-nc/4.0/.
Statistics from Altmetric.com
Summary box
What is already known about this subject?
The normal alkaline phosphatase levels were established many years ago, and they have not been validated in an ethnically diverse population.
What are the new findings?
Alkaline phosphatase levels are lower than previously described and vary according to sex and race/ethnicity. This may set a new ‘healthy’ if confirmed.
How might it impact on clinical practice in the foreseeable future?
The knowledge of healthy levels of alkaline phosphatase can assist in early identification of disease process such as primary biliary cholangitis and assist in appropriate medication adjustments, prognosis and overall patient care.
Introduction
Circulating alkaline phosphatase (ALP) primarily originates from the liver and bones and is routinely used as a as a marker of hepatic/biliary injury. Values exceeding the upper limit of normal (ULN) often prompt further clinical follow-up, including measurement of gamma-glutamyl transferase and fractionation of ALP to determine the origin of this elevation—thus the establishment of appropriate cutoffs has clinical implications. Standard procedures for the establishment of reference ranges for laboratory assays were published by the International Federation of Clinical Chemistry in 2011;1 however, there is considerable variation in results for ALP across various laboratories, and there is not universal acceptance of a single ULN. Moreover, published reference intervals have been derived from racially and ethnically homogeneous samples, such as Northern European2 or, more recently, Han Chinese,3 which may not be generalisable to the multiracial population of the USA. We used demographic and laboratory data from the annual National Health and Nutrition Examination Survey (NHANES)4 collected from 2009 to 2016 to evaluate normal ranges of ALP among a large, racially diverse sample of healthy adults in the USA.
Methods
Deidentified NHANES data are made available for public use; respondents 18 years or older were included. Respondents were excluded if they had evidence of any of the conditions known to elevate ALP or if there was missing data regarding those conditions, including pregnancy; infection with hepatitis B or C or HIV; significant alcohol intake (>21 standard drinks/week in males and >14 standard drinks/week in females); metabolic syndrome (as a surrogate for non-alcoholic fatty liver disease) or chronic kidney disease/end stage renal disease (creatinine >1.5 mg/dL or dialysis). Variables of interest included age, sex, self-reported race/ethnicity (Asian American/Pacific Islander (AAPI), Black/African American (AA), white and Hispanic ethnicity (of any race)), body mass index (BMI; categorised as <18.5, 18.5<25, 25<30, 30<35, 35<40 and ≥40).
NHANES uses standardised specimen collection, handling and analysis procedures.5 During the study period, all specimens were analysed using the UniCel DxC800 Synchron Clinical System (Beckman Coulter); this system uses a colorimetric kinetic rate method using a 2-amino-2-methyl-1-propanol buffer to measure ALP activity in serum.6 Reported reference ranges for this analyzer are 32–91 IU/L.7
Analysis was confined to respondents with BMI 18.5<25. Box-Cox transformation was considered given ALP was not normally distributed.8 We performed multivariable regression to test the effects of sex and race/ethnicity on the transformed ALP values, including consideration of sex-by-race interactions and variables or variable interaction, which were retained in the model if p<0.05. Hoffmann’s method using a Q-Q (quantile-quantile) plot of transformed ALP was used to estimate the ULN, defined as the 97.5th percentile for each stratified covariate retained in the multivariable model.9 10 One thousand simulations were conducted to generate 90% CIs for the ULN; groups were considered to be significantly different from one another if CIs did not overlap.
Results
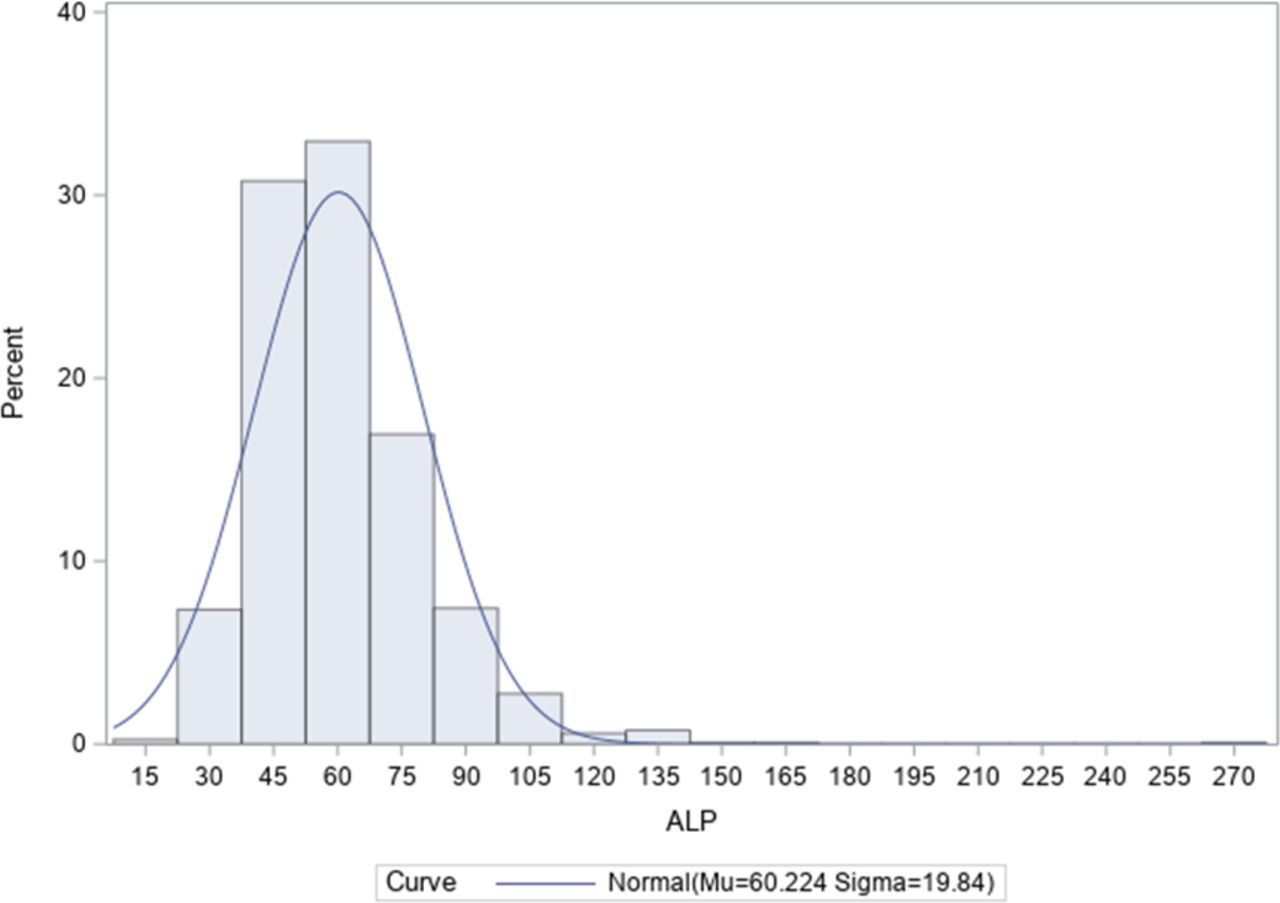
A total of 3053 respondents were included, 1199 (673 female, 526 male) of whom had BMI 18.5<25. Table 1 displays the distribution of respondents by race/ethnicity. Because ALP values were not normally distributed (figure 1), log transformation was used. Age was not associated with ALP and was not included in further analysis. Sex and race/ethnicity were significantly associated with ALP (p<0.0001) and retained the model.

Distribution of alkaline phosphatase values in the analytic sample of respondents with BMI 18.5<25. Mean ALP was 60.2 IU/L; median was 57 IU/L; Q1 was 47 IU/L; Q3 was 69 IU/L. Skewness was 1.87. Kurtosis was 10.69. AA, African American; AAPI, Asian American/Pacific Islander; ALP, alkaline phosphatase; BMI, body mass index; Hisp, Hispanic includes any race; LCL, lower confidence limit; NHANES, National Health and Nutrition Examination Survey; UCL, upper confidence limit; ULN, upper limit of normal.
Distribution of sample by race/ethnicity
Figure 2 displays the 97.5 percentile (ULN) for ALP with 90% CIs for each value, stratified by race/ethnicity and sex. ALP values were highest among Hispanics (123.2 IU/L (90% CI 110.2 to 136.7) for females and 123.8 IU/L (90% CI 112.0 to 135.1) for males), followed by AAs (109.9 IU/L (90% CI 97.3 to 122.4) for females and 116.3 IU/L (90% CI 105.0 to 126.1) for males) and whites (97.1 IU/L (90% CI 91.0 to 103.4) for females and 109.6 IU/L (90% CI 102.1 to 116.3) for males). AAPI respondents had the lowest results (93.8 IU/L (90% CI 88.2 to 99.5) for females and 95.3 IU/L (90% CI 88.1 to 102.1) for males). Notably, the ULN for AAPI male respondents was significantly lower than for all other race/ethnic groups, while the ULN for Hispanic female respondents was significantly higher than for AAPI and white females.
97.5th percentile values (IU/L) for alkaline phosphatase derived from adult respondents to the National Health and Nutrition Examination Survey with body mass index 18.5<25. ALP, alkaline phosphatase; NHANES, National Health and Nutrition Examination Survey.
Discussion
Using a large, racially diverse sample of healthy NHANES respondents, we found that the 97.5th percentile levels of ALP varied significantly by sex and race/ethnicity. Male AAPIs had a significantly lower ULN (95.3 IU/L) compared with other race/ethnic groups; ULNs for female AAPIs and whites were also lower than for other groups, but there was some overlap in CIs. Hispanics of both sexes had the highest ULNs; this difference was significant in females compared with AAPIs and whites.
Our study has some limitations. Although use of NHANES data permits access to a large, geographically and racially diverse sample, detailed health information beyond that collected for the survey is not available. Specifically, we lack data regarding conditions whose prevalence may vary by race/ethnicity and that may affect ALP (eg, hyperparathyroidism11 or thyroid disorders12). Likewise, data regarding individual ALP isoenzymes that estimate the proportion of ALP originating from different tissue sources was not available. A prospective study design that accounts for these limitations may be necessary to confirm that our results were not confounded by these variables. In addition, exploratory analyses did not suggest any consistent relationship between ALP and BMI category by race/ethnicity or sex (data not shown). As a result, our sample was also limited to respondents with BMI 18.5>25 in an effort to generate ‘normal’ values among a healthy sample of individuals.
We note with interest that all 97.5th percentile values in our sample exceeded the reference range reported in the manual for the analyzer used (91 IU/L). Because the demographic characteristics of the sample used to develop these ranges were not available, we are unable to speculate as to possible reasons for this discrepancy. Variation in laboratory analyzer output ranges has impeded the development of a widely accepted standard reference range for ALP; as a result, manufacturers recommend calibration of analyzer equipment at each site. Our findings underscore the importance of selecting an appropriate patient pool for this calibration, in order to generate normal ranges that reflect the sex and racial profile of the patients at each health system. Failure to reference appropriate normal values can impact care.
In particular, normal ALP (and multiples of the ULN) are frequently used in the diagnosis and evaluation of treatment efficacy for primary biliary cholangitis (PBC). White women are most commonly affected by PBC, and as a result, much of the literature reflects laboratory parameters derived from this cohort. Our data suggest that these values may not appropriately represent normal ranges in male patients and those from other racial groups, potentially impacting their care. Future prospective studies in large, racially diverse samples are needed to confirm our results.
Acknowledgments
We thank Kelly Schrank, MA, ELS, of Bookworm Editing Services LLC for her editorial services in preparing the manuscript for publication.
Footnotes
Presented at Preliminary results for this analysis were presented as a poster at the annual meeting of the American Association for the Study of Liver Diseases (AASLD) 2019, Boston, MA, USA.
Correction notice The article has been corrected since it was published. The article title has been updated and middle initials for authors, Humberto C Gonzalez, Stuart C Gordon, Robert G Gish have been added.
Contributors Conception and design of the study: HCG, ZI, MI, RGG. Generation, collection, assembly, analysis and/or interpretation of data: HCG, ZI, RW, JL, ML, ST, SCG, MI, RGG. Drafting or revision of the manuscript: HCG, ZI, RW, ST, MI. Approval of the final version of the manuscript: HCG, ZI, RW, JL, ML, ST, SCG, MI, RGG.
Funding The authors have not declared a specific grant for this research from any funding agency in the public, commercial or not-for-profit sectors.
Competing interests None declared.
Patient consent for publication Not required.
Provenance and peer review Not commissioned; externally peer reviewed.
Data availability statement No data are available. This research study was conducted retrospectively from deidentified National Health and Nutrition Examination Survey (NHANES) data, which is made available for public use.