Article Text

Abstract
Objective This study aimed to provide evidence-based results on differences in overall survival (OS) rate to guide the diagnosis of cancer cachexia.
Design Data collection and clinical assessment was performed every 3 months (5 visits): baseline data, muscle strength, nutritional and psychosocial status. 2 definitions on cachexia using different diagnostic criteria were applied for the same patient population. Fearon et al's definition is based on weight loss, body mass index (BMI) and sarcopenia. Evans et al nuances the contribution of sarcopenia and attaches additional attention to abnormal biochemistry parameters, fatigue and anorexia. The mean OS rates were compared between patients with and without cachexia for both definitions.
Results Based on the population of 167 patients who enrolled, 70% developed cachexia according to Fearon et al's definition and 40% according to Evans et al's definition. The OS in the cachectic population is 0.97 and 0.55 years, respectively. The difference in OS between patients with and without cachexia is more significant using the diagnostic criteria of Evans et al. The focus of Fearon et al on weight loss and sarcopenia over-rates the assignment of patients to the cachectic group and OS rates have less prognostic value.
Conclusion This study presents a correlation with prognosis in favour of Evans et al’ definition as a tool for cachexia diagnosis. This means that weight loss and BMI decline are both key factors in patients with cancer leading to cachexia but less decisive as stated by Fearon et al. Instead, extra factors gain importance in order to predict survival, such as chronic inflammation, anaemia, protein depletion, reduced food intake, fatigue, decreased muscle strength and lean tissue depletion.
Trial registration number B300201112334.
- CANCER SYNDROMES
- NUTRITIONAL STATUS
- CANCER
This is an Open Access article distributed in accordance with the Creative Commons Attribution Non Commercial (CC BY-NC 4.0) license, which permits others to distribute, remix, adapt, build upon this work non-commercially, and license their derivative works on different terms, provided the original work is properly cited and the use is non-commercial. See: http://creativecommons.org/licenses/by-nc/4.0/
Statistics from Altmetric.com
Summary box
What is already known about this subject?
▸ Cachexia is a multifactorial syndrome with involuntary progressive weight loss as a result of reduction of skeletal muscle mass with or without depletion of adipose tissue.
▸ Cancer cachexia is characterised by systemic inflammation and metabolic changes leading to progressive functional impairment.
▸ Sarcopenia as an index for cancer cachexia is a matter of debate.
▸ There is a lack of consensus on a definition, diagnostic criteria and classification of cancer cachexia
What are the new findings?
▸ Evidence-based results showing a substantial difference in the prediction of overall survival comparing the diagnostic guidelines according to Fearon et al2 with the diagnostic guidelines according to Evans et al.1
▸ Putting the focus on weight loss and sarcopenia over-rates the assignment of the diagnosis of cachexia resulting in survival rates with less prognostic value.
▸ Additional factors gaining importance in the diagnosis of cancer cachexia are: chronic inflammation, anaemia, protein depletion, anorexia and fatigue.
▸ Extra humoural factors should be a new point of interest in the further exploration of cachexia parameters.
How might it impact on clinical practice in the foreseeable future?
▸ Standardisation of the routine clinical practice for diagnosis of cancer cachexia would help in the identification of patients who are more at risk for the development of cachexia.
▸ In view of the current therapeutic approach, which targets the fundamental pathways involved in the pathogenesis of cancer cachexia, monitoring the humoural factors in daily practice would create the possibility to capture the diagnosis of cancer cachexia up close.
Introduction
Cancer cachexia is a multifactorial syndrome with a dramatic impact on patient's quality of life associated with poor responses to antitumour therapy and decreased survival.1–5 The prevalence of cancer cachexia is high: it is estimated to affect 50–80% of patients with cancer and accounts for up to 20% of deaths due to cancer in 2014.3 The main clinical feature of cachexia is involuntary progressive weight loss as a result of reduction of skeletal muscle mass (SMM) with or without depletion of adipose tissue. While starvation is also characterised by the same properties, it is not possible to reverse cachexia by means of conventional nutritional support.6 ,7 This is due to the complex underlying pathophysiology of cancer cachexia in response to the tumour–host interactions.
Many of the primary events driving cachexia are mediated by the central nervous system.8 ,9 The best known cachexia-mediating factors are cytokines (tumour necrosis factor α (TNF-α), interleukin 1 (IL-1), IL-6 and interferon-γ), neuropeptide-Y and hormones (insulin, glucagon and leptin). This means that cancer cachexia is characterised by systemic inflammation and metabolic changes resulting in a negative protein and energy balance. Cancer cachexia leads to progressive functional impairment. Although studies of molecular pathways involved in muscle wasting made progress in unravelling the complex biology of cachexia,10 ,11 there still remains a lack of consensus on the diagnostic criteria of cancer cachexia, which impedes any meaningful advancement in therapeutic clinical trials and clinical practice.
Many definitions of cachexia have been published.1 ,2 ,12–14 However, guidelines for diagnosis of cancer cachexia are just starting to appear. In a formal consensus process, expert groups discussed the key factors that guide clinical decision-making in the management of cachexia defined as the Fearon et al criteria2 which were based on a generic definition proposed earlier by Evans et al1 in 2008. This generic definition applies to all types of cachexia and includes, besides weight loss and low body mass index (BMI), at least three additional criteria from five other contributing factors such as decrease in muscle strength, fatigue, anorexia, low fat-free mass (FFM) and abnormal biochemistry (high C reactive protein (CRP), low albumin or low haemoglobin (Hb)). The key difference between Evans et al' definition and Fearon et al's definition is the emphasis on the loss of SMM (ie, sarcopenia), to which the latter definition attaches more importance. However, the annex of the factor sarcopenia has no proven added value and it remains undetermined to which extent sarcopenia is a useful index for cancer cachexia.15
Since in the literature, no evidence-based results are available to guide the diagnosis of cancer cachexia, the criteria to use remain arbitrary. Currently, in routine clinical practice, cachexia is diagnosed by combining anthropometric measures (body weight and BMI), biological values (albumin, CRP), body composition (total body water (TBW) and FFM) and nutritional screening questionnaires.16
Objective
The objective of this study was to monitor the cachectic status of oncology patients according to Fearon et al's and Evan's criteria (table 1) for 1 year and to compare the actual survival between patients with and without cachexia by means of the Fearon et al's and Evan's criteria (table 1).1 ,2 This way, we could evaluate whether the two-factor profile of Fearon et al incorporating anthropometric values and sarcopenia might relate sufficiently to the patient's overall survival (OS) as compared with the incorporating criteria by Evans et al. In addition, the study evaluates the feasibility of additional methods (eg, bioelectrical impedance analysis (BIA)) in daily clinical practice in support of patients with cancer cachexia.
List of criteria for diagnosis of cachexia according to Evans et al and Fearon et al with translation to our study methods
Materials and methods
Patient population
Ambulatory patients with cancer of 18 years or more, with digestive, lung, breast or head/neck tumours, with WHO performance status of 0–2, without a pacemaker and who received previous therapy admitted to a standard care facility and provided signed informed consent were eligible for the study.
Recruitment took place in four Belgian medical centres between 2012 and 2013:1 Universitair Ziekenhuis Antwerpen (UZA; Edegem),2 AZ Maria Middelares (Gent),3 Heilig Hart Ziekenhuis Lier (Lier),4 St Jozef Kliniek (Bornem). A total number of 167 patients started the study.
Investigational assessments and analysis
Baseline data (eg, demography, diagnosis and disease status), nutritional status, muscle strength and psychosocial status of the patients were assessed at five consecutive hospital visits with an (average) interval of 3 months.
Nutritional status
The nutritional status was assessed by means of the Nutritional Risk Screening score (NRS-score), Patient-Generated Subjective Global Assessment (PG-SGA) and bioelectric impedance analysis (BIA, Equilibre3, Belgium).17 The NRS-score and PG-SGA estimate the risk of malnutrition based on body weight, BMI and dietary intake. On the base of dietary intake, a member of the nutrition team estimated the individual protein need and energy need. BIA is used as a method to estimate the body composition by measuring individual resistance (RZ), reactance (XC) and phase angle (PA) to calculate TBW, FFM and SMM (for equations see online supplementary appendix 1).18 ,19
supplementary data
Muscle strength
The hand grip strength was measured as an indicator of the muscle strength of the upper extremities using a digital hand dynamometer on the dominant hand (Fysiomed, Saehan medical, country). Patients were instructed to stand upright holding the dynamometer on the side but not against their body. Patients were asked to perform three maximum force trials. The average attained value was used as the final score.
Psychosocial status
The psychosocial status of the patient was assessed by means of the EORTC Quality of Life Questionnaire C30 (EORTC QLQ-C30), which incorporates nine multi-item scales: five functional scales (physical, role, cognitive, emotional and social functioning), three symptom scales (fatigue, pain and nausea/vomiting) and a Global Health Status/Quality of Life (QoL) scale.
Definitions of cachexia
The generic definition of cachexia (Evans et al) is based on the presence of weight loss of at least 5% during the past 6 months or BMI<20 kg/m2, plus at least three criteria out of the list described in table 2. According to Fearon et al a patient could be diagnosed with cachexia based on one out of three weight loss definitions: weight loss of at least 5% during the past 6 months in the absence of simple starvation or weight loss of at least 2% together with either a BMI<20 kg/m2 or sarcopenia. Table 1 indicates the details of all the criteria of both definitions and how these criteria were translated to our study.
Descriptive characteristics of the cancer patient population included in the trial (average and SD)
Laboratory analysis
Following each visit, 10 mL of peripheral blood was collected in EDTA tubes. The tubes were instantly cooled on ice and centrifuged at 3000 rpm for 10 min at 4°C and aliquots were immediately stored at −20°C before transport (<1w) to the biobank of the UZA or stored immediately at −80°C, when available, until analysed at the biobank of the UZA. Standard laboratory tests for albumin, prealbumin, Hb and CRP were centrally performed at the Department of Clinical Biology, UZA.
Statistical analysis
All data were recorded using the commercial electronic data capturing system (Remecare, Remedus, Belgium). Categorical data are reported as number and percentages, continuous data as mean and SD, when normally distributed, or as median with lower and upper quartile if not. Normality has been checked by Shapiro-Wilk tests and QQ plots. If needed, a log transformation is used to improve normality. Differences between baseline characteristics of patients with and without cachexia were assessed by means of χ2 test for categorical variables or unpaired t-test for continuous, normally distributed data (age). For the relation between the cachectic status of the patient and time-varying variables, linear mixed-effects models are used. By including a patient-specific intercept, correlations between measurements of the same patient are taken into account. Means and SEs based on the mixed-effects model are reported. p Values are corrected for multiple testing using the stepdown Bonferroni-Holm correction.
OS of the patients was studied with Kaplan-Meier curves and Cox regression where cachexia is treated as a time-dependent covariate. HRs and corresponding 95% CIs are reported. All analyses were performed with SAS V.9.4 or R V.3.1.1.
Results
Diagnosis of cachexia
A total number of 176 patients of which 167 started their study visit. In 67.1% men, an average age of 64 years, the gastrointestinal tract was the predominant location of the primary tumour (65.3%) and the majority of the patient population had metastases (67.7%; table 2).
A consort diagram presents the number of patients, dropouts and deaths during the study (figure 1). A total of 176 patients were initially recruited of which 167 patients (95%) started their first study visit (consult 1). Fifty-four of the patients completed their five study visits (26%). During the study, 35 patients (21%) withdrew for variable reasons (too weak, end of treatment, etc), 25 entered palliative setting (15%) and 62 deaths (37%).
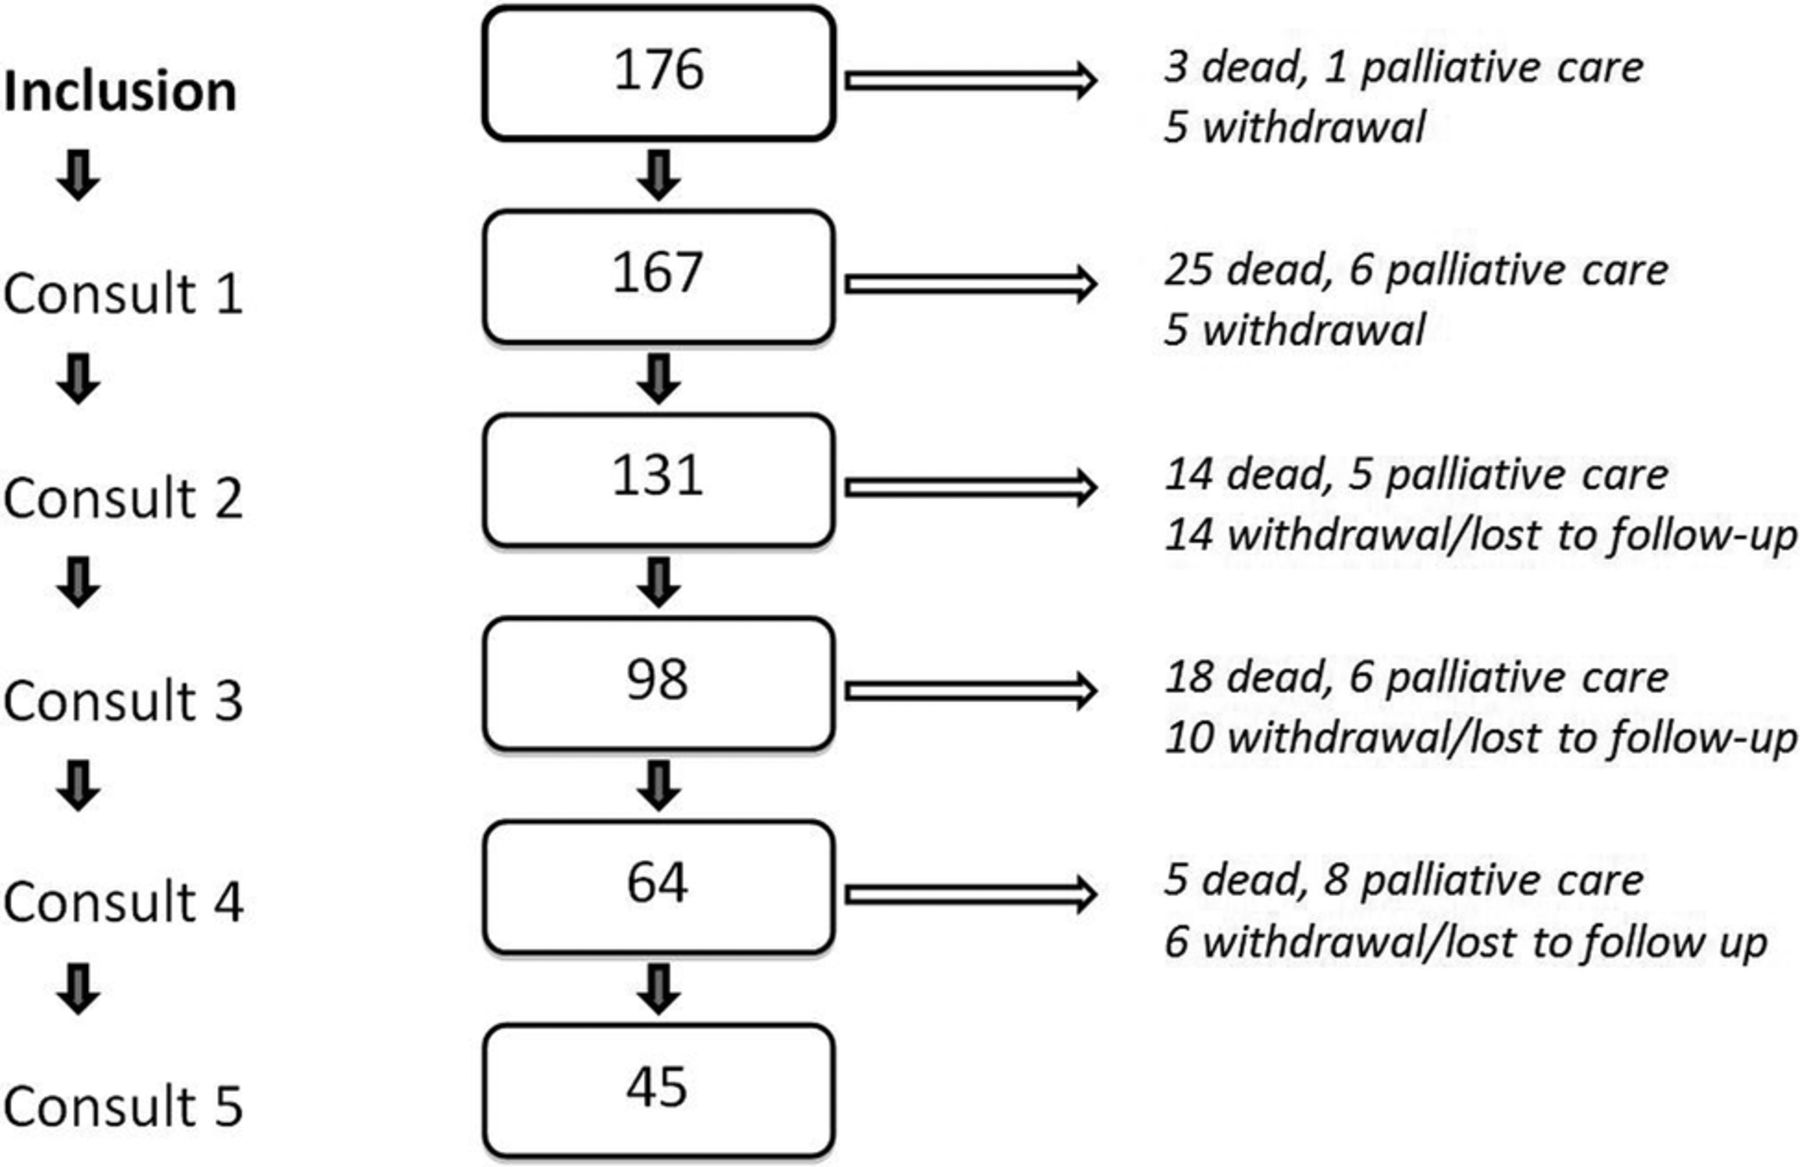
Consort diagram of the number of patients through the longitudinal follow-up of five consults with 3-month interval. Patients entering palliative care, patients withdrawing from the study or patients who died could not be taken into account at the following consult.
Patients were monitored for the cachectic status at every consult by inspecting all criteria listed by Fearon et al and Evans et al (table 3). About 70% of the population developed cachexia at some time during the five visits according to Fearon et al's definition, while it was about 40% according to Evan et al's definition. This difference was already visible from consult 1 onwards: 50% patients with cachexia (83/167) according to Fearon et al and 18% of the same patient group (30/167) according to Evans et al. The percentage of patients with cachexia according to Fearon et al was significantly higher for every time point as compared with Evans et al (an average of 57±8 (%) patients with cachexia vs an average of 18±7 (%) patients with cachexia).
For both definitions of cachexia, the number of patients meeting separate criteria are presented per consult
The total patient population was evaluated for the presence of differences between the cachectic and the non-cachectic group based on the primary tumour location, the metastatic status, age and gender. The cachectic group contains patients who were diagnosed as cachectic at minimum one consult and the non-cachectic group contains patients who were never diagnosed as cachectic along the five consults. We could not demonstrate significant differences between patients with and without cachexia based on age, gender, primary location of the tumour or the absence or presence of metastases (table 4).
The total patient population was evaluated for the effect of four confounding factors (primary tumour location, metastatic status, age and gender) known to have an effect on general survival
Survival rates
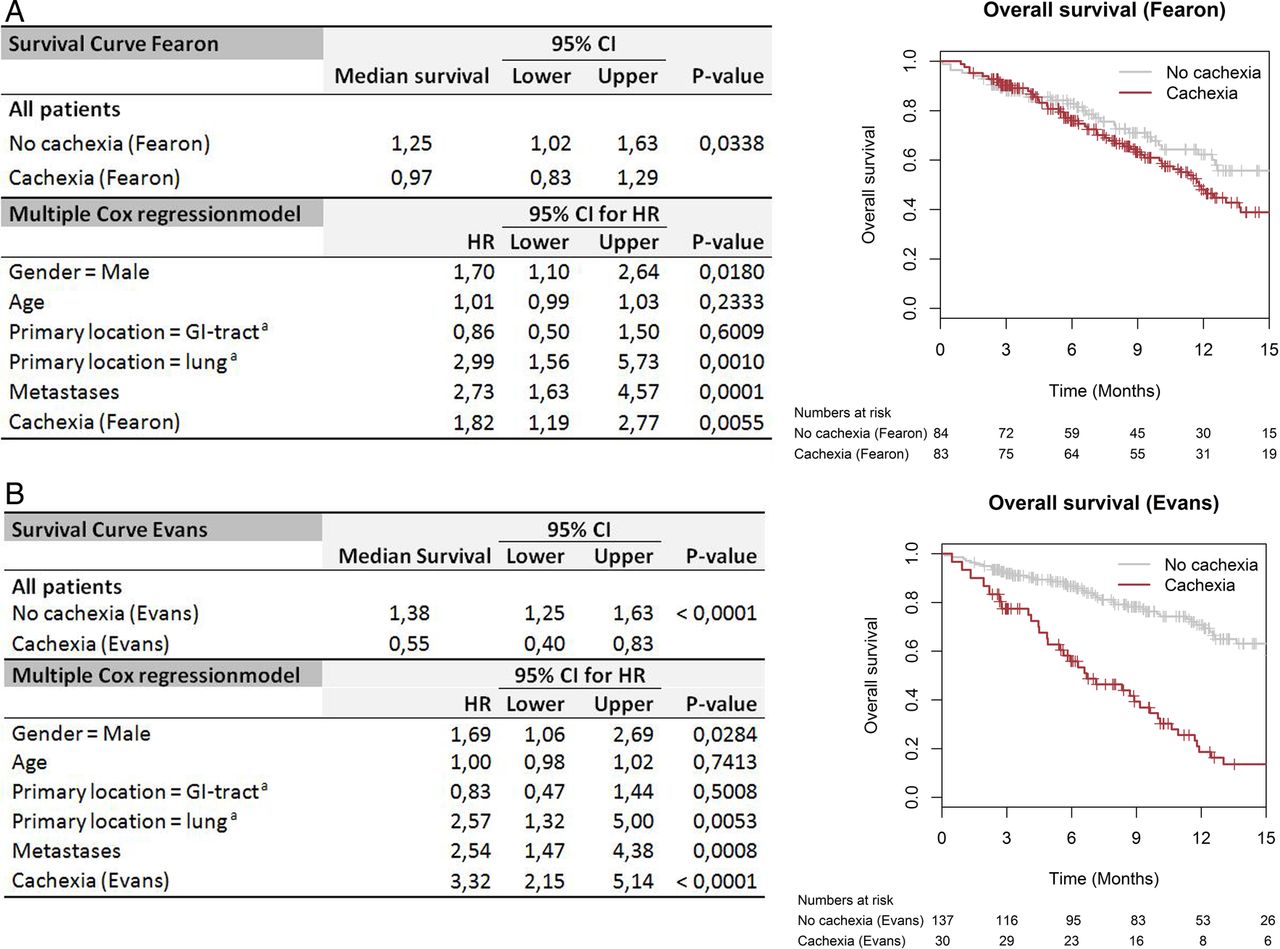
According to Fearon et al, the median OS in the cachectic population is 0.97 years, which is significantly shorter than 1.25 years for patients without cachexia (respectively 95% CI 0.83 to 1.29 and 1.02 to 1.63 with p=00 338; figure 2A). Similarly, patients with cachexia diagnosed according to Evans et al have a shorter median OS rate of 0.55 years as compared with the median OS rate of 1.38 years of patients without cachexia (respectively 95% CI 0.40 to 1.14 and 1.25 to 1.63 with p<00 001; figure 2B). The HR of patients with cachexia versus without cachexia according to the definition of Evans et al is 3.32 while for Fearon et al this HR is only 1.82. While both are significant (respectively p<00 001 and p=00 338), the effect size is larger by the definition of Evans et al. This difference in effect size cannot be formally tested since for both models the same patient population is used. Following correction for primary tumour location, metastatic status, age and gender, the difference between patient groups with and without cachexia diagnosis according to Fearon et al becomes more significant (p=00 055 instead of p=00 338) and the difference according to Evans et al remains highly significant (p<00 001; figure 2A, B).

Kaplan-Meier estimation of the survival analysis and multiple Cox regression for all patients as separated in cachectic and non-cachectic; in 2A according to Fearon et al and in 2B according to Evans et al. aReference=primary location=other (breast/head/neck). bReference=no sarcopenia—no cachexia. GI, gastrointestinal.
Effect of weight loss and sarcopenia
The effect of weight loss on the OS of patients with cachexia has been evaluated by regrouping the population into:1 patients without weight loss and BMI>20 kg/m2,2 patients with weight loss only, being patients with cachexia according to Fearon et al but no cachexia according to Evans et al,3 and patients selected by the definition of Evans et al (weight loss and three out of five criteria). There was no difference in OS between patients without weight loss and patients with only weight loss (p=0.519; figure 3A). However, there was a highly significant difference in OS between patients selected according the definition of Evans et al and patients with or without weight loss only (p<0.0001).

Kaplan-Meier estimation of the survival analysis and multiple Cox regression for all patients to evaluate the influence of weight loss in 3A and the influence of sarcopenia in 3B. aReference=primary location=other (breast/head/neck). bReference=no weight loss. GI, gastrointestinal.
The influence of sarcopenia on the OS of patients when classified according to Fearon et al's criteria has been evaluated by regrouping the population into:1 no sarcopenia and no cachexia,2 sarcopenia and no cachexia,3 no sarcopenia and cachexia and,4 sarcopenia and cachexia. There was no difference detected in OS between all patient groups (p=01 358; figure 3B).
Cachexia markers
The diagnostic criteria included in the definition of Fearon et al being weight loss, BMI and skeletal muscle mass index (SMI) were all significantly decreased in the patients with cachexia (p<0.0001; table 5A). Similarly, there were significant differences for every diagnostic criteria defined by Evans et al (weight loss, BMI, handgrip power, CRP, SMI, albumin) when comparing patients with and without cachexia diagnosed according to Evans et al (table 5B). For the patient with cachexia, the percentage of weight loss and CRP were both higher (p<0.0001), BMI, handgrip power, albumin and SMI were all lower (p<0.0001 for SMI p=0.0145). The group of patients with cachexia according to Fearon et al demonstrated significant reduction of handgrip power (p<0.0001), increased CRP (p=0.026) and unchanged albumin (p=0.066), being criteria included in the definition of Evans et al.
Parameters associated with the diagnosis of cachexia are demonstrated for cachectic patient groups according to the definition of Fearon et al (A) and for Evans et al (B)
Our methods used for assessing nutritional status and muscle strength also provide extra parameters in addition to the criteria as defined by Fearon et al and Evans et al. Protein need and energy need used to estimate the risk of malnutrition from the NRS and PG-SGA were lower for patients of both cachectic groups. The BIA method used to measure the SMI also provides extra parameters related to the body composition. FFM and TBW were significantly lower (p<0.001) for patients of both cachectic groups. RZ was significantly higher (p<0.001) for patients of both cachectic groups. XC and PA were significantly lower for the patients of the cachectic group only in case the criteria of Evans et al were applied (table 5B; p=0.0145 and p<0.0001, respectively). XC, PA and prealbumin were unchanged in the cachectic group diagnosed according to Fearon et al (p=0.392, p=0.066 and p=0.070, respectively).
EORTC questionnaires used to estimate the fatigue and anorexia (being a criteria defined by Evans et al) also revealed a lower quality of life score for both cachectic groups (p<0.0012 and p<0.0001 for respectively patients with cachexia according to Fearon et al and Evans et al).
Discussion
Cancer cachexia remains a challenging multifactorial syndrome with an important impact on the patient's quality of life and response to therapy. Despite many efforts to unravel the complex biology of cachexia, its diagnosis remains infrequently defined. Many definitions of cancer cachexia have been published so far but no consensus exists on which diagnostic criteria should be used in clinical decision-making or clinical trials. Estimation of cachexia among patients with cancer in daily practice is based on arbitrarily selected definitions.
For the first time, this pilot study in which patients were followed in a longitudinal way provides insights into the impact of OS rates comparing two different definitions of cachexia for the same population with cancer. On the one hand we applied the criteria according to an international consensus reported by Fearon et al2 with limited criteria but cancer specific and on the other hand the more generic cachexia definition according to Evans et al1 based on the complex interplay between food intake and an abnormal metabolism.
OS rates: main findings comparing two definitions of cachexia
A total of 167 patients were included and longitudinally monitored for cachectic status for 1 year at five consecutive visits for nutritional status, muscle strength and psychosocial status. A significant shorter OS was observed for patients with cachexia regardless of the diagnostic criteria used as defined by Fearon et al or by Evans et al. This prediction of worse survival for the patients with cachexia remains even after correction for variables with a known effect on survival (gender, primary tumour location, metastatic disease).
However, the proportion of patients with cachexia varied considerably depending on the criteria used. Across all five visits, the number of patients with cachexia according to Fearon et al is high as compared with the number of patients with cachexia according to Evans et al (data not shown).
The focus by Fearon et al is put on a minimum degree of body weight loss. Body weight loss is indeed a hallmark of cancer cachexia, but is not the only symptom. Despite this less rigorous definition, a small but significant difference in OS exists between the patients with and without cachexia (respectively median survival: 0.97 vs 1.25 years, p=0.034). We were however able to show that weight loss alone had no significant impact on the survival curve. Another important factor in the definition of Fearon et al is the absence or presence of sarcopenia. Our results illustrate this since the factor sarcopenia is not able to influence OS. Sarcopenia as an index for cachexia in patients with cancer was already a matter of debate we can only support this controversy.20
Compared with Fearon et al, Evans et al also included weight loss but combined this with at least three of the following criteria: loss of muscle strength, anorexia, lean tissue depletion, distinct fatigue or abnormal biochemistry (decreased albumin, increased CRP or anaemia) to define cachexia. This definition focuses on the complex interplay between reduced food intake and abnormal metabolism and is therefore able to distinguish patients with cachexia from patients without cachexia by the survival rate (respectively median survival: 0.55 vs 1.38 years, p<0.0001). Also, where according to Fearon et al the presence of sarcopenia with weight loss can assign the diagnosis of cachexia to a patient, Evans et al criteria is stricter and sarcopenia is rather one of the components of cachexia and defined as loss of muscle strength and loss of lean tissue.
In conclusion, Evans et al argue for the use of more criteria to diagnose cachexia and in accordance to our population-based results, its definition makes a better prediction of survival. Whereas the focus of Fearon et al on weight loss and sarcopenia over-rates the assignment of patients to the cachectic group and results in survival rates with less prognostic value. On the other hand, one must be aware that the use of Fearon et al's criteria might diagnose cachexia in a much earlier state, thus making the patients with a lower risk a potential target for early intervention. Cachexia indeed represents a spectrum through which patients progress but at present there are no robust biomarkers to identify those patients with precachexia. Loss of SMM could also be age-related without any underlying disease. Therefore, a profiling system for cachexia needs to reflect the underlying metabolic complexity. Also strategies for treating cachexia focus on the underlying metabolic adaptations of increased protein degradation and not only on the measurement of the loss of weight or SMM. These elements are in favour of the use of the criteria of Evans et al in clinical practice where diagnostic criteria include abnormal biochemistry values such as CRP.
Cancer cachexia assessment in clinical practice
In this study, a quantitative correlation with patient prognosis is presented in favour of using the criteria of Evans et al as a tool for the diagnosis of patients with cachexia. This means that weight loss and a decrease in BMI in patients with cancer are both key factors leading to cachexia (table 1) but less decisive as stated by Fearon et al. Instead, other factors need to be taken into consideration in order to be able to predict survival. Extra factors gaining importance according to Evans et al are chronic inflammation (CRP), anaemia (Hb), protein depletion (albumin), reduced food intake (anorexia), fatigue, decreased muscle strength and lean tissue depletion.1
Results are based on a population of 167 enrolled patients. This number reflects a part of the total population seen in clinical practice during the duration of the study. However, according to the strong quantitative correlation between cachexia diagnosis and prognosis, the application of the criteria of Evans et al, is a good choice to use as prognosticator.
The first step in clinical practice should be to identify the patient for recognition of either malnutrition or starvation measuring nutritional risk (ie, NRS, PG-SGA, mini nutritional assessment (MNA), etc). Patients with cancer with weight loss >5% during the past 6 months or a BMI<20 have to be considered to be diagnosed with cachexia. However, cachexia is distinct from starvation, nutritional intervention should be implemented as soon as cancer is diagnosed to reduce nutritional status impairment and improve the general condition and quality of life. Keeping an optimised balance between energy waste and food intake will achieve further specific purposes such as a decrease of rate of complications and an amelioration of the response and tolerance of the patient to the oncological therapy.15 ,17 This study demonstrated the applicability in ambulatory setting of the NRS-score, being easy in use and accepted in European regions.
Evaluation of the presence of extra factors characterising cachexia in the definition of Evans et al can be performed through standard blood tests (CRP, Hb, albumin), EORTC QLQ-C30 (anorexia, fatigue) and analysis of body composition to quantify the SMM (muscle strength and lean tissue depletion). Cachexia is indeed characterised by loss of SMM but is not the same as sarcopenia.
BIA is a method commonly used to assess body composition by measuring individual RZ, XC and PA to calculate TBW, FFM and SMM. Only SMM is incorporated in both definitions whereas every single parameter resulting from the BIA measurement was demonstrated to be significantly different in the cachectic population according to Evans et al. Stratification according to Fearon et al could not demonstrate any XC or PA changes. Determination of body composition has not only added value to the diagnosis of sarcopenia but can be used as a predictor of chemotherapy toxicity and survival.21–23 Despite the fact that BIA might provide less information than imaging methods such as MRI and CT,21 its low cost and simplicity makes it clearly an opportunity to implement in clinical practice.18
Future directions: beyond the definition of Evans et al
Monitoring the nutritional health status of the patient with cancer using the criteria of Evans et al1 is highly recommended and creates the opportunity to assign the diagnosis of cachexia to the patient. During the past few decades, we have witnessed a dramatic increase in the understanding of the underlying pathophysiology of cancer cachexia. Different cytokines, such as IL-6 and TNF-α, are responsible for protein breakdown in SMM and play an important role in the aetiology of cancer cachexia.3 ,4 Also several hormonal abnormalities related to ghrelin, leptin and adiponectin have been reported in the setting of cancer cachexia.24 These hormones participate in body weight regulation by regulating food intake and energy homoeostasis.25–27 Disturbance of aforementioned humoural factors is the most common cause of a variety of clinical symptoms of cancer cachexia.9 It was noticed that none of these elements, except for systemic inflammation (ie, high CRP), are incorporated into the criteria according to Evans et al and that it would be valuable to explore if adding humoural factors would mean a surplus in the diagnosis of cancer cachexia. Moreover, in view of the current therapeutic approach, which targets the fundamental pathways involved in the pathogenesis of cancer cachexia,28 ,29 monitoring the humoural factors in daily practice would create the possibility to capture the diagnosis of cancer cachexia up close.
Conclusion
While the clinical decision-making in the management of cachexia as reported by Fearon et al is based on a consensus process of expert groups in oncology, it was demonstrated in this study that applying these criteria results in an over-rating of the assignment of patients to the diagnosis of cachexia. From the results based on our population, one can conclude that neither the weight loss nor the presence of sarcopenia in oncology patients is decisive for diagnosing cachexia. Other key factors that guide the clinical decision-making must comprise the evaluation of the underlying mechanisms of cachexia. Understanding the causes of cachexia sheds light on the subsequent need for a multimodality approach to diagnosis and also treatment of cancer cachexia.
This means, next to specialised nutrition support based on monitoring anthropometric values (body weight and BMI), also biological values reflecting abnormal biochemistry and body composition measurements must be combined. This is reflected in the criteria applied by Evans et al and creates the opportunity to assign the diagnosis of cachexia to the patient more accurately in order to outline the treatment possibilities.
Therefore, we propose that oncology patients should be identified first for recognition of either malnutrition or starvation. To this end, the NRS seems to be more easily applicable and has gained acceptance in European regions. As NRS is already validated for hospitalised patients at admission, further analysis in this study population could offer perspectives in validation for ambulant setting.
Second, standard blood tests should be evaluated for the presence of multiple factors characterising cachexia such as high CRP, low Hb or low albumin. Next to this the implementation of BIA in daily clinical practice is an opportunity to assess sarcopenia at low cost and to analyse additionally the total body composition as secondary elements having significant meaning for patients with cachexia. In future, the value of adding humoural factors the diagnosis of cancer should be explored more deeply.
Acknowledgments
National Cancer Plan (Initiative 37) from the Belgian Federal Ministry of Social Affairs and Public Health financed this project. The Multidisciplinary Oncology Centre Antwerp (MOCA) and the Tumor bank based at the University Hospital Antwerp (UZA) coordinated the multicentric pilot study.
References
Footnotes
MvdW contributed equally.
Contributors GV and MvdW provided the medical writing describing the scientific research results. KW performed the statistical analysis. GV, MvdW, KJC and KW were involved in interpretation of data for the work. LB, CVa, SK, SS, HV, ED and LC performed all clinical assessments of nutritional status and muscle strength of the patients. SDK, CVe, MV and SL were involved in patient inclusion and daily support. BDW and VDV were responsible for the analysis on the blood samples in the department of clinical biology. PP and ADW were involved in central biobanking and pathology analysis. KJC and LDC were involved in multicentric coordination. PA provided administrative support. DB, AT, TR and MP provided local coordination as principal investigator. KM provided psychology support for patients. LVG and DY were coordination nutrition team. MP, KJC, DB, AT, TR and BDW provided substantial contributions to the conception or design of the work. All authors were involved in revising it critically for important intellectual content. MP provided final approval of the version to be published.
Funding National Cancer Plan of the Federal Public Service Social Security (Belgium; grant number (KP_CA_37).
Competing interests None declared.
Patient consent Obtained.
Ethics approval Ethical Committee.
Provenance and peer review Not commissioned; externally peer reviewed.
Data sharing statement No additional data are available.