Article Text

Abstract
Objectives Antithrombotic drugs (ATDs) cause non-variceal upper gastrointestinal bleeding (NVUGIB). Risk scoring systems have not been validated in ATD users. We compared Blatchford, Rockall and Charlson scores in predicting outcomes of NVUGIB in ATD users and controls.
Methods A total of 2071 patients with NVUGIB were grouped into ATD users (n=851) and controls (n=1220) in a single-centre retrospective analysis. Outcomes included duration of hospital admission, the need for blood transfusion, rebleeding requiring surgery and 30-day mortality.
Results Duration of admission correlated with all scores in controls, but correlations were significantly weaker in ATD users. Rank correlation coefficients in control versus ATD: 0.45 vs 0.20 for Blatchford; 0.48 vs 0.32 for Rockall and 0.42 vs 0.26 for Charlson (all p<0.001). The need for transfusion was best predicted by Blatchford (p<0.001 vs Rockall and Charlson in both ATD users and controls), but all scores performed less well in ATD users. Area under the receiver operation characteristic curve (AUC) in control versus ATD: 0.90 vs 0.85 for Blatchford; 0.77 vs 0.61 for Rockall and 0.69 vs 0.56 for Charlson (all p<0.005). In predicting surgery, Rockall performed best; while mortality was best predicted by Charlson with lower AUCs in ATD patients than controls (p<0.05). Stratification showed the scores' performance to be age-dependent.
Conclusions Blatchford score was the strongest predictor of transfusion, Rockall's had the strongest correlation with duration of admission and with rebleeding requiring surgery and Charlson was best in predicting 30-day mortality. Modifications of these systems should be explored to improve their efficiency in ATD users.
- ASPIRIN
- BLEEDING PEPTIC ULCER
- GASTROINTESTINAL BLEEDING
- GASTROINTESTINAL HAEMORRHAGE
Statistics from Altmetric.com
Introduction
Recent successes in lowering the incidence and mortality of non-variceal upper gastrointestinal bleeding (NVUGIB)1–3 are being challenged by two inter-related factors: the rising comorbidity of patients with NVUGIB and the increasing use of antithrombotic drugs (ATDs) for vascular protection.3–6 One key aspect in the management of NVUGIB has been the use of risk scoring systems. These were originally devised in order to identify patients who do not require hospital admission at the time of initial presentation;7 ,8 subsequently, they have been used for the prediction of outcomes of NVUGIB.1–10
The Blatchford and the Rockall scores are the most commonly used risk scoring systems in NVUGIB worldwide.1–10 Likewise, the Charlson score is the most established system in the assessment of comorbidity and the prediction of mortality in a wide range of conditions including NVUGIB.2 ,4–6 ,11 However, these three systems have not been validated in patients using ATDs.1–11
Given the rising comorbidity and use of ATDs, we aimed to assess and compare the performance of Blatchford, Rockall and Charlson risk scoring systems in the prediction of outcomes of NVUGIB in the presence or absence of ATDs.
Methods
Design
This was an observational and controlled assessment and comparison of the performance of Blatchford, Rockall and Charlson risk scoring systems in predicting the outcomes of patients presenting with NVUGIB, 2005–2011, to a single centre in Southwest Scotland, University Hospital Crosshouse, affiliated to University of Glasgow.
Definitions
Upper gastrointestinal bleeding (UGIB), as previously described, included haematemesis, melaena or both.2 ,4–6 Haematemesis meant the vomiting of fresh or altered (coffee-ground) blood. Melaena, black tarry stools, and frequently associated with a rise in blood urea level, was considered of upper gastrointestinal origin, particularly in the presence of upper gastrointestinal endoscopic abnormalities. UGIB was considered as non-variceal in nature (NVUGIB) in the absence of portal hypertensive gastropathy, gastric and oesophageal varices.2 ,4–6
Rebleeding was defined as recurrent haematemesis, passage of further fresh melaena, continuing or recurrent hypotension and/or tachycardia ±fall in haemoglobin level after the first endoscopy.1 These events were managed with intravenous fluids, blood transfusion, endoscopic haemostasis, intravenous proton-pump inhibition, temporary reversal of anticoagulation or surgical intervention, as appropriate. Patients with rebleeding were managed in a high-dependency bed.
Blood transfusion in this article refers to red blood cell transfusion that has been initiated within 24 hours and completed within 3 days of acute UGIB. The decision to transfuse or not was taken by emergency room or acute medical unit staff, using their assessment of the patient's condition in accordance with local transfusion policy and with nationally agreed guidelines, as previously described.6
Proton-pump inhibitors were given to heal non-variceal ulcer/erosive lesions as an intravenous infusion for 72 hours in those with stigmata of recent bleeding particularly if endoscopic haemostasis was carried out; alternatively, they were given orally in stable patients.
ATDs include both antiplatelets and anticoagulants, that is, low-dose aspirin (75–325 mg/day), clopidogrel, dipyridamole, low-molecular weight heparin and warfarin.
Risk scores
The Blatchford, complete Rockall and Charlson scores4 ,7 ,8 ,10–12 are described in our online supplementary tables S1–S3. Regardless of whether they were calculated at the time of presentation or not, all three scores were recalculated by two investigators (CMcC and TC), who standardised their interpretation of data, using baseline clinical details available in the individual patient's case notes.
Supplementary tables
Composite upper gastrointestinal endoscopy score
By definition, NVUGIB originates from the oesophagus, stomach and/or duodenum; and the most common lesions are ulcers and/or erosions particularly in users of non-steroidal and ATDs.13 ,14 To facilitate the reporting and statistical comparison of these abnormalities, the following composite upper gastrointestinal (UGI) endoscopy score was devised: all normal, 0; erosive oesophagitis, 1; gastric erosions, 1; duodenal erosions, 1; gastric ulcer, 2; duodenal ulcer, 2; total score (sum of the above) range 0–7. This composite score was validated in a previous study.14
Outcomes
The Blatchford, Rockall and Charlson scores were compared in respect of their performance in predicting the following outcomes: duration of hospital admission; the need for blood transfusion; rebleeding requiring surgery and 30-day mortality.
Sources of data
As per the standard practice of our community care physicians, all patients with UGIB are referred to our hospital for assessment and management.2 ,4–6 Patients were, therefore, identified from hospital records. Their diagnoses and codes are according to the International Classification of Diseases (ICD-10) for bleeding gastrointestinal disorders. The clinical details and outcomes of patients presenting with overt UGIB were collected for 7 calendar years: 2005–2011.
Verification of data
In this analysis, the clinical details and outcomes were reviewed by three investigators (CMcC, TC and AST), who standardised definitions and compilations of the relevant data, thus keeping interobserver variation to a minimum. A similar standardisation process was implemented in previous works.2 ,4–6
Statistical analyses
Characteristics of the groups were compared using the Mann–Whitney test for continuous variables and Fisher's exact test for binary variables. Continuous variables were reported as median (IQR). For the composite endoscopic score the mean and SD were additionally reported because the quartiles did not reflect the significant difference between the groups in the distribution of values. The performance of the three risk scores in predicting outcomes were expressed as Spearman rank correlation coefficients (Rs) for length of admission and area under the curve (AUC) values for the receiver operating characteristic (ROC) curves for the binary outcomes transfusion, surgery and death. These performance statistics were compared between ATD patients and non-ATD controls using z-tests, after Fisher's transformation in the case of Rs values. Comparisons of different risk scores in a given set of patients were performed using the methods of Meng et al15 for Rs values and DeLong et al16 for AUC values. Statistical significance was defined as p<0.05. SPSS 15.0 for Windows (Chicago, Illinois, USA) was used for all analyses.
All clinical tests and treatments were in line with standard medical care at our institution. No allocation to treatment groups took place, but patients' identities were concealed by using code numbers. The work was approved and supported by the institutional Clinical Effectiveness and Governance Team of National Health Service Ayrshire and Arran, Scotland.
Results
Demography
A total of 2071 patients with NVUGIB from 2005 to 2011 were grouped as follows: ATD group (N=851) and controls, that is, patients not using ATDs (N=1220). As mentioned above, ATDs included both antiplatelets and anticoagulants: none of these were taken by the control group. Table 1 shows the demographic details of the two groups. They were both comparable in gender, but patients in the control group were younger and included more smokers and alcohol drinkers. The ATD group had greater proportions of patients with vascular diseases, higher risk scores, longer stay in hospital and greater need for transfusion. The values for the length of stay and number of units transfused shown in table 1 exclude non-admitted and non-transfused patients, respectively.
Demographic details of patients presenting with non-variceal upper gastrointestinal bleeding while using antithrombotic drugs (ATD group) and those not using these drugs (control group)
Drug use
By definition, ATDs were not taken by the control group. In the ATD group (N=851), 589 patients (69.2%) took low-dose aspirin (75–325 mg/day), 216 (25.4%) took clopidogrel, 53 (6.2%) took dipyridamole, 135 (15.9%) took warfarin and 25 (2.9%) received dalteparin.
In the ATD group also, 120 patients (14.1%) took non-steroidal anti-inflammatory drugs and 360 (42.3%) took proton-pump inhibitors, compared with 174 (14.3%) and 558 (45.7%), respectively, in the control group (N=1220).
Length of admission correlations
The length of admission was moderately well correlated with all three risk scores in non-ATD patients (controls), but these correlations were significantly weaker in ATD users. Rs (95% CI) control versus ATD: 0.45 (0.40 to 0.50) vs 0.20 (0.13 to 0.27) for Blatchford; 0.48 (0.43 to 0.52) vs 0.32 (0.26 to 0.38) for Rockall and 0.42 (0.37 to 0.46) vs 0.26 (0.20 to 0.32) for Charlson, all p<0.001. The Rockall score had the strongest correlation with length of admission and performed significantly better than Charlson in control patients (p<0.001).
Need for blood transfusion
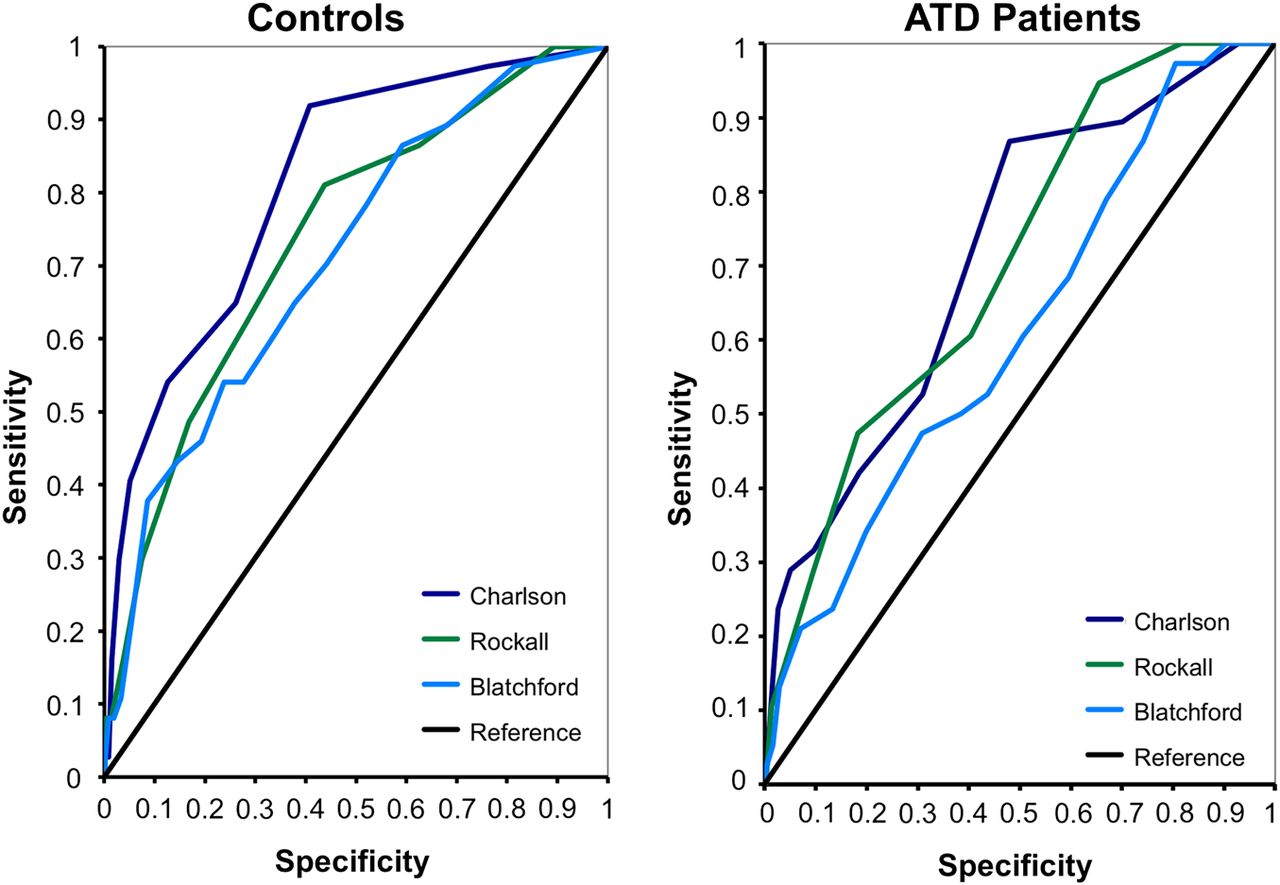
In predicting the need for blood transfusion (figure 1), all scores performed significantly less well in ATD users than in controls: AUC (95% CI) control versus ATD: 0.90 (0.88 to 0.92) vs 0.85 (0.82 to 0.88) for Blatchford; 0.77 (0.74 to 0.80) vs 0.61 (0.58 to 0.65) for Rockall and 0.69 (0.65 to 0.72) vs 0.56 (0.52 to 0.60) for Charlson, all p<0.005. The need for transfusion was best predicted by the Blatchford score (p<0.001 vs Rockall and Charlson in both ATD users and controls) followed by the Rockall (p<0.05 vs Charlson in ATD users, p<0.001 in controls).

Receiver operating characteristic curves for blood transfusion. The need for transfusion was best predicted by Blatchford (p<0.001 versus Rockall and Charlson in both antithrombotic drugs (ATDs) users and controls), but all scores performed less well in ATD users. Area under the receiver operation characteristic curve in control versus ATD: 0.90 vs 0.85 for Blatchford; 0.77 vs 0.61 for Rockall and 0.69 vs 0.56 for Charlson (all p<0.005).
Rebleeding, endotherapy and surgery
In predicting the need for surgery for rebleeding (figure 2) there was no significant difference in the performance of any of the risk scores between ATD users and controls. AUC (95% CI) control versus ATD: 0.62 (0.47 to 0.76) vs 0.61 (0.46 to 0.77) for Blatchford; 0.74 (0.63 to 0.86) vs 0.73 (0.59 to 0.87) for Rockall and 0.57 (0.43 to 0.71) vs 0.52 (0.39 to 0.65) for Charlson. The Rockall score performed significantly better than Charlson (p<0.05 in ATD users, p<0.01 in controls) and was the only one of the scores to perform better than by chance (ie, with an AUC significantly >0.5), as statistical power for this outcome was limited by the small number of events.

Receiver operating characteristic curves for surgery. In predicting the need for surgery, Rockall performed best, with similar area under the curve values in controls and antithrombotic drugs (ATD) patients for all scores: 0.62 vs 0.61 for Blatchford; 0.74 vs 0.73 for Rockall and 0.57 vs 0.52 for Charlson.
When rebleeding regardless of surgery was considered, this was thought to have taken place in 165/838 (19.7%) of ATD patients and 122/1190 (10.3%) of controls, p<0.001. The results of the ROC curve analysis for this endpoint were as follows:
AUC (95% CI) control versus ATD: 0.86 (0.83 to 0.90) vs 0.73 (0.69 to 0.77) for Blatchford; 0.76 (0.72 to 0.81) vs 0.57 (0.52 to 0.62) for Rockall and 0.68 (0.63 to 0.73) vs 0.54 (0.49 to 0.59) for Charlson, all p<0.001. These results look quite similar to those for transfusion of any amount as the endpoint, that is, Blatchford was much the best predictor.
However, when endoscopic therapy was considered (ATDs, 152/841 (18.1%) and controls, 78/1202 (6.5%), p<0.001), Rockall was best suited, probably as it involves endoscopic assessment.
30-Day mortality
The ROC curves for death are shown in figure 3. For all three risk scores there was a trend towards weaker predictive power in ATD users relative to controls, and this was significant for Charlson (p<0.05): AUC (95% CI) control versus ATD: 0.71 (0.63 to 0.79) vs 0.62 (0.53 to 0.71) for Blatchford; 0.78 (0.71 to 0.85) vs 0.72 (0.65 to 0.80) for Rockall and 0.84 (0.78 to 0.90) vs 0.73 (0.65 to 0.80) for Charlson. Differences in performance between scores were non-significant in both patient groups individually, but Charlson, the strongest predictor, significantly outperformed Blatchford, the weakest, when the groups were pooled (p=0.012).
Receiver operating characteristic curves for 30-day mortality. In predicting mortality, Charlson performed best, with lower area under the curve values in antithrombotic drugs (ATD) patients than controls: 0.71 vs 0.62 for Blatchford; 0.78 vs 0.72 for Rockall and 0.84 vs 0.73 for Charlson (p<0.05).
Patients' stratification and risk scores' performance
After the demographic data, online supplementary table S4 shows AUC values for ROC curves for the endpoints transfusion, surgery and death (each with the respective best-performing risk score), and Rs values (Spearman rank correlation coefficients) for length of stay and Rockall score. For each analysis, the first row shows the results already reported for the ATD and non-ATD groups as a whole, followed by results for younger and older age groups (<67 and 67+). The cut-off age of 67 is the first age quartile of the ATD group.
As shown in online supplementary table S4, all risk scores performed in an age-dependent manner, that is, worse in older than younger patients.
Discussion
This work has highlighted four main observations. First, in both ATD patients and controls, the Blatchford score was the strongest predictor of the need for blood transfusion, Rockall had the strongest correlation with duration of admission and with rebleeding requiring surgery and Charlson was best in predicting 30-day mortality. Second, there was a consistent tendency for all scoring systems to be less effective in predicting outcomes in ATD patients than in controls unless stratification for age is carried out. Third, patients presenting with NVUGIB while requiring ATDs have several important demographic and clinical characteristics that distinguish them from those not using these drugs. Fourth, and in light of these factors, modifications of risk scoring systems should be explored to improve their efficiency in users of ATDs.
Over the years, the management of NVUGIB has been facilitated by the advent and the use of risk scoring systems, particularly the Rockall and Blatchford scores.1–10 Since these systems were initially proposed in 1990s, the natural history of NVUGIB has evolved, with ATDs being among the most important factors in its aetiology.2 ,3–6 ,13 This explains our interest in having these systems validated in ATD users. Likewise, the comorbidity of patients with NVUGIB has been increasing: in fact, comorbidity is now believed to be the most important factor in the prognosis of NVUGIB.4 ,12 We chose to include Charlson score in our investigation as it has been the most comprehensive and most widely used measure of comorbidity since it was first proposed in 1980s.4 ,11 ,12
Looking at the individual components of the three risk scores, detailed in online supplementary tables S1–S3, might in part help understand their strengths or relative weaknesses in predicting NVUGIB outcomes. For example, both Rockall and Blatchford take circulatory shock into account by considering pulse and blood pressure levels at the time of presentation; this can explain their ability to predict the need for blood transfusion, with Blatchford being superior as it also includes baseline haemoglobin level. On the other hand, Rockall includes age, more comorbid conditions than Blatchford, and covers the endoscopic findings: this might explain its relative strength in predicting the length of admission and the need for surgical intervention. Also, Charlson has the most comprehensive list of comorbid conditions, which might explain its superiority in predicting 30-day mortality. While it might be interesting to look at their individual components in the above context, we believe it is still important to take each scoring system as a whole unit whenever it is considered.
We have observed that there was a consistent tendency for all scoring systems to be less effective in predicting outcomes in ATD patients than in controls, despite such scores being higher in the ATD group. We believe this could be explained by our findings related to the demographic and clinical characteristics of patients requiring ATDs. As shown in table 1, these patients are older and have higher proportions with cardiovascular and cerebrovascular diseases, hence their use of ATDs. They also have higher endoscopic scores, lower baseline haemoglobin levels, and are more likely to require transfusion and to stay longer in hospital, confirming the findings of a previous preliminary study.17 These differences highlight the need for these risk scores to be amended in ATD patients.
Stratification of patients showed that the performance of these scoring systems to be age-dependent, performing worse in older patients even in non-ATD users. This brings to the discussion the fact that Blatchford does not include age in its components.
The main weakness of this work is that it is observational. It is also a single-centre study and its generalisability remains to be seen. However, it is novel in being the first to assess and compare the efficiency of three established risk scoring systems in predicting the major outcomes of NVUGIB in both ATD users and a control group of patients not using these drugs.
In conclusion, we have demonstrated significant differences in the performance of Blatchford, Rockall and Charlson scores in NVUGIB. All these scores also tended to be less effective in ATD users, which highlights the need for their modification in such patients.
Key messages
What is already known on this topic?
Antithrombotic drugs (ATDs) are among the most common precipitants of non-variceal upper gastrointestinal bleeding (NVUGIB).
NVUGIB outcomes are related to comorbidity and have improved with the use of risk scoring systems.
Blatchford, Rockall and Charlson scores have not been validated in ATD users.
What this study adds?
ATD users have important clinical differences from those not requiring these drugs.
The three common risk scoring systems differed in predicting the major outcomes of NVUGIB, their performance being age-dependent and worse in older patients.
These systems tended to be less effective in predicting outcomes in ATD patients.
How might it impact on clinical practice in the foreseeable future?
NVUGIB risk scores should be amended to improve their performance in ATD users.
References
Footnotes
Contributors AST developed the idea of the project and wrote the draft manuscript. WJA carried out the statistical analysis. CMcC and TC collected and tabulated the data. All authors saw and approved the final version of the manuscript.
Competing interests None declared.
Ethics approval NHS Ayrshire and Arran Clinical Governance Team.
Provenance and peer review Not commissioned; externally peer reviewed.