Article Text

Abstract
Objective To determine trends in diagnosis of coeliac disease (CD) in patients attending a single centre 1958–2014 and provide figures for prevalence and incidence in those born in Derby city over 4 decades. To explore a link between deprivation and prevalence and characteristics of CD in Asians.
Design An unselected, consecutive series of 2410 adult patients with CD diagnosed in the catchment area of the Derby hospitals was identified. 1077 born within Derby city identified by postcodes was used to determine changes in prevalence and incidence over 4 decades. 191 patients were Asian. Population numbers were obtained from National Census information.
Results In the quinquennium 2010–2014, 20 times more patients were diagnosed than during 1975–1979. 27% were diagnosed at ≥60 years. A paucity of diagnoses in young men was observed. Women were diagnosed most often in age band ≥35<45, 15 years earlier than men. The largest increase in diagnosis rates occurred in young women and the elderly. In 2014, overall prevalence was 1:188; women 1:138. 4.6% of the variation was attributed to deprivation. Diagnosis rates in Asians increased markedly although only 5% were diagnosed at ≥60 years, much lower than for whites.
Conclusions The dramatic increase in number of patients with CD presents challenges for follow-up and new models of care need to be explored. Healthcare workers should be alert to the diagnosis in young men and elderly Asians. A dedicated coeliac clinic is an excellent facility to increase diagnosis rates.
- COELIAC DISEASE
- EPIDEMIOLOGY
- AUDIT
This is an Open Access article distributed in accordance with the Creative Commons Attribution Non Commercial (CC BY-NC 4.0) license, which permits others to distribute, remix, adapt, build upon this work non-commercially, and license their derivative works on different terms, provided the original work is properly cited and the use is non-commercial. See: http://creativecommons.org/licenses/by-nc/4.0/
Statistics from Altmetric.com
Summary box
What is already known about this subject?
▸ Coeliac disease (CD) is increasingly diagnosed.
▸ Diagnosis occurs at all ages.
▸ Asians are affected.
What are the new findings?
▸ In this study, robust figures for the above assertions are provided.
▸ A quarter of all cases are made at age ≥60 years but the diagnosis is uncommon in young men.
▸ The increase in diagnoses affects Asians but there is paucity in elderly Asians.
How might it impact on clinical practice in the foreseeable future?
▸ These results should stimulate a vigorous search for CD in the community especially among young men and elderly Asians where a gluten-free diet may transform lives.
▸ The high numbers now being diagnosed should stimulate finding new models for follow-up of patients and the establishment of dedicated coeliac clinics to optimise care.
Introduction
An early study from Derby of 567 patients with coeliac disease (CD) showed that an eightfold increase in diagnoses occurred between the quinquennia 1975–1979 and 1995–1999.1 A surprising finding was the mean age at diagnosis had risen with a marked increase in diagnosis rates in those over the age of 60 years. Twice as many women were diagnosed as men and the proportion presenting with non-specific symptoms rose dramatically through the study period while the number with diarrhoea declined; these features have been commented on in recent studies.2–4 A further investigation from Derby found that the number of diagnoses was eightfold higher in the quinquennium 2001–2005 compared with 1981–1985.5 Others have reported an increased prevalence of CD through the years in this country and abroad. A study of CD from Dorset, UK, covering the years 1993–2002 revealed an increase from 6 to 13.3 patients per 100 000 population over this period.2 A report from North America found an increase in prevalence from 11.1 per 100 000 person-years in 2000–2001 to 17.3 in 2008–2010 but only a small number of patients with CD was included.6 Another series from the USA found a fivefold increase in the prevalence of CD between 1999 and 2008 but only military personnel were considered.7 The frequency of CD for all ages almost tripled between the years 1995 and 2010 in the Netherlands.8 A rising incidence has been observed in children in Scotland.9 For the years 1990–1994, the incidence was 1.8 per 100 000 increasing to 11.7 for the period 2005–2009, a 6.4-fold increase. The increase due to screening was 11-fold, for non-classical presentations 16-fold and for classical presentations 4-fold. The latter increase was taken as indicating evidence of a true increase in CD through the years. In South Wales, a 15-fold increase was observed in a 28-year prospective study in children.10 Increases in children have been observed in Denmark11 and Estonia.12 A large study of CD and dermatitis herpetiformis (DH) employing the Clinical Practice Research Datalink (CPRD) between 1990 and 2011 and covering ∼4.5 million people (about 6% of the English population) distributed within 644 general practices and considered representative of the general population, found a fourfold increase in the incidence of CD in the UK over this 22-year period.4 A 4% annual reduction in DH was observed as reported by others.13 It was suggested that an early diagnosis of CD might lead to less DH. In 2011, the point prevalence for CD was 1:420 (0.24%) so many patients in the community are undiagnosed. The prevalence for DH was much lower at 1:3300. This equates to 150 000 people living with CD in the UK in 2011 and 19 000 with DH.
In Derby, a dedicated coeliac clinic was established in 1978 and a register compiled of all existing patients with CD. The register was kept up to date as new cases were discovered in the area served by the Derbyshire Royal Infirmary and the Derby City Hospital and recently the Royal Derby Hospital which replaced these two institutions in 2009. This register has made possible the present epidemiological investigation of CD with the aims of analysing trends in the diagnosis of CD over the years 1958–2014 in a single centre in Southern Derbyshire. The number of patients born in the well-defined geographical area of Derby city was determined to provide accurate, contemporary figures for prevalence and incidence of CD and how these have changed over four decades. Data from Derby city was used to explore if there is a relationship between social deprivation in the community and the prevalence of CD. Trends in the diagnosis of CD in the Asian community residing in Southern Derbyshire have also been ascertained.
Patients and methods
Coeliac register
CD was first diagnosed in Derby in an adult (≥15 years of age at diagnosis) by jejunal biopsy in 1958. In 1978, a register of patients with CD residing in Southern Derbyshire was established. Since 1978, patients have been collected prospectively and most reviewed in a dedicated coeliac clinic held weekly and run by the lead author (GKTH) who has kept the coeliac register up to date to the end of 2014. Information was stored on a Microsoft Access database.
Diagnosis of CD
The diagnosis of CD was based on characteristic appearances in small bowel biopsies, or the prevalence of endomysial antibody (EMA) or a level of transglutaminase antibody (TGA) >10 × the upper limit of normal (ULN).14 Transglutaminase antibody was measured with human recombinant transglutaminase as antigen (Celikey; Phadia GmbH, Freiberg Germany).14
Status of patients
The status of patients, living or dead, at the end of 2014 was determined using information held by the National Health Service (NHS) Strategic Tracing Service.
Catchment area of the Derby teaching hospitals NHS foundation trust
The Derby hospital's Southern Derbyshire catchment area is coterminous with the geographic boundaries of the NHS Southern Derbyshire and Erewash Clinical Commissioning Groups (CCGs). The English CCGs are built from Lower Super Output Area (LSOA) Census geographies of an average 2000 population. However, given the study period and that CCGs are relatively new organisations formed only in 2013, it was felt more appropriate to consider the denominator populations of the English Local Authority (LA) areas overlapping the same extent. The LAs included in this study and proportions of each based on ‘Southern Derbyshire’ LSOA coverage are Derby City Unitary Authority (100%), and Amber Valley (100%), Erewash (100%), South Derbyshire (100%) and Derbyshire Dales (38%) District Authorities. The Office for National Statistics (ONS) has published annual population denominators at a LA level for the entire study period. The denominator therefore comprises the total resident population aged 15 years and over in each LA apart from Derbyshire Dales, where only 38% of the population of the same age is included.
Deprivation
The English Indices of Multiple Deprivation (IMD) 2015 score, published at a LSOA geographical level, was used to determine the association between deprivation and diagnosis of CD using the cumulative number of diagnosed individuals also at a LSOA level. For each LSOA (n=147) making up Derby City, the number diagnosed to end of 2014 was divided by 15 years and over population residing in the LSOA. The result was divided to offer a prevalence rate per 1000 individuals in each LSOA in Derby. Within the statistical software SPSS, a Pearson correlation was applied to each LSOA instance of the prevalence rate and associated score of deprivation. The greater the IMD score the more deprived the area. A statistical summary was presented and is discussed in the results.
Populations of patients studied
The total number of patients on the coeliac register and those diagnosed in the Derby hospitals was ascertained at the end of 2014. For each of these a postcode was determined for their place of birth. For the analyses four groups of patients with CD were identified (figure 1).
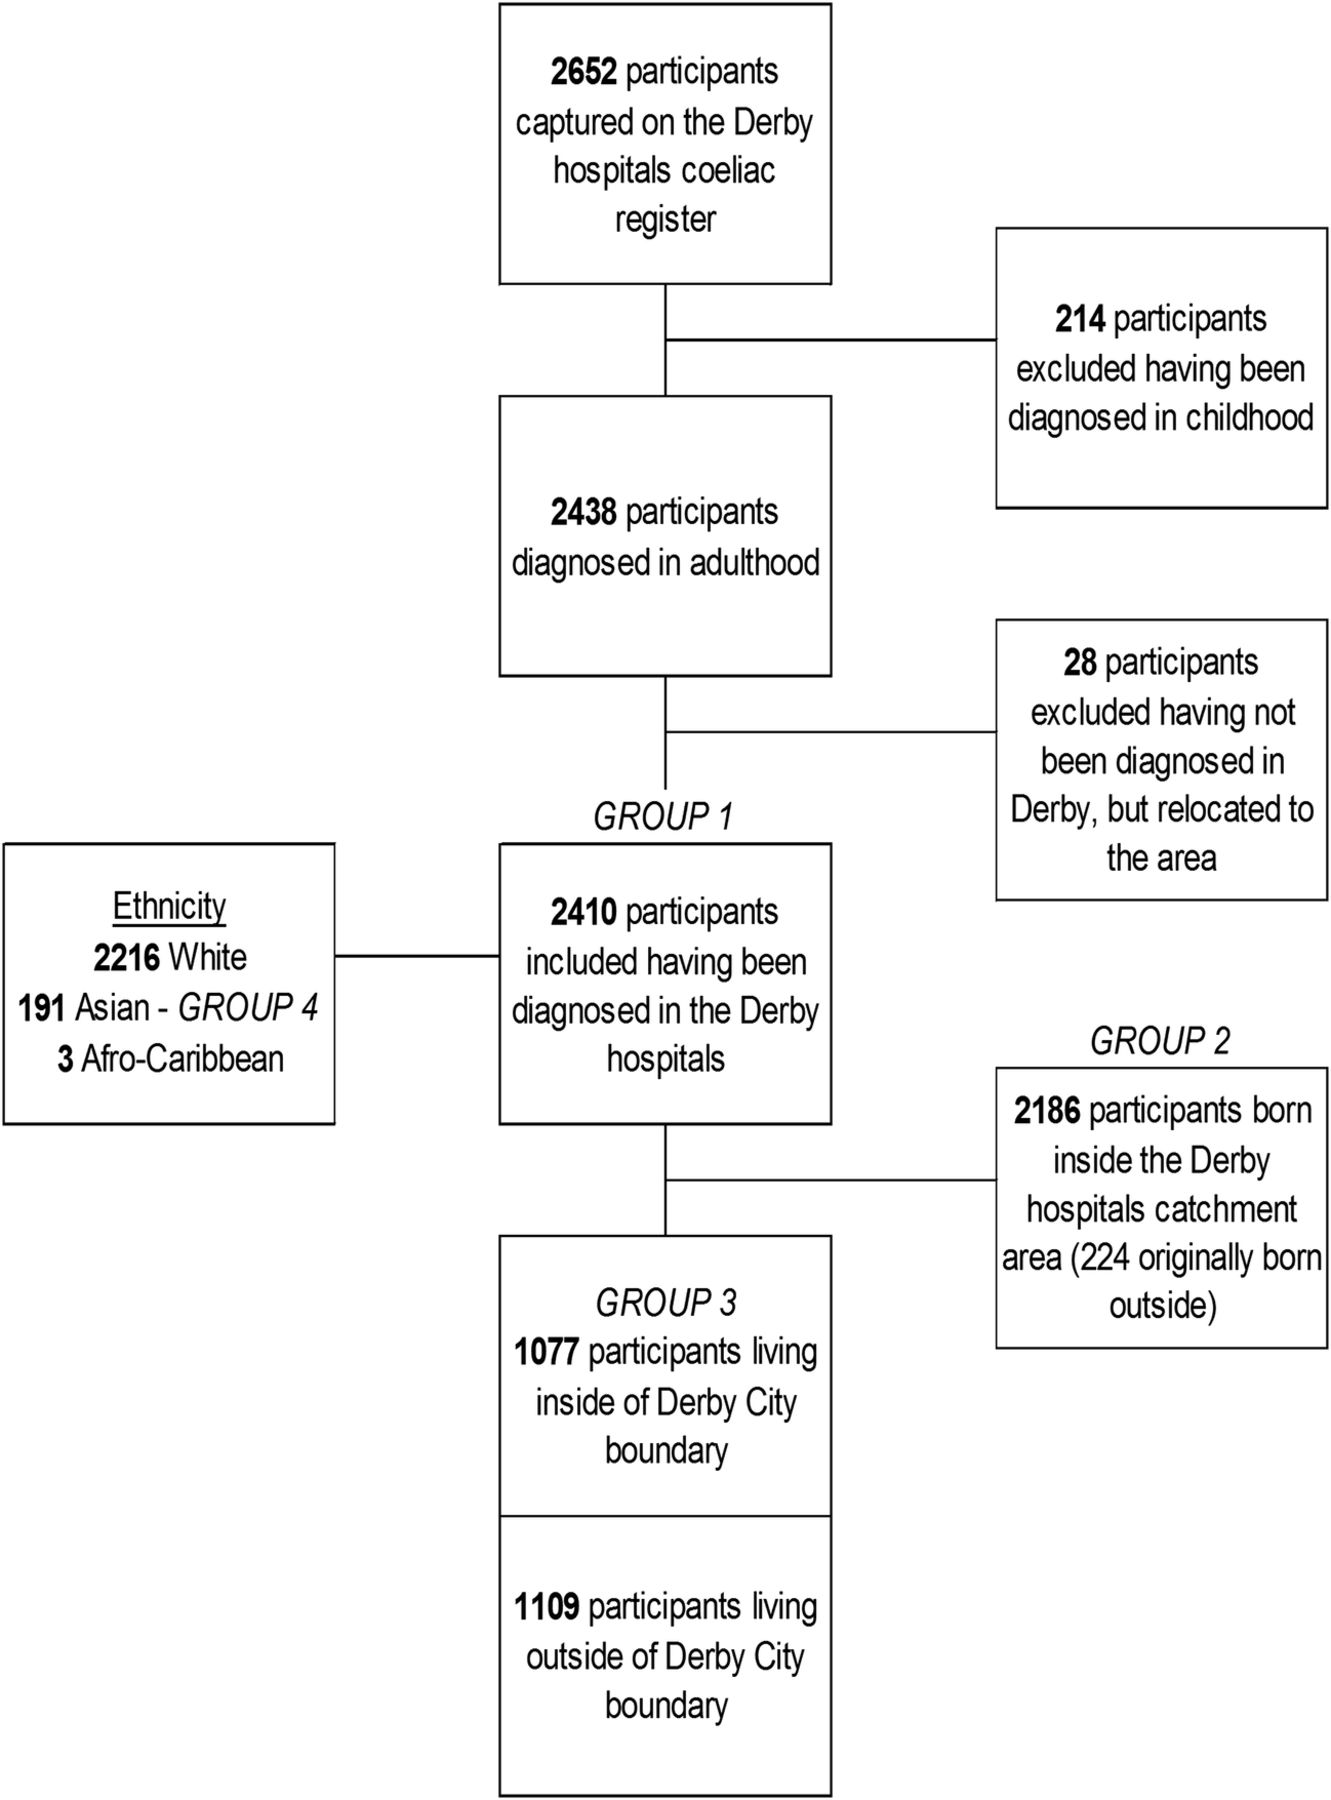
Summary of study populations.
Group 1: This group (2410) diagnosed in the Derby hospitals 1958–2014 was analysed to evaluate trends in diagnosis through the years in a single centre. Of these patients, 98.6% were diagnosed and followed up prospectively. The proportion diagnosed by biopsy or serology, age at diagnosis and the diagnosis in age bands for men and women was determined.
Group 2: This group (2186) born within the catchment area of the Derby hospitals was made up of two subgroups; those born within Derby city boundary (1077) and those born outside of Derby city but within the catchment area of the Derby hospitals (1109). It was initially envisaged to use this group to determine the prevalence and incidence of CD in a well-defined area but preliminary observations revealed that this approach was unsound (see Results section).
Group 3: This group (1077) born within the Derby city boundary was therefore analysed separately to obtain reliable data for prevalence and incidence. Owing to where Derby city is located in the wider catchment area and that it contains the hospitals, it is almost certain that patients born in this area will be diagnosed at the Derby hospitals making results for incidence and prevalence particularly robust. Analysis of this group was also undertaken to determine whether there is a link between social deprivation and the diagnosis of CD.
Group 4: This group was made up of Asian patients (191) diagnosed in the catchment area of the Derby hospitals and used to compare their characteristics with those of white ethnic origin (2216) diagnosed in the same area.
Population estimates
In order to obtain accurate denominator figures we used National Census data from four successive censuses and the individual mid-year published estimates in the interim periods split by gender and 5-year age bands for the age group in the scope of this study for the areas of Southern Derbyshire under consideration—Derby city, Amber Valley, Derbyshire Dales, Erewash and South Derbyshire. Numbers were obtained for each of these areas for all participants aged 15 years and over at the diagnosis of CD and for three age ranges: 15–34, 35–59 and 60 years or more. The denominator populations excluded those aged <15 years to give an accurate indication of prevalence for the specific age group in focus.
Results
Group 1
Frequency of diagnosis
The first diagnosis of CD by biopsy was made in Derby in 1958. Between 1958 and 1971 only eight diagnoses were made but since 1972 diagnoses have been made every year to a total of 2410 at the end of 2014 (figure 2). Serological diagnoses were first made in January 1996 and then with increasing frequency, until in the quinquennium 2010–2014, more were made by serology (361) than by biopsy (307) (figure 3). For the quinquennium 2010–2014, 20 times more patients (668) were diagnosed that for the years 1975–1979 (32).

Numbers per year for 2410 patients with CD diagnosed in Derby hospitals 1958–2014. CD, coeliac disease.

Diagnoses in Derby hospitals by biopsy (1689) and serology (721) in successive quinquennia for patients with CD. CD, coeliac disease.
Age distribution
Patients were diagnosed over a wide range of ages with 27% being 60 years or older, 20% 65 years or more and 4% 80 years or above (figure 4). For those cases diagnosed by biopsy or serology, these percentages were similar (table 1).
Percentage of patients diagnosed with coeliac disease by biopsy and serology at various ages

Age at diagnosis of CD in 2410 patients by biopsy (1689) and Serology (721) in Derby hospitals. CD, coeliac disease.
For the whole group, there is a steady increase in the number of diagnoses up to the age band ≥35<40 years followed by a decline to age ≥65<70 then a step change and continued decline to those aged over 90 years. For women the maximum number of diagnoses occurred in the age band ≥35<40 years, while for men this was seen later in the group aged ≥50<55 years (figure 5).
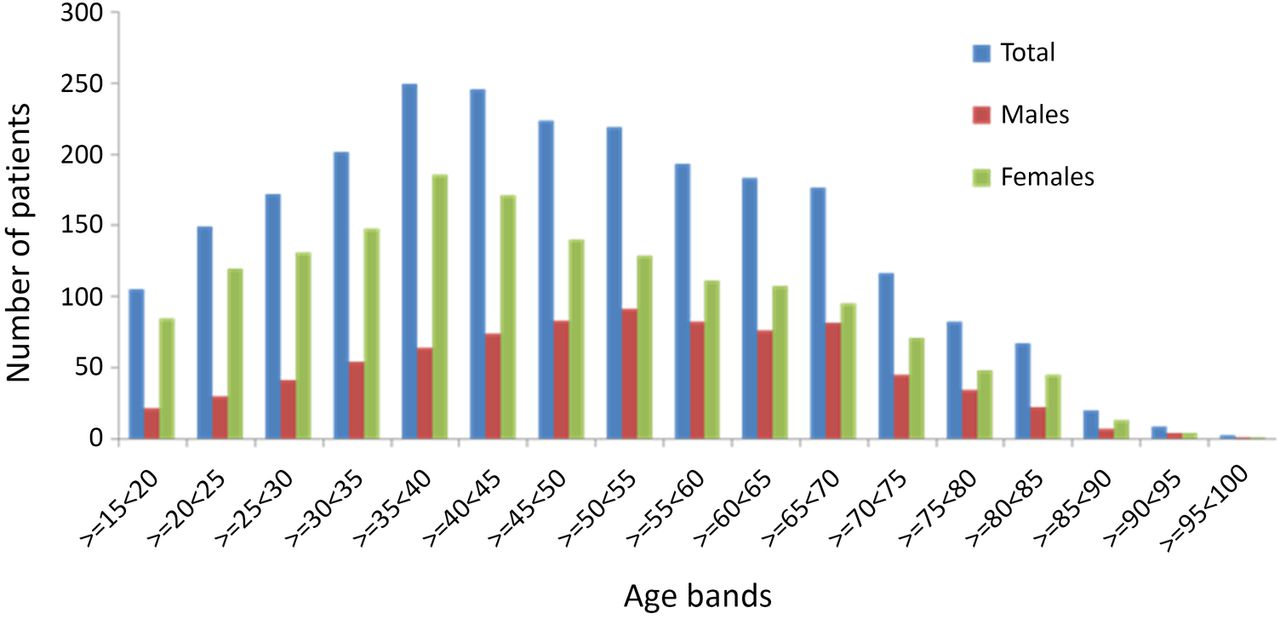
Diagnoses of 2410 patients with CD by biopsy (1689) and serology (721) in Derby hospitals in age bands. CD, coeliac disease.
Gender
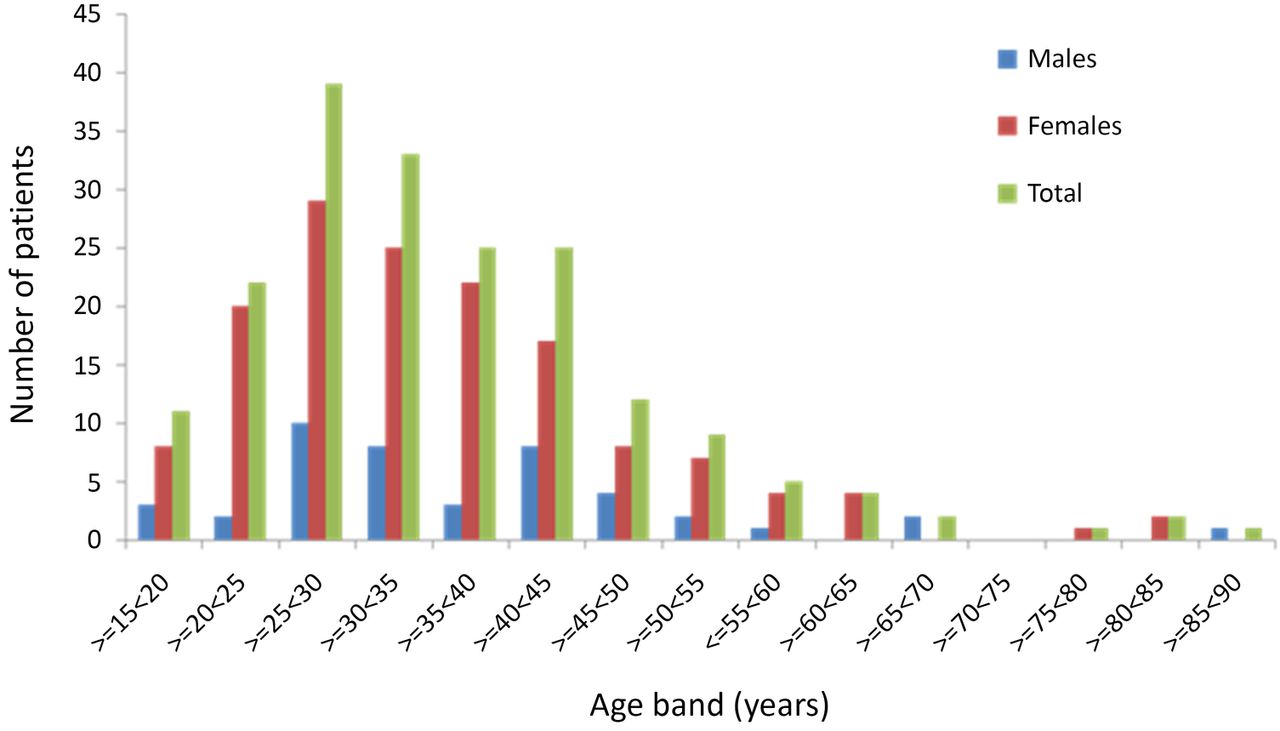
Of the 2410 patients, 1600 were women and 810 men (female to male ratio (F:M) 2:1). There is a paucity of diagnoses in young men. In the age band ≥15<20 years, F:M was 4:1 (figure 5). Only 92 (11%) of diagnoses in men were made in the age range ≥15<30 years compared with 334 (21% for women giving F:M of 3.6:1). This difference in diagnosis by gender diminishes in later years.
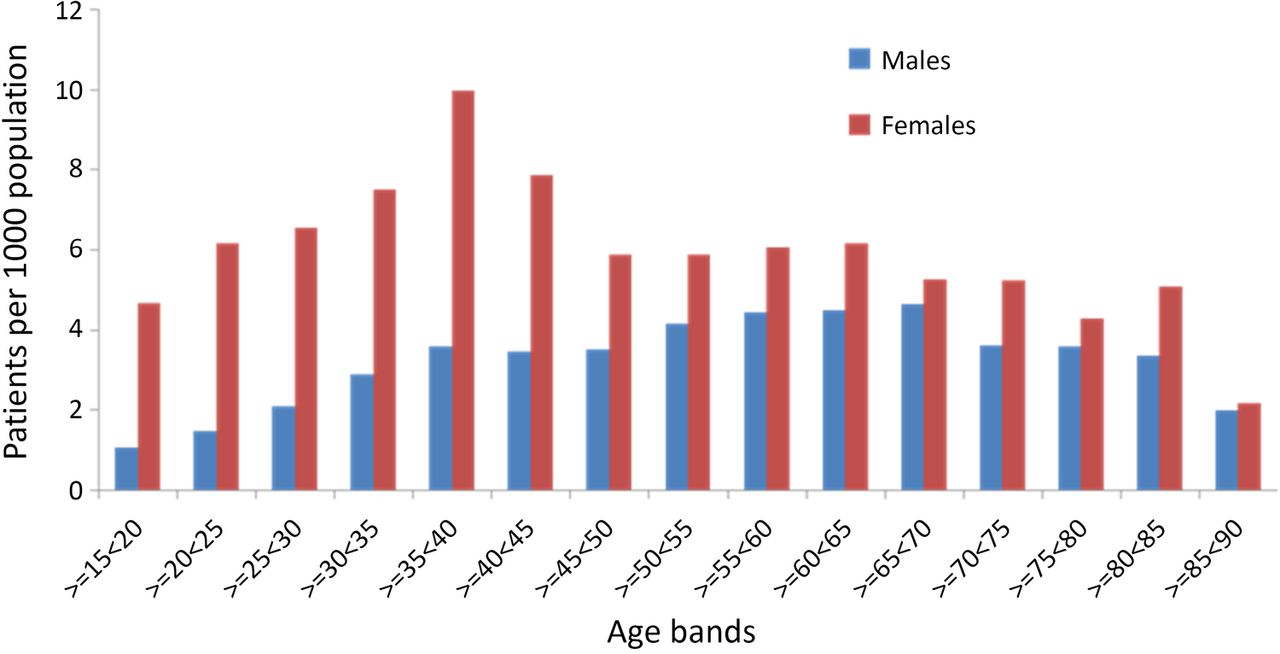
When the data are displayed as the number of diagnoses per 1000 of the population the paucity of diagnoses in young men is still evident and in the age band ≥15<20 years the F:M is 1:4.30 (figure 6). For the age group ≥15<40, F:M is 1:3.1. The maximum number of diagnoses for women is still seen in the age band ≥35<40 years, but for men there is more of a plateau effect that persists until very old age.

Diagnoses of CD per 1000 of the population for 2410 patients by biopsy (1689) and serology (721) in Derby hospitals by gender and age bands.
Group 2
When the prevalence and incidence figures were calculated for each of these two subgroups making up group 2, results for patients within the city boundary with regard to prevalence and incidence for all patients with CD and for those in the age ranges at diagnosis of 15–34, 35–59 and 60 years or over were in every instance greater than for those outside of the city boundary. The most likely reason for this is that patients on the borders of the catchment area, particularly those living in Erewash and South Derbyshire were diagnosed at other hospitals closer to their residences and hence lost to the study. This contention is supported by local patient flow data. The patient flow from Erewash to other than the Derby hospitals for outpatient purposes has been estimated at 42% and for South Derbyshire, 48%. In addition, the diagnosis rate of patients with CD in these two areas has been about 60% of the rate in those born and diagnosed in Derby city. It was decided that this total group outside of the city could not be used to generate accurate prevalence and incidence figures.
Group 3
The prevalence of CD in patients born in Derby city is shown in table 2. For the decade 1974–1984, the total prevalence was 1:4195 and for the last decade 1:367 an 11-fold increase. For men the increase was 9-fold and for women 13-fold. The largest increases were noted in young women and the elderly. Incidence data are shown in table 3.
Prevalence of coeliac disease in Derby city catchment area—for totals and age bands in years for males and females
Incidence of coeliac disease in Derby city catchment area per 1000 population—totals and age bands in years for men and women
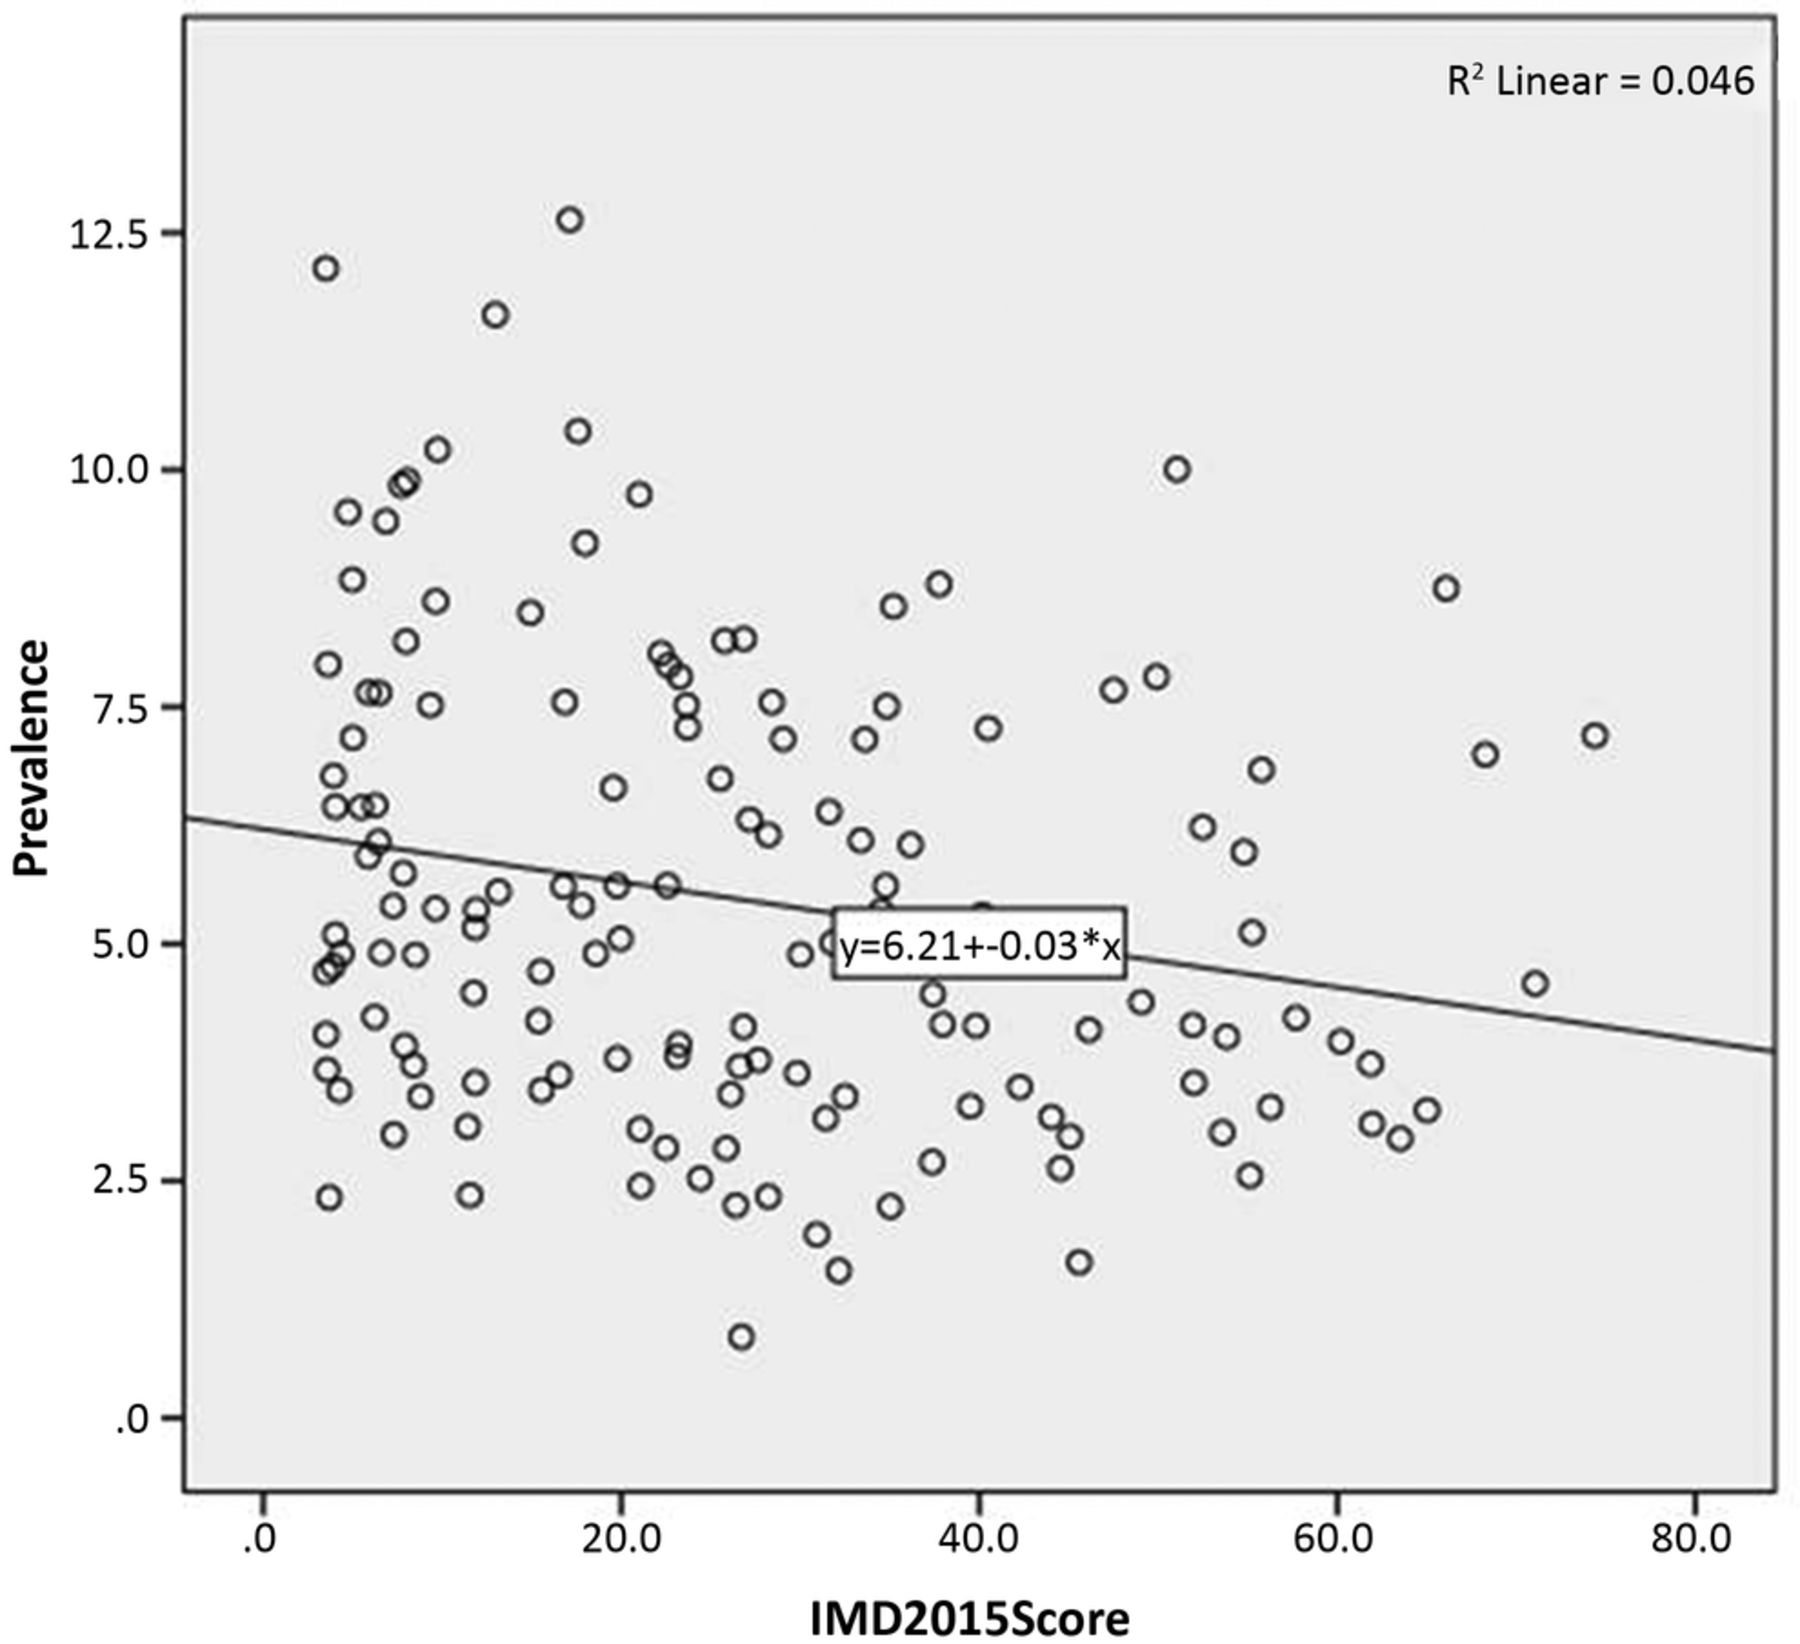
By using a sample size of 147 LSOAs in Derby, it was found that there is a relationship between the prevalence of CD and deprivation with a Pearson correlation of −0.214, p=0.009 (two-sided; figure 7). This indicates a significant, weak negative correlation. That is, the less deprived the area, the greater the prevalence of CD. The R2 value of 0.046 indicates that only 4.6% of the variation in prevalence can be attributed to deprivation.

Scatter plot of prevalence of CD and IMD by LSOA. CD, coeliac disease; IMD, Indices of Multiple Deprivation; LSOA, Lower Super Output Area.
The prevalence and incidence data for patients born in Derby city in mid-2014 are shown in table 4. The overall point prevalence is 1:188; for men 1:300 and for women 1:138. The overall incidence is 5.30/1000 of the population and for women 7.19/1000.
Prevalence and incidence per 1000 population of CD at mid-2014 in Derby city catchment area
CD in the Asian community
Group 4
Of the 2410 patients diagnosed in the Derby hospitals, 191 were Asian, 2216 white and 3 of Afro-Caribbean ethnicity. In the analysis, results for the 191 Asians have been compared with those for the 2216 whites.
Frequency of diagnosis
Through the years, the number of Asian adult diagnoses has increased rapidly (figure 8). For the quinquennium 1990–1994, there were only 5 but for the years 2010–2014 there were 72, a 14-fold rise. For the 2216 whites, 18 times more diagnoses were made in the past quinquennium that during 1975–1979.

Diagnoses in 191 Asians with CD in Derby hospitals in successive quinquennia.
Gender distribution
Of the 191 patients, 147 women and 44 men giving F:M of 1:3.3 which is more marked than for whites at 1:1.9.
Age at diagnosis
For the whole group of 191 patients, the peak age of diagnosis was in the age band ≥25<30 years and this was true for men and women (figure 9). For the 2216 whites, the maximum number of diagnoses for women was made in the age band ≥35<40 years and for men ≥50<55 years. These results accord with those for the 2410 patients in group 1. Young Asian men <30 years of age at diagnosis formed a higher percentage of total male diagnoses than for whites, 34% vs 10%. A similar trend was observed for young Asian women; 38% vs 19%. For Asian men, 52% were diagnosed below the age of 35 years; for women the figure was 56%. For white men and women the results were 16% and 27%, respectively. Only 5% of Asians were diagnosed at age 60 years or over compared with 29% for whites.

Diagnoses in 191 Asians with CD in Derby hospitals in age bands. CD, coeliac disease.
Discussion
The present study analysed 2410 consecutive, unselected patients with CD diagnosed at a single centre—Derby Hospitals—servicing an English city and county area from 1958 to the end of 2014. Patients identified by biopsy and serology are included (group 1). It is now well established that CD can be diagnosed reliably in a proportion of patients without small bowel biopsy. An investigation from Derby has shown that the result for TGA is 10×ULN for the test this equates to CD.14 In epidemiological studies, a positive EMA has been taken as evidence of CD.15 The 20-fold increase in diagnoses between the quinquennia 1975–1979 and 2010–2014 is higher than found in the previous two investigations from Derby1 ,5 and can be accounted for by the long study period and that since 1996 an increasing number of diagnoses have been based on serology alone.
Twice as many women than men were diagnosed, which has been observed by others4 and mirrors the result from a large screening study in the UK when it was found that of 87 positive EMA participants, 57 were women and 30 men giving F:M of 1.9:1.15 In the present study, a paucity of diagnoses in young men was found with only 11% of male diagnoses made below the age of 30 years compared with 21% for females. An American investigation produced similar figures of 9% and 19%.16 For women, the maximum number of diagnoses occurred 15 years earlier than for men. What could help to explain these gender differences which are also evident in childhood?9 ,10 Women are more prone to develop autoimmune diseases than men17 and women use healthcare facilities more than men so are more likely to be diagnosed with CD. It has been shown that women are more symptomatic than men,18 which may lead to more and earlier diagnoses. Men may delay presenting to healthcare professionals.19 It may be that young men are protected from developing CD perhaps because of interplay between sex hormones and the gastrointestinal microbiota. In rodents, it has been shown that this interplay increases the prevalence of autoimmunity in female patients.20 ,21 Whether giving gluten early in infancy promotes CD more in girls than boys is unresolved.22
CD is increasingly recognised in the elderly and in this series 27% of patients were diagnosed ≥60 years of age, a fifth ≥65 years while in 4% the diagnosis was delayed until the ninth decade. The proportions in these age groups diagnosed by biopsy or serology were similar. A study from Finland of 2815 individuals representative of the general population aged 52–74 years revealed the pooled frequency of biopsy proven and seropositive cases of CD was 69 (2.45%).23 Three years later, a rescreening of the series identified 7 more cases giving a final total of 76 (2.7%) patients with CD.24 The elderly do comply with and benefit from gluten-free diet,25 even those who are screening detected.26
If the results for Derby city are a true reflection of prevalence which is likely, then 1 patient is being diagnosed for every 188 aged 15 years and over in the general population, whereas the screening prevalence is 1 in a 100. These figures are close and mean that approximately for every two patients within the community one will be clinically diagnosed. These figures are even closer for women at 1:138. The rates of clinical diagnosis for men are slightly worse at 1:300. Based on these prevalence figures ∼279 000 patients with CD ≥15 years could have been diagnosed clinically in the UK as of 2014, of whom 234 000 would be alive. With a serological prevalence of 1% ∼524 000 individuals should be present in the UK population These results inform the structure of the coeliac iceberg particularly with regard to the ratio between diagnosed and undiagnosed patients with CD.27
Several groups have addressed the question whether there is a relationship between the prevalence of CD and socioeconomic status but reviewed results are conflicting.28 For example, in a study of children from South Wales, CD was more common in higher socioeconomic populations,29 and this was confirmed in a recent large study from the UK,28 but was not found in an investigation from Scotland.9 In a defined population in Southern England, CD was four times more common in children of manual than professional social classes.30 Studies from Sweden have also reported differing results.31 ,32 These differences are likely due to differences in populations of patients considered and study design. In Derby city, a significant negative correlation was found between deprivation and prevalence of CD, that is, the less deprived the area, the greater the prevalence, so that 4.6% of the variation in prevalence can be explained by deprivation. That failure to access medical services is the most likely reason for lower diagnosis rates in deprived areas, is supported by the fact that in places with similar seroprevalence for CD of about 1% there are marked differences in the incidence of CD per 100 000 person-years.4
To explain the effects of deprivation, the hygiene hypothesis has been invoked whereby it is proposed that children from lower socioeconomic backgrounds are more likely to be exposed to bowel infections that prime the gut to resist a subsequent antigenic stimulus from say gluten and so protects from acquiring CD. Children from Russian Karelia are exposed to more infections than those from Finland and experience less CD; 1:496 of the population in Karelia and 1:107 in Finland using the same diagnostic criteria.33 Helicobacter pylori appears to be an important pathogen in this regard.33 ,34 Children born by elective caesarean section and so not in contact with the microflora of the birth canal have an increased risk of CD while those born by emergency caesarean section do not.35 However, repeated infectious episodes in early life increase the risk of CD31 is inconsistent with the hygiene hypothesis.
It is remarkable that in an area with a major interest in CD and a dedicated coeliac clinic, established in 1978, an adult Asian with CD was not diagnosed until 1989 when 200 from the white ethnic population had been diagnosed. A dramatic 14-fold increase in diagnoses occurred through the years from the quinquennium 1990–1994 to 2010–2014. The F:M at 3.3:1 is more marked than for whites at 1.9:1 reflecting the relative small number of men being diagnosed.
An earlier publication from Derby focused on the epidemiology of CD in Asians and showed that CD occurs more commonly in Asians than their white counterparts which can be attributed to a higher prevalence in women 16 years and older and under 60 years of age.36 A full epidemiological analysis of Asians has not been undertaken in this new study because the ONS has not yet published population estimates by ethnicity beyond 2010. However, the data collected are informative. For all patients, only 10 of 191 (5%) were diagnosed at or over the age of 60 years. This is well below the corresponding figure of 29% for those of a white ethnicity. Whereas in this analysis 3 (7%) men were diagnosed over this age, the small numbers also extend to women, 7 of 147 (5%). That there is a dearth of CD diagnoses in elderly Asians is a concern. While CD may be unusual in this age group, it is unlikely and a better explanation is that for cultural reasons such patients are reluctant to discuss their health problems and suffer in silence. It is interesting that among a series of 353 Indian patients with CD diagnosed in New Delhi only 32 (9%) were diagnosed at the age of 50 years or more.37 For Asians, young men and women form a higher percentage of the diagnoses than for whites and the maximum number of diagnoses occurs at a younger age than for whites for men and women. It is possible that dietary factors may play a part in provoking these differences.38
While Asians with CD were well represented in this study only three patients from an Afro-Caribbean background were encountered among a population of ∼12 000 persons within the catchment area of the Derby hospitals and others have also commented on the rarity of the association.39 ,40
In conclusion, this explosion in the number of patients with CD being diagnosed as demonstrated in this study presents challenges for follow-up which is recommended to identify health problems or difficulties with adherence to gluten-free diet.41
References
Footnotes
Contributors GKTH collected the data, planned the study and had input in writing the paper. AM helped to process the data and had input in writing the paper.
Competing interests None declared.
Ethics approval This study was approved by the Confidentiality Advisory Group and the East Midlands—Derby Research Ethics Committee.
Provenance and peer review Not commissioned; externally peer reviewed.
Data sharing statement No additional data are available.