Article Text

Abstract
Objective To present comparative data about the performance of colorectal cancer (CRC) screening programmes in the European Union Member States (EU MSs).
Design Cross-sectional study. We analysed key performance indicators—participation rate, positivity rate (PR), detection rate (DR) and positive predictive value for adenomas and CRC—based on the aggregated quantitative data collected for the second EU screening report. We derived crude and pooled (through a random effects model) estimates to describe and compare trends across different MSs/regions and screening protocols.
Results Participation rate was higher in countries adopting faecal immunochemical test (FIT) (range: 22.8%–71.3%) than in those using guaiac faecal occult blood test (gFOBT) (range 4.5%–66.6%), and it showed a positive correlation (ρ=0.842, p<0.001) with participation in breast cancer screening in the same areas. Screening performance showed a large variability. Compliance with referral for colonoscopy (total colonoscopy (TC)) assessment ranged between 64% and 92%; TC completion rate ranged between 92% and 99%. PR and DR of advanced adenomas and CRC were higher in FIT, as compared with gFOBT programmes, and independent of the protocol among men, older subjects and those performing their first screening.
Conclusions The variability in the results of quality indicators across population-based screening programmes highlights the importance of continuous monitoring, as well as the need to promote quality improvement efforts, as recommended in the EU guidelines. The implementation of monitoring systems, ensuring availability of data for the entire process, together with initiatives aimed to enhance reproducibility of histology and quality of endoscopy, represent a priority in screening programmes management.
- colorectal cancer screening
- colorectal adenomas
- colorectal cancer
- colonoscopy
Statistics from Altmetric.com
Significance of this study
What is already known on this subject?
Cross-country comparative data about colorectal cancer (CRC) screening performance indicators are limited.
What are the new findings?
This is the first report presenting comparative data about performance of ongoing CRC organised screening programmes, using quality indicators recommended by international guidelines. Our analysis documented a large variability, which might result in potential variations in the future balance of benefits and harms of the programmes.
How might it impact on clinical practice in the foreseeable future?
These findings highlight the importance of regular data collection for monitoring and quality improvement purposes. Efforts aimed to promote reproducibility of histology, as well as the implementation of monitoring systems, ensuring availability of data about the entire screening process, represent a priority to improve comparability of the quality indicators.
Introduction
There is convincing evidence that screening can significantly reduce both colorectal cancer (CRC) incidence and mortality,1 and results from modelling studies suggest that CRC screening is a cost-effective intervention.2 Based on this evidence, several institutions and scientific organisations recommend the implementation of CRC screening to reduce the burden of disease. The Council of the European Union had urged already in 2003 the Member States (MSs) to introduce screening for CRC through a systematic population-based approach with quality assurance at all appropriate levels.3
Several effective screening options are available,4 and their expected cost-effectiveness ratio is dependent on several factors, including background risk, screening protocol, targeted age range, programme organisation and acceptability of the methods. The differential impact of these factors in different jurisdictions likely explains the observed variability in the screening policies adopted in different programmes.
Available data about the actual impact of screening recommendations, as well as of the different programmes policies are however limited.
The first report on CRC screening in the European Union (EU)5 presented descriptive information about the diffusion of screening programmes as well as about the adopted protocol and the organisation of screening delivery. It showed that population-based programmes in 2008 had been implemented in 12 MSs only and that most programmes were still in the early roll-out or pilot phase.
The survey conducted in the context of the ICRCSN network,6 covering 35 CRC screening initiatives all over the world (23 in Europe) and including established population-based programmes, pilots and research projects, reported information about screening protocol and implementation status. The lack of standardised definitions limited the interpretability of the screening performance data.
The CRC interest group, established in the context of the International Cancer Screening Network (ICSN), promoted an international survey aiming to collect quantitative data about screening participation using definitions based on a consensus document previously drafted by an experts panel.7 The requested data could be provided by 12 countries (9 European) using faecal tests for Hb, showing a wide variability in the participation rates and a trend towards a higher screening uptake among women than among men.8
Following the publication of the EU quality assurance guidelines on cancer screening,4 the EU Commission funded the second report on cancer screening programmes in the MSs.9 The aims of the report were to update the information about the status of implementation and level of organisation of screening programmes (for breast, cervical and colorectal cancer) in the MSs and to collect the necessary quantitative data to get, for each country, comparable estimates of the quality indicators of programme performance defined in the guidelines.
We are presenting the results of a comparative analysis of CRC screening performance across the EU MSs, based on the data collected in the second EU report.
Methods
The methodology of the preparation of the report and the information about the implementation status of CRC screening programmes in the EU and their organisation, including the management of invitations, have been described in two previous publications.10-11 Briefly, experts, with special knowledge in screening programme monitoring and evaluation, having access to the relevant information, as well as the mandate of the responsible national authorities to provide the requested information, were identified from each of the 28 MSs. They were requested to fill in an online questionnaire designed to capture the qualitative information on the programme policy, implementation status, type of test and screening protocol (positivity cut-off, number of tests and screening interval), organisation and quality control activities. Performance data were collected in Microsoft Excel tables, designed to collect aggregated data about the main indicators of screening performance described in the EU guidelines,4 stratified by age (5 year age groups), gender and, for programmes using faecal tests, screening history (initial and subsequent tests). The programme performance data were requested for the most recent year in which complete data were routinely available, which in the majority of cases was 2013. A user’s guide was provided including a description of the aims of the tables and of the necessary data, with the definition of the requested variables as well as of the indicators derived from each table. The authors checked the filled in questionnaires and the data tables, and the data providers were contacted to collect the missing data or to resolve the apparent inconsistencies.
We defined screening programmes as population-based only if the eligible target population in an area served by the programme were individually identified and personally invited to attend screening in each round of screening.
Coverage by invitation has already been reported in another paper,11 and we report here only data about coverage by examination, calculated (both for population and non-population based programmes) as the number of subjects undergoing a primary screening test in the reference year over the target population. To take into account the variability in the observed screening policies in different EU MSs, three definitions of target population were used: (A) the population aged 50–74 years (the widest recommended age range in most screening guidelines, as well as in the EU Council statement in 2003); (B) the specific age range targeted by the local programme protocol in each country; and (C) the target for the reference year, stipulated by country specific roll-out plans, or to the target population of pilot projects, or to the population of the regions having already started the roll-out phase. The EUROSTAT12 figures for the reference year were used for all countries for (A) and (B), while national statistics were used in some cases to estimate the target in the roll-out phase (or pilot programmes). Annual target population was calculated as the total target divided by the screening interval; birth cohorts were used in the case of endoscopy programmes offering screening once in the lifetime.
Participation rate was calculated (only for population based programmes) as the number of subjects personally invited for screening in the reference year who were screened by 30 June of the following year, over the total number of subjects personally invited in the reference year.
We also report data about positivity rate (PR), detection rate (DR) and positive predictive value (PPV) for adenomas, advanced adenomas and CRC. The denominator for these indicators was restricted to subjects with adequate samples (positive+negative tests) to ensure comparability of the results, as several programmes could not provide the information concerning the proportion of inadequate tests, or they could not provide these data stratified by age. The most advanced lesion per screenee was used to estimate the DR and the PPV. Tables 1 shows the definitions used for these indicators.
Definitions used for main performance indicators
Quantitative data about performance indicators will be presented separately for non-population-based and population-based programmes.
Data stratified by age, gender and screening history were available from nine MSs and seven regions (from four MSs) having implemented population-based screening programmes using faecal tests. The target age of 60–69 years was common to all these programmes; six (five using guaiac faecal occult blood test (gFOBT)) programmes were also targeting individuals aged 70–74 years and eight (five using FIT) included also individuals aged 50–59 years.
Descriptive data have been reported for PR, compliance with TC referral, completion rate of TC, DR of adenomas and CRC, as well as for PPV for advanced neoplasia: advanced adenoma + CRC (AN) by country/region and screening protocol; 95% CIs for the estimated indicators, measured as proportions, were derived assuming the binomial distribution. Overall estimates of the indicators of interest by age (50–54 years, 55–59 years, 60–64 years and 65–69 years) gender and screening history were calculated as pooled proportions with 95% CIs, using an inverse variance method (random effects model) to account for the variation between screening cohorts from different countries.
Associations between variables were assessed by the Pearson’s correlation coefficient.
Given the variability in the starting and stopping age and the unbalanced distribution of the two screening methods (FIT and gFOBT) in the youngest and oldest age groups, comparative analyses by country and screening test have been performed only among screenees in the age range 60–69 years. Restricting the analysis to this age group, targeted in all programmes, allowed to control for one of the main factors (ie, age) influencing the prevalence of neoplasia and therefore the outcomes of screening while including the information from all countries providing the relevant data.
First, we fit four separate random-effects models within each subset defined by the test (FIT and gFOBT) and screening history (initial=first screening test; subsequent=screening tests performed by screenees having already attended in previous rounds). We then combined the estimates and standard errors (SEs) from each model into a data frame, adding a variable to distinguish the two models in relation to the screening test and the estimated amounts of heterogeneity within each subset. We then compared the two estimates by applying a fixed-effects model, because the (residual) heterogeneity within each subset had already been accounted for by fitting random-effects model and using the variable screening test to distinguish the two estimates as a covariate; the test of the difference between the two estimates is a Wald-type test.
All statistical tests were two sided, and p value <0.05 was considered as statistically significant. We used the SAS software (release V.9.2) and R (V.3.4.1) for the analyses and to draw figures.
Results
Coverage by examination could be estimated for 21 out of 23 countries/regions having implemented a population-based organised programme; coverage by examination could be estimated for two out of four countries offering only opportunistic screening. Overall coverage for people aged 50–74 years was 14.0% (range: 0.5%–53.1%); the examination coverage of the population actually targeted by the established or pilot programmes was estimated as 16.2% (range: 0.6%–56.1%), reaching 18.2% (range: 0.6%–64.8%), when considering the planned target for the reference year in those countries where the programme was still in the roll-out, or pilot, phase. Examination coverage was 19.8% in population-based programmes over the entire 50–74 years target age range and 25.1% in the age range targeted by the programmes; it was 4.2% in non-population-based programmes, but this figure was underestimated, as several programmes could not provide data about the opportunistic screening activity (table 2).
Examination coverage in colorectal cancer screening programmes in the EU
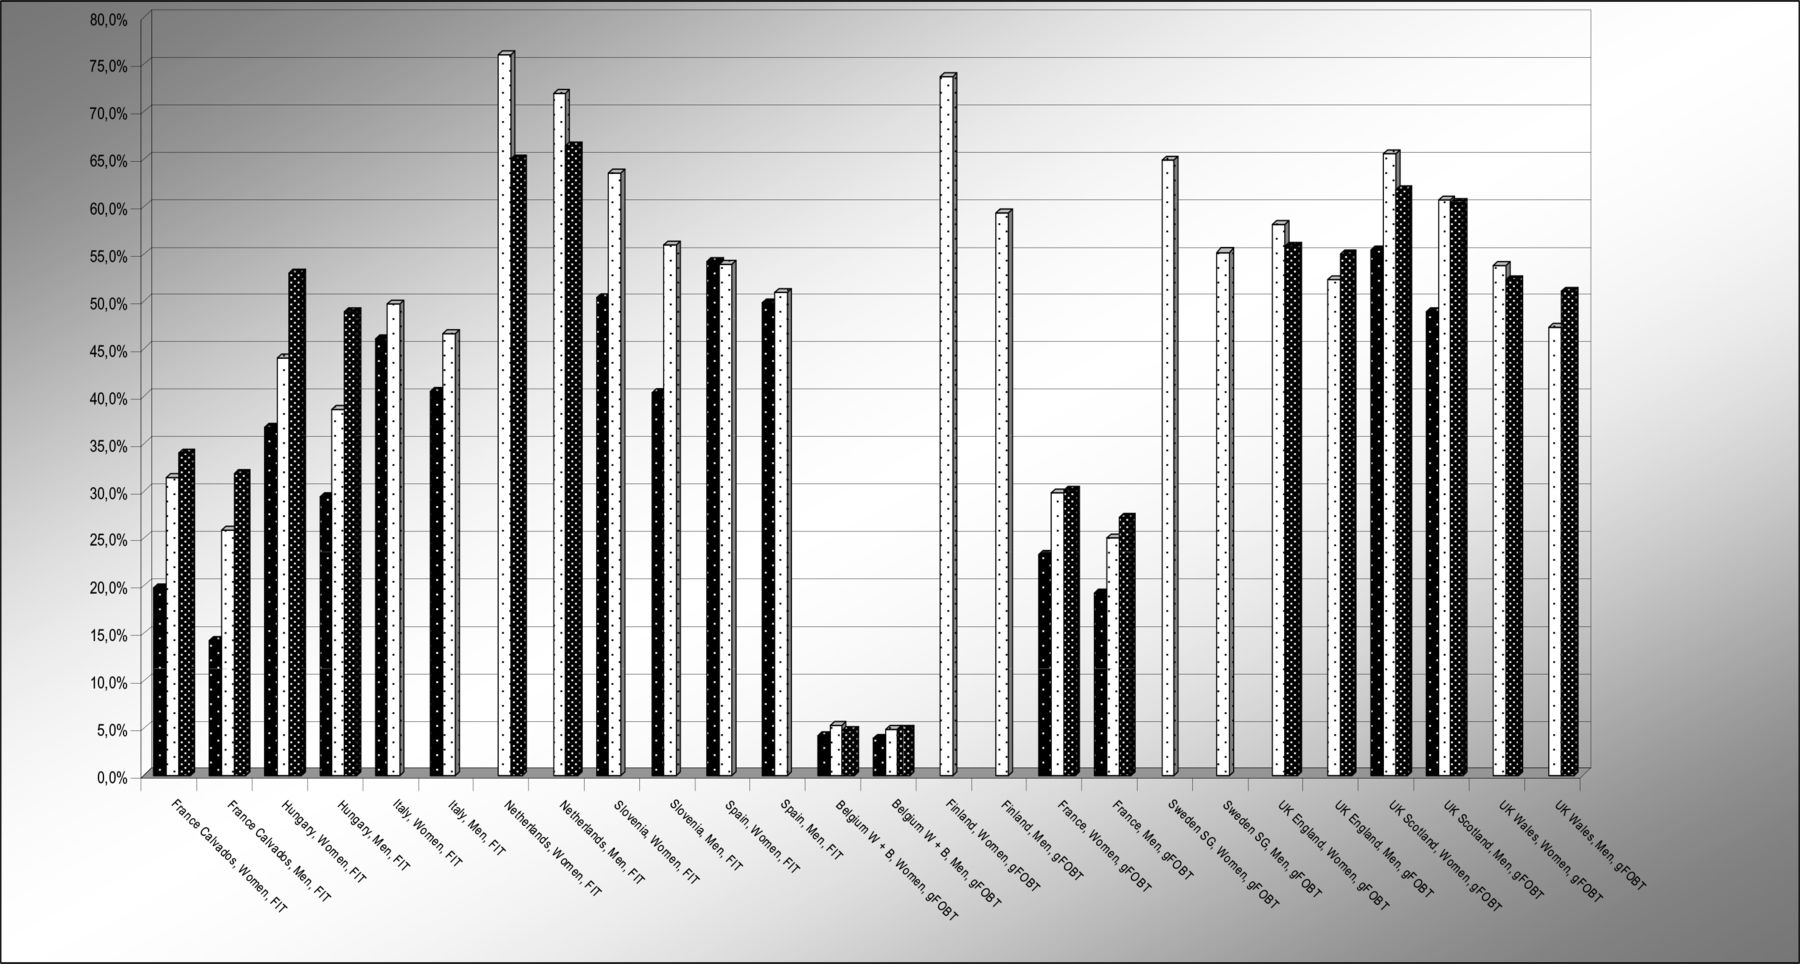
Data about screening uptake were provided by 12 MSs and 9 regions (Stockolm Gotland; Calvados; Piedmont; UK Wales, Scotland, Northern Ireland, England; Wallonia-Bruxelles; and Flemish region) from 5 MSs, all having implemented a population-based programme: 10 countries/regions had adopted FIT, 9 had adopted gFOBT, 2 were offering endoscopy screening once in the lifetime (one sigmoidoscopy: flexible sigmoidoscopy (FS), and one colonoscopy: TC). The overall participation (figure 1) was 49.5% (95% CI 49.5% to 49.6%; range: 22.8%–71.3%) in countries having adopted FIT screening and 33.2% among gFOBT programmes (95% CI 33.2% to 33.3%; range: 4.5%–66.6%). The desirable uptake rate in the EU Guidelines is >65%4: gFOBT uptake was higher than 50% in three Northern European countries, while it was below 25% in the remaining states; FIT uptake ranged between 36% and 71%. Independent of the type of faecal test adopted, participation was consistently higher, within all countries, among people older than 59 years, as compared with the younger age group, as well as among women as compared with men. Both overall participation rate (figure 2) (ρ=0.842, p<0.001) and the size of the difference in the uptake between women and men (ρ=0.611, p=0.0264) showed a strong positive correlation with the participation rate in breast cancer screening in the same areas.

Participation rate by gender, age and screening protocol programmes using faecal tests.

Association of participation in CRC screening and in breast cancer screening programmes using faecal tests. CRC, colorectal cancer.
The uptake was higher (24.5%, 95% CI 24.1% to 24.8%) among subjects invited for FS than among those invited for TC (15.7%, 95% CI 15.3% to 16.1%); men being more likely than women to respond to the invitation for endoscopy.
The regional FS programme in Italy adopted a sequential approach, offering FS, once in the lifetime, as primary screening test, and biennial FIT, as an alternative to those who refuse FS.13 Such strategy combining the two tests results in substantial increase in the population coverage (from 24% to 40% in the reference year) achieving a similar coverage among men as among women.
Screening performance indicators
Overall results – programmes using faecal tests
The average compliance with referral for assessment TC (table 3a) was 80.9% (range: 64.1%–92.2%) in the nine population-based programmes (seven countries; two regions) using FIT and 83.1% (range: 72.6%–89.4%) in the nine population-based programmes using gFOBT (six regions; three countries); the corresponding figure for the two non-population-based programmes providing the data was around 50%.
Positivity rate, compliance with TC referral and TC completion rate
The information about completeness of assessment TCs (table 3a) was provided by 12 population-based programmes (5 regions and one country using gFOBT; 4 countries and 2 regions using FIT): the average completion rate was 94.1% (range: 92.4%–98.8%) for programmes using FIT and 97.0% for programmes using gFOBT (range: 91.0%–97.6%). As expected, completion rates tend to be lower among women than among men (gFOBT programmes: 96.8% vs 97.3%; FIT programmes: 92.3% vs 95.1%).
A wide variability (table 3b) was observed in the DR as well as in the ratio of advanced to low-risk adenomas; the ratio ranging between 0.97 and 2.89 among FIT and between 0.09 and 1.69 among gFOBT programmes.
Detection rate of adenoma, advanced adenoma, CRC and positive predictive value for advanced neoplasia (advanced adenoma+CRC)
PR and DR of advanced adenomas and CRC (figure 3) were associated with gender, age, screening history and screening protocol: both among women and among men they were higher in programmes using FIT than among those using gFOBT and among subjects performing their first test in the programme, as compared with those having undergone previous test, showing a trend towards an increase with age, which was more pronounced in FIT-based programmes.

Positivity and detection rate of advanced adenomas and CRC by gender, age*, screening history and screening protocol programmes using faecal tests. *Only one country adopting FIT provided data for the 70–74 years age range, and therefore, we restricted the analysis to the age range 50–69 years. CRC, colorectal cancer; FIT, faecal immunochemical test; gFOBT, guaiac faecal occult blood test.
Information about screening performance indicators was provided by three non-population-based programmes using faecal tests (two FIT and one gFOBT), with only one of them reporting data about screening outcomes. Considering the 60–69 years age group, PR was higher than the EU average for population-based programmes, both with gFOBT (4.5% vs 2.0%) and with FIT (7.8%–8.0% vs 6.3%). The DR and the PPV were lower than the EU average for all outcomes considered (CRC, advanced adenomas and adenomas) among subjects aged 60–69 years in the only programme providing the information.
Descriptive data about quality indicators of performance of endoscopy programmes are reported in table 4. When considering the age range 55–59 years, targeted in both areas (although the invitation was restricted to subjects aged 58–59 years in the FS programme), the DR was similar with TC as with FS, both for CRC (3.4‰ vs 3.2‰ , OR: 0.96; 95% CI 0.82 to 1.12) and for advanced adenomas (5.0% vs 4.8%, OR: 0.96; 95% CI 0.52 to 1.80), while it was lower with FS than with TC for low-risk adenomas (7.5% vs 21.5%, OR: 0.30; 95% CI 0.27 to 0.33).
Colonoscopy completion rate and neoplasia yield – endoscopy programmes
The DR was similar for all outcomes considered (CRC, advanced adenomas and adenomas) in the TC opportunistic programme in the Czech Republic as in the population-based Polish programme in the age range 55–64 years.
Comparative performance data – age group 60–69 years
The PR was higher with FIT than with gFOBT both at the initial (gFOBT: 2.24%, 95% CI 1.77% to 2.84%; range: 1.8%–4.0%; FIT: 6.09%, 95% CI 5.22% to 7.09%; range: 3.3%–9.8%) and at subsequent screening (gFOBT: 2.02%, 95% CI 1.63% to 2.50%; range: 1.8%–4.0%; FIT: 4.28%, 95% CI 3.74% to 4.89%; range: 3.3%–9.8%) (Figure 4).

Positivity rate by country, gender, screening history and screening protocol. Programs using faecal tests – Age 60–69 Positivity cut-off (μg. Hb/gr. Faeces) – FIT programs: France:180; Italy, Spain: 20; Slovenia: 20 (2 samples); The Netherlands:15-47.

Detection rate of advanced adenomas by country, gender, screening history and screening protocol. Programs using faecal tests – Age 60–69 Positivity cut-off (μg. Hb/gr. Faeces) – FIT programs: France:180; Italy, Spain: 20; Slovenia: 20 (2 samples); The Netherlands:15-47.

CRC detection rate by country, gender, screening history and screening protocol. Programs using faecal tests – Age 60–69 Positivity cut-off (μg. Hb/gr. Faeces) – FIT programs: France:180; Italy, Spain: 20; Slovenia: 20 (2 samples); The Netherlands:15-47.
FIT programmes showed a better performance for the detection of CRC (figure 5) and advanced adenomas (figure 6) , both at initial and subsequent screening, as compared with those adopting gFOBT. The PPV for CRC was higher (5.5%; 95% CI 4.5% to 6.7%) in gFOBT-based programmes than in FIT-based programmes (3.7%; 95% CI 3.0% to 4.5%) among subjects with previous negative tests but not among subjects performing their first test in the programme (gFOBT: 7.6%; 95% CI 6.2% to 9.3%; FIT: 6.8%; 95% CI 6.3% to 7.3%); the PPV was higher with FIT than with gFOBT for advanced adenomas (data not shown). A lower prevalence both of CRC and advanced adenomas was observed among women than among men, but the overall trends were maintained also within each gender group. Although FIT programmes adopting a higher positivity cut-off level tended to show a lower PR and a lower DR of advanced adenomas, there was not a clear association of the positivity cut-off level with these indicators.
Discussion
This is the first report presenting comparative data about performance of ongoing CRC screening programmes, using quality indicators recommended by the international guidelines. Monitoring efforts have been implemented in most EU countries, and these results are confirming that quantitative data about screening activity from national, or regional, programmes can be provided in a standard format and that these data can be used to calculate indicators, based on the formulas defined in the guidelines, to ensure comparability of the results.
Quantitative data about screening performance indicators were not available from previous reports5 6 or were limited to data about participation rates.8 The authors of the ICSN report6 had concluded that the development of quality assurance protocols and indicators to allow commonly understandable results to be reported across all participants represented a priority for future monitoring efforts.
The overall findings of our analysis are consistent with available evidence from trials, or observational studies, assessing the impact of CRC screening strategies, although variability was still high across countries.
Consistent with available evidence14 15 indicating that the adoption of FIT is associated with a higher compliance, participation rates were, on average, higher among programmes using FIT, as compared with those using gFOBT. The observed differences across EU countries confirm that also other factors than the test itself are influencing screening uptake. The observed association of the uptake in breast and in CRC screening within each country would indeed suggest that cultural background, different perceptions on cancer screening and health services organisation are playing a major role. A higher awareness of the role of screening in reducing the burden of cancer likely explains the larger gender gap favouring women, when introducing FOBT programmes, based on the regular repetition of a preventive test, in those countries where participation in breast cancer screening is high.
Participation in a single invitation round is generally higher in programmes offering FIT/gFOBT, as compared with the those offering endoscopy screening.16 However, it should be considered that regular repetition of faecal tests is needed to achieve the expected protective effect, while a single FS, or TC, ensures a long-lasting protection to all attendees. Therefore, more appropriate comparison would require to estimate the cumulative adherence to gFOBT/FIT invitations over a time interval comparable with the duration of the protective effect of FS/TC.
As documented by comparative trials,17 18 colonoscopy referrals due to positive screening test, as well as DR of CRC, advanced adenomas and all adenomas were higher with FIT than with gFOBT, while PPV was higher with FIT than with gFOBT for adenomas but not for CRC. The choice of the positivity cut-off, in particular with FIT, as well as the background CRC incidence and/or the self-selection of subjects at different background risk, in countries reporting a low examination coverage, may contribute to explain the residual variability in the PR and DR across the EU countries, after accounting for age, gender, screening history and screening protocol. The observed impact of increasing the positivity cut-off level in the FIT-based Dutch screening programme19 is confirming that the choice of the cut-off value for a positive screening result has a strong influence on PR, PPV and DR values.
Also, on a single examination, the neoplasia yield was substantially higher in programmes using endoscopy than in those using FIT or gFOBT.20 21
Although the relevant information was provided only by 13 programmes, available data would suggest that the quality of the examinations was generally satisfactory, with a TC completion rate ranging between 92% and 99% and an adenoma detection rate (ADR) ranging between 39% and 61% in FIT-based programmes and between 12% (FS) and 28% (TC) in programmes adopting screening endoscopy. The ADR in FIT-based programmes is influenced by the age, gender and screening history distribution of the subjects examined in a given year, as well as by the positivity cut-off adopted in each programme. The national or regional average does not convey, however, information about the variability of the performance of individual endoscopists and endoscopy units. Such variability still represents a problem that needs to be addressed within each programme.
Of note, low compliance with the referral for further assessment seems still a key limitation for the effectiveness of many programmes. Indeed, the observed TC uptake among subjects with positive FOBT results was still below the recommended standards in several countries, although this finding might be partially explained, in some MSs, by incomplete information about the examinations performed outside the programme rather than by a high refusal rate.
However, although difficulties in retrieving and combining information from different sources (ie, screening test results and endoscopy databases) might play a role, the lack of information about screening outcomes of screenees with a positive test is likely related to persisting barriers limiting both data and patient’s flow across the interfaces between the different phases of the screening process, as a result of inadequate organisational and information technology (IT) infrastructure. Indeed, several countries could not provide data about the outcome of TC referral (including quality of the TC examination and histology results) or of treatment of screen-detected lesions. In particular, only two countries provided the requested information about management of patients with advanced adenomas and early CRC, which limits the scope of this survey for the evaluation of potential harms of screening, which could be associated with inappropriate surgical or endoscopy management resulting in undertreatment or overtreatment.
Although definitions of all required items were provided in the user’s guide, still variability in the classifications used in different countries might contribute to explain the differences in the programme performance. This seems to be the case for the DR and PPV of advanced adenomas: the observed variability in the ratio of advanced to all adenomas likely reflects the differences in the criteria adopted in different countries to classify these lesions rather than a difference in their incidence across EU countries.
Data on the implementation of screening were collected within the framework of publicly mandated programmes. Information about performance of opportunistic screening are limited: only two countries could provide PR and only one could provide data about compliance with assessment and histology results.
Data reported in this survey refer to a calendar period ranging between 2011 and 2014. Screening protocols have been modified and/or the roll-out phase has been completed in some participating countries in more recent years.10 Participation and coverage rates might have improved, following such changes, but it seems unlikely that the performance of the screening protocols might have changed over time. So we think that our comparative analysis of performance indicators still conveys valid and informative results.
In conclusion, quality indicators of CRC screening activity could be derived based on quantitative data collection, allowing comparative analyses of programmes performance. These findings are confirming the EU guidelines4 recommendation to implement organised population-based programmes, as opposed to opportunistic screening, as only organised programmes can be properly monitored. Programmes implementing systematic monitoring and comprehensive recording of screening activity can also use the collected information to intervene at an early stage to timely address deficiencies in quality.
Although the overall results are consistent with the expected trends, based on available evidence of effectiveness of established screening strategies, the analysis still revealed large variability in the quality indicators across organised population programmes, reflecting also potential variations in the balance of benefits and harms in the future.
The implementation of an organisational and IT infrastructure ensuring availability of accurate data covering the entire screening, assessment and treatment process, as well as the interfaces across these different steps, represent a priority to support systematic monitoring of screening performance and to improve completeness of available information. Efforts aimed at promoting the reproducibility of histology examinations would enhance the comparability of the quality indicators of screening outcomes. Assessing the possible reasons of the observed variability, beyond the adopted screening strategies, represents an opportunity to identify areas for improvement of programme performance and of the health impact of screening in the EU.
Acknowledgments
We are thankful to John F Ryan, Stefan Schreck, Antonio Montserrat and Paolo Guglielmetti at the European Commission for their support and guidance. We are thankful to the following scientific reviewers to the project: Lutz Altenhofen, Germany; Rosemary Ancelle-Park, France; Nieves Ascunce Elizaga, Spain; Harry J de Koning, The Netherlands; Elsebeth Lynge, Denmark; Ondrej Majek, Czech Republic; Florian Nicula, Romania; Julietta Patnick, UK; Jaroslaw Regula, Poland; Sven Tornberg, Sweden; and Marco Zappa, Italy. We are thankful to the following data providers to the project: Natasa Antoljak, Croatia; Ahti Anttila, Finland; Marc Arbyn, Belgium; Claire Armstrong, Northern Ireland; Nieves Ascunce Elizaga, Spain; Frank Assogba, France; Roger Black, Scotland; Luc Bleyen, Belgium; Josep M Borras, Spain; Andras Budai, Hungary; Karen Budewig, Germany; J B Burrion, Belgium; Michel Candeur, Belgium; Helen Clayton, UK; Carol Colquhoun, UK; Miriam Dalmas, Malta; Isabel De Brabander, Belgium; Harry de Koning, The Netherlands; Claire Dillenbourg, Luxembourg; Joakim Dillner, Sweden; Plamen Dimitrov, Bulgaria; Lajos Dobrossy, Hungary; Nicolas Duport, France; Klara Miriam Elfström, Sweden; Mara Epermane, Latvia; Josep A Espinas, Spain; Valerie Fabri, Belgium; Elisabeth Fasching, Austria; Patricia Fitzpatrick, Ireland; Jacques Fracheboud, The Netherlands; Andrew Gamble, UK; Alexander Gollmer GesundheitsOsterreich, Austria; Mat Goossens, Belgium; Clare Hall, UK; Annemie Haelens, Belgium; Francoise Hamers, France; Karin Heckters, Luxembourg; Sarah Hoeck, Belgium; Rugile Ivanauskiene, Lithuania; Urska Ivanus, Slovenia; Beata Janik, Poland; Natalja Jankovska, Latvia; Katja Jarm, Slovenia; Dorte Johansen, Denmark; Vanessa Kaab-Sanyal, Germany; Fofo Kaliva, Greece; Michal Kaminski, Poland; Eliane Kellen, Belgium; Beata Kinel, Poland; Stala Kioupi, Cyprus; Tatjana Kofol Bric, Slovenia; Attila Kovacs, Hungary; Theopisti Kyprianou, Cyprus; Radoslav Latinovic, UK; Marcis Leja, Latvia; Jolanta Lissowska, Poland; Anne Mackie, UK; Ondrej Majek, Czech Republic; Daniela Malek, Germany; Paola Mantellini, Italy; Kenneth McInnes, UK; Nuno Augusto Alberto de Miranda, Portugal; Vaida Momkuviene, Lithuania; Dinka Nakić, Croatia; Ondrej Ngo, Czech Republic; Florian Nicula, Romania; Dominika Novak Mlakar, Slovenia; Andrze Nowakowski, Poland; Pavlos Pavlou, Cyprus; Elena Perez Sanz, Spain; Davor Plazanin, Croatia; Maja Primic-Zakelj, Slovenia; Sarah Pringles, Belgium; Joseph Psaila, Malta; Alexandra Ramssl-Sauer, Austria; Dace Rezeberga, Latvia; Janet Rimmer, UK; Vitor Rodrigues, Portugal; Agnes Rogel, France; Guglielmo Ronco, Italy; Merete Ronmos Houmann, Denmark; Tytti Sarkeala, Finland; Astrid Scharpantgen, Luxembourg; Ana Lucija Skrjanec, Slovenia; Stanislav Spanik, Slovak Republic; Greig Stanners, UK; Barbara Stomper, Germany; Andrea_Supe Parun, Croatia; Esther Toes-Zoutendijk, The Netherlands; Sven Tornberg, Sweden; Maria Tsantidou, Greece; Zdravka Valerianova, Bulgaria; Heleen M E van Agt, The Netherlands; Piret Veerus, Estonia; Suzanne Wright, UK; Stephanie Xuereb, Malta; Jozica Maucec Zakotnik, National Institute of Public Health, Slovenia; Viaceslavas Zaksas, Lithuania; Marco Zappa, Italy; Raquel Zubizarreta Alberdi, Spain; Georg Ziniel, Austria; and Manuel Zorzi, Italy.
References
Footnotes
Contributors Design of the survey CS, PB, AA, AP, MT, GR, RS and NS. Data collection: MT, DBV, AP and PB. Data analysis: CS, ER and MT. Drafting of the paper: CS, AP, SL and NS. Review of the analysis and of the content: all authors.
Funding European Union Public Health Programme (scientific and technical support to the European Partnership for Action against Cancer and follow-up of the implementation of the Council Recommendation on Cancer Screening).
Competing interests None declared.
Provenance and peer review Not commissioned; externally peer reviewed.
Data sharing statement All data used for the analysis have been published in the EU screening report.
Correction notice This article has been corrected since it published Online First. Tables 3b and 4 have been amended.