Article Text

Abstract
Objective The sensitivity and specificity of a single faecal immunochemical test (FIT) are limited. The performance of FIT screening can be improved by increasing the screening frequency or by providing more than one sample in each screening round. This study aimed to evaluate if two-sample FIT screening is cost-effective compared with one-sample FIT.
Design The MISCAN–colon microsimulation model was used to estimate costs and benefits of strategies with either one or two-sample FIT screening. The FIT cut-off level varied between 50 and 200 ng haemoglobin/ml, and the screening schedule was varied with respect to age range and interval. In addition, different definitions for positivity of the two-sample FIT were considered: at least one positive sample, two positive samples, or the mean of both samples being positive.
Results Within an exemplary screening strategy, biennial FIT from the age of 55–75 years, one-sample FIT provided 76.0–97.0 life-years gained (LYG) per 1000 individuals, at a cost of €259 000–264 000 (range reflects different FIT cut-off levels). Two-sample FIT screening with at least one sample being positive provided 7.3–12.4 additional LYG compared with one-sample FIT at an extra cost of €50 000–59 000. However, when all screening intervals and age ranges were considered, intensifying screening with one-sample FIT provided equal or more LYG at lower costs compared with two-sample FIT.
Conclusion If attendance to screening does not differ between strategies it is recommended to increase the number of screening rounds with one-sample FIT screening, before considering increasing the number of FIT samples provided per screening round.
- Colorectal cancer screening
- cost-effectiveness
- cost-effectiveness analysis
- decision analysis
- faecal immunochemical test
- gastric cancer
- gastritis
- Helicobacter pylori
- multiple samples
- population-based colorectal cancer screening
- screening
This is an open-access article distributed under the terms of the Creative Commons Attribution Non-commercial License, which permits use, distribution, and reproduction in any medium, provided the original work is properly cited, the use is non commercial and is otherwise in compliance with the license. See: http://creativecommons.org/licenses/by-nc/3.0/ and http://creativecommons.org/licenses/by-nc/3.0/legalcode
Statistics from Altmetric.com
- Colorectal cancer screening
- cost-effectiveness
- cost-effectiveness analysis
- decision analysis
- faecal immunochemical test
- gastric cancer
- gastritis
- Helicobacter pylori
- multiple samples
- population-based colorectal cancer screening
- screening
Significance of this study
What is already known on this subject?
-
Two-sample FIT screening with referral for colonoscopy if at least one sample is positive provides a higher detection rate for advanced neoplasia than one-sample FIT screening.
-
However, this is at the expense of higher positivity rates and thus the need for more colonoscopies.
What are the new findings?
-
Within a given screening age range and interval, two-sample FIT screening provides additional LYG compared with one-sample FIT screening at acceptable costs.
-
Intensifying screening with one-sample FIT provides equal or more LYG at lower costs, compared with screening by means of two-sample FIT.
How might it impact on clinical practice in the foreseeable future?
-
In order to improve the effectiveness of their CRC screening programme, decision-makers are recommended to increase the number of screening rounds with one-sample FIT screening, before considering increasing the number of FIT samples provided per screening round.
In industrialised countries colorectal cancer (CRC) is the third most commonly diagnosed malignancy in men and ranks second in women.1 The majority of CRC cases are diagnosed later in life. Because life expectancy increases in many countries and the costs of CRC treatment rise rapidly, it is expected that CRC will place an increasing burden on national healthcare systems.
Screening for CRC and its premalignant lesions (ie, adenomatous polyps) can detect the disease at an earlier and more curable stage. Faecal occult blood tests (FOBT) have been developed to detect microscopic bleeding from colorectal neoplasms before there are any clinical signs or symptoms. At least three randomised controlled trials have proved the effectiveness FOBT screening, demonstrating a mortality reduction of 15–33%.2–4 Subsequently, several screening trials have confirmed the superiority of faecal immunochemical test (FIT) screening over the more traditionally used guaiac-based FOBT (ie, non-rehydrated Hemoccult-II test) both with respect to attendance as well as the detection rate of advanced neoplasia.5–11 Most of these trials used screening strategies with a single FIT sample.
As not all advanced neoplasia will be detected by means of one-sample FIT screening, providing two FIT samples collected on consecutive days could increase the effectiveness of a screening programme. On the one hand, referring a screenee for a diagnostic colonoscopy when at least one sample is positive increases sensitivity because some colorectal neoplasms bleed intermittently and can therefore be missed with one-sample FIT screening.12 On the other hand, referring a screenee when both samples are positive can increase specificity because only colonic lesions with a more consistent bleeding pattern will be detected, which will lead to fewer false-positive test results. However, either way, providing two FIT samples within one screening round will also increase screening costs because twice the number of samples need to be analysed.
The aim of this study was to evaluate the cost-effectiveness of one-sample and two-sample FIT screening strategies with variable intervals, age ranges and cut-off levels in order to assess whether the increased performance of a second FIT sample outweighs the increased costs compared with one-sample FIT screening.
Materials and methods
We used the MISCAN–colon microsimulation model to estimate the additional life-years gained (LYG) and costs of two-sample FIT screening over one-sample FIT for the screening strategy of biennial FIT from the age 55 to 75 years. This screening strategy has intermediate screening intensity and was previously found to be cost-effective.13 Additional LYG can also be achieved by increasing the intensity of one-sample FIT screening instead of adding a second sample. We therefore also compared the costs and LYG of one-sample FIT screening with that of two-sample FIT for a range of screening strategies.
MISCAN–colon microsimulation model
The MISCAN–colon model and the data sources that inform the quantifications of the model are described in detail in supplementary appendix 1, in previous publications,14–18 and in a standardised model profile available online only.19 In brief, the MISCAN–colon model simulates the relevant life histories of a large population of individuals from birth to death. CRC arises in this population according to the adenoma–carcinoma sequence.20 ,21 More than one adenoma can occur in an individual and each adenoma can independently develop into a CRC. Adenomas progress in size from small (≤5 mm) to medium (6–9 mm) to large (≥10 mm). Although most adenomas will never turn into cancer, some will eventually become malignant, transforming to stage I CRC and some may even progress into stage IV. In every stage, there is a probability of the CRC being diagnosed due to the development of symptoms versus symptomless progressing into the next stage. If CRC has developed, the survival rate after clinical diagnosis depends on the stage in which the cancer was detected. The 5-year survival rate is on average 90% if the disease is diagnosed while still localised, 68% for regional disease, and less than 10% for disseminated disease. At any time during the development of the disease, the process may be interrupted because a person dies of other causes.
With FIT screening lesions can be detected before clinical diagnosis; a screened individual with a positive test result will be referred for a colonoscopy for the detection and removal of adenomas and early-stage cancers. In this way, CRC incidence and/or CRC-related mortality can be reduced. The LYG by screening are calculated as the difference in model-predicted life years lived in the population with and without CRC screening.
Study population
In this study we modelled the age distribution of the Dutch population in 200522 and all individuals were followed until death. The CRC incidence rate was based on the observed incidence rate in The Netherlands in 1999–2003, which was before the onset of opportunistic screening.23 The observed CRC incidence in the population included cases from higher risk groups. Survival rates after clinical diagnosis of CRC was based on relative survival data from 1985 to 2004 from the south of The Netherlands,24 since nationwide data were not available. The survival for individuals aged 75 years and older was adjusted to fit the observed age-increasing mortality/incidence ratio.23
Screening strategies
CRC screening was simulated in the population starting in 2010. Individuals were offered FIT screening according to different screening schedules varying by:
Age to start screening at, respectively, 45, 50, 55 and 60 years
Age to stop screening at, respectively, 70, 75 and 80 years
Screening interval with, respectively, 1, 1.5, 2 and 3 years
Separate simulations were performed in which individuals were invited for: one-sample FIT screening; two-sample FIT screening with referral if at least one sample tested positive; two-sample FIT screening with referral only if both samples tested positive; or two-sample FIT screening with referral if the mean of both samples was positive. The cut-off level for a positive test result varied between 50, 75, 100, 150 and 200 ng haemoglobin/ml. These different screening schedules with varying start and stop ages, intervals, cut-off levels and samples resulted in a total of 960 different screening strategies.
After a positive test result, individuals were referred for colonoscopy. If no adenomas were found during the procedure, the individual was assumed to be at low risk of CRC and did not return to the screening programme until after 10 years. If one or more adenomas were found, they were removed and the individual entered a surveillance programme according to the Dutch guidelines for follow-up after polypectomy,25 ie, a colonoscopy after 6 years in the case of one or two adenomas and after 3 years in the case of three or more adenomas. We assumed that surveillance colonoscopies would be performed until the stop age for screening.
Attendance rates
We modelled attendance rates in the first screening round as observed in two Dutch population-based CRC screening trials;9 ,11 ,12 60% for both one and two-sample FIT screening, and we assumed these rates would remain stable over time. For subsequent screening rounds, we assumed that 80% of the individuals who attended the previous screening round would attend again.26 ,27 Furthermore, we assumed that 10% of the individuals never attended FIT screening28 and that these never-attenders had a higher risk of CRC than the general population (RR 1.15).2 Attendance at diagnostic colonoscopies following a positive FIT and subsequent surveillance colonoscopies were assumed to be 85% and 80%, respectively.29
Test characteristics
Test characteristics of the one-sample and two-sample FIT tests were fitted to the positivity rates and detection rates of advanced neoplasia observed in the first screening round of two Dutch randomised trials (table 1).9–12 Advanced neoplasia included CRC and advanced adenomas, of which the latter was defined as adenomas of 10 mm or greater in size, with 25% or greater villous component, and/or high-grade dysplasia.
Test characteristics of one-sample and two-sample FIT used in the model
To estimate the two-sample FIT test characteristics the following approach was applied; we used the average positivity rates and detection rates of the first and second test performed from the two-sample FIT group as reference and calculated the relative difference in performance when both samples were evaluated. Subsequently, we added this relative difference to the positivity rates and detection rates derived from the original one-sample FIT trials. An example of this method of calculation is presented in figure 1. The main reasons for this approach were: (1) the larger sample size of the one-sample FIT group provides more statistical power for the estimates of test sensitivity and specificity; (2) to avoid possible bias caused by the fact that the positivity rates and detection rates of the one-sample and two-sample FIT groups were calculated from different cohorts that were not 1:1 randomly assigned before invitation;10 ,12 (3) in this way we used paired observations, which gives a better estimate of the additional performance of a second FIT sample.

Example of calculation of the added performance of two-sample faecal immunochemical tests (FIT) compared with one-sample FIT screening. *This example provides the calculation of the positivity rate of two-sample FIT with at least one sample positive at a cut-off level of 50 ng haemoglobin/ml. The method of calculation is similar for both the positivity rate and detection rate, as well as for the different two-sample FIT positivity criteria (ie, at least one sample positive, both samples positive and the mean of both samples positive).
The sensitivity of diagnostic colonoscopies was assumed to be 75% for adenomas 1–5 mm, 85% for adenomas 6–9 mm, and 95% for adenomas 10 mm or greater and CRC.30
Costs
The analysis was conducted from a healthcare system perspective. In the base case analyses, we included screening and treatment costs as presented in table 2. Base case organisational costs for one-sample FIT screening were based on the Dutch cervical cancer screening programme, adjusted for differences with FIT screening. Costs for the test kits were based on prices from the manufacturer. Costs for analysis of the tests included material and personnel needed during the process of registration, analysis and authorisation of returned tests.34 The additional costs associated with two-sample FIT screening included double costs for FIT test kits and packaging material, and double costs for materials needed during the analysis of returned samples. Although double the number of FIT samples would need to be analysed, the costs of personnel needed for the analysis only increased by a factor of 1.5 because some tasks (eg, patient registration) do not require double the amount of work compared with analysing samples with one-sample FIT screening. Colonoscopy costs were based on an internal 6 months study at the Erasmus MC (data not shown). Costs for complications after colonoscopy were based on diagnosis treatment combination (DTC) rates derived from the Dutch Health Care Authority.35
Summary of model assumptions of the base case and sensitivity analyses
Costs for treatment of CRC were divided into three clinically relevant phases of care: initial treatment, continuous care and terminal care. Initial treatment costs were based on DTC rates, except for oxaliplatin. The costs for oxaliplatin were derived from the Dutch Health Care Insurance Board.36 We assumed that during the continuous care phase, individuals would follow the Dutch CRC treatment guidelines,37 and costs for periodic control were based on DTC rates. Terminal care costs were based on a Dutch last year of life cost analysis. These were estimated at €19 700 for patients who ultimately died from CRC.38 We assumed that these costs increased with stage at diagnosis, at a rate observed for US patients.39 ,40 Dutch terminal care costs for individuals who died from CRC were approximately 40% of the US costs. We assumed that terminal care costs of CRC patients who die from other causes were also 40% of the US costs.
Cost-effectiveness analyses
For all screening strategies we used the MISCAN–colon model to estimate costs and compare the number of LYG due to screening with the situation without screening. Costs and LYG were discounted by 3% per year.41 Strategies that were more costly and less effective than other strategies were ruled out by simple dominance. Strategies that were more costly and less effective than a mix of other strategies were ruled out by extended dominance. The remaining strategies are not dominated and are known as ‘efficient’. On a plot of LYG versus costs, the line that connects the efficient strategies is called the efficient frontier, which implies that all dominated strategies lie below this line. The incremental cost-effectiveness ratio (ICER) of an efficient strategy was determined by comparing its additional costs and effects with those of the next less costly and less effective efficient strategy.
Sensitivity analyses
We performed several sensitivity analyses on different parameters, which are summarised in table 2. We started with sensitivity analyses with respect to the additional performance and costs of two-sample FIT over one-sample FIT. Furthermore, we adjusted for reduced quality of life due to screening as well as CRC treatment. Correlated FIT test results were assumed because individuals with a false-negative test result are likely to have a higher than average probability to have another false-negative test result at a successive screening round. We used the results of a population-based CRC screening programme in Italy to estimate the correlation between false-negative FIT results for cancers and advanced adenomas in subsequent screening rounds.33 Effects of limited colonoscopy capacity were evaluated by only considering strategies in which colonoscopy demand did not exceed 40, 20, 10, or five colonoscopies per 1000 individuals per year. In order to assess the cost-effectiveness of the different strategies for individuals who adhere to the CRC screening guidelines, we simulated all screening strategies with 100% attendance to screening, diagnostic and surveillance colonoscopies. In addition, we performed sensitivity analyses on lower and higher values than the base case analysis for fatal complication rates with colonoscopy and for unit costs of FIT, colonoscopy, complications and treatment. We decided not to perform a probabilistic sensitivity analysis after having weighed the limited added value against the computational effort required (see Discussion).
Results
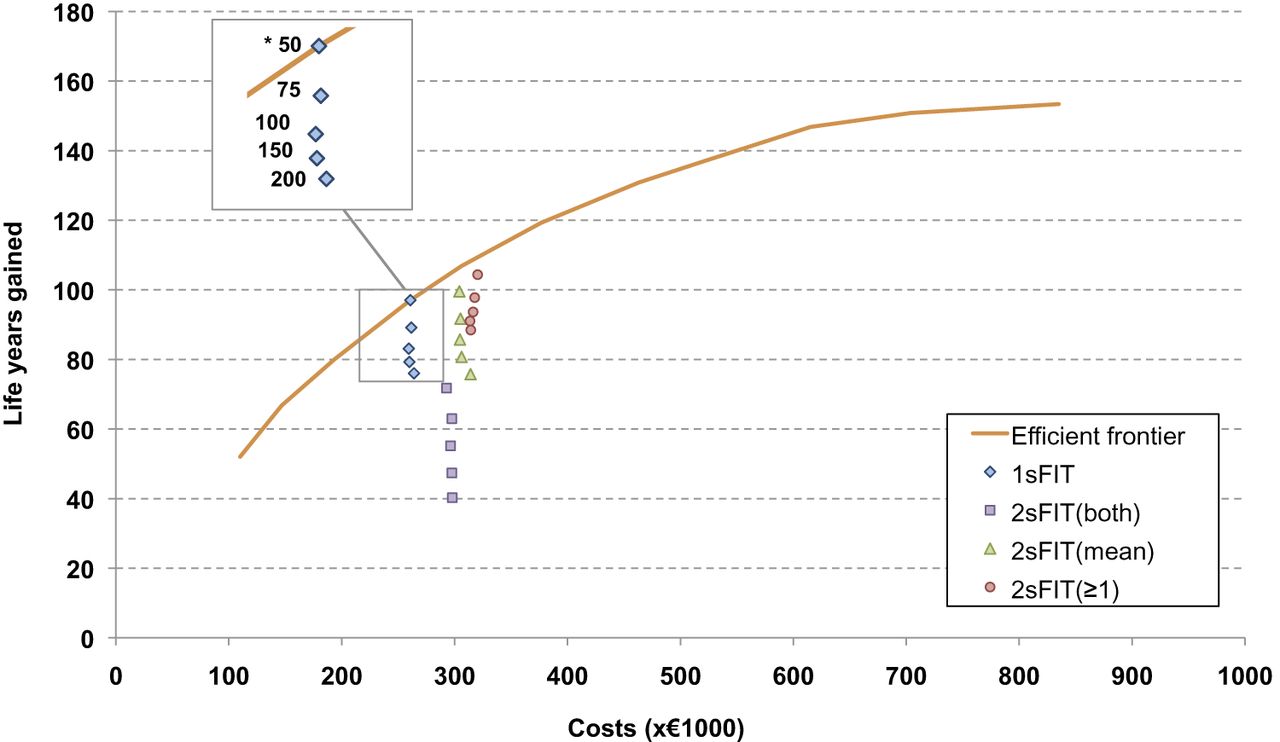
The strategy of biennial one-sample FIT screening from age 55 to 75 years yielded 76.0–97.0 LYG per 1000 individuals aged 45 years and older, compared with no screening (the range in LYG reflects different FIT cut-off levels). The associated costs ranged from €259 000 to €264 000 per 1000 individuals, corresponding with €2690–3473 per LYG compared with no screening (figure 2). The two-sample FIT screening strategies with the mean of both test results being positive and at least one test result being positive provided, respectively, between −0.3–2.6 and 7.3–12.4 more LYG than one-sample FIT screening at additional costs of, respectively, €43 000–50 000 and €50 000–59 000 per 1000 individuals. The corresponding ICER ranged from €16 818–31 930 and €4024–8041 per additional LYG. The two-sample FIT screening strategies with two positive outcomes were less effective (ie, fewer LYG per 1000 individuals) and more costly than one-sample FIT screening, and were therefore dominated from a cost-effectiveness standpoint (see supplementary appendix 2, available online only, for detailed results on effects and costs for the different biennial FIT screening strategies with the age range of 55–75 years).

Costs and life-years gained (LYG) compared with no screening per 1000 individuals in 2005 (start of the programme) for one-sample and two-sample faecal immunochemical test (FIT) screening at different cut-off values. All data points represent biennial FIT screening from age 55 to 75 years. *Per screening test (ie, one or two-sample FIT), the data points represent the results at cut-off values of 50, 75, 100, 150 and 200 ng haemoglobin/ml. For each test, a higher cut-off level is associated with fewer LYG, that is the data point at the bottom represents the result at a cut-off value of 200 ng haemoglobin/ml, whereas the data point at the top represents the result at a cut-off value of 50 ng haemoglobin/ml. 1sFIT, one-sample FIT; 2sFIT(both), two-sample FIT, referral to colonoscopy restricted to subjects with both samples positive; 2sFIT(mean), two-sample FIT, referral to colonoscopy restricted to subjects for whom the mean of both samples is positive; 2sFIT(≥1), two-sample FIT, referral to colonoscopy of all subjects with at least one sample positive. The most efficient strategies, ie, those strategies which for a given amount of costs yield the largest number of life-years saved, are connected by the efficient frontier. The screening interventions were modelled from the year 2005, all individuals were invited for screening until they reached the end age for screening, and healthcare costs for each individual were calculated until death. Costs and LYG were discounted at an annual rate of 3%.
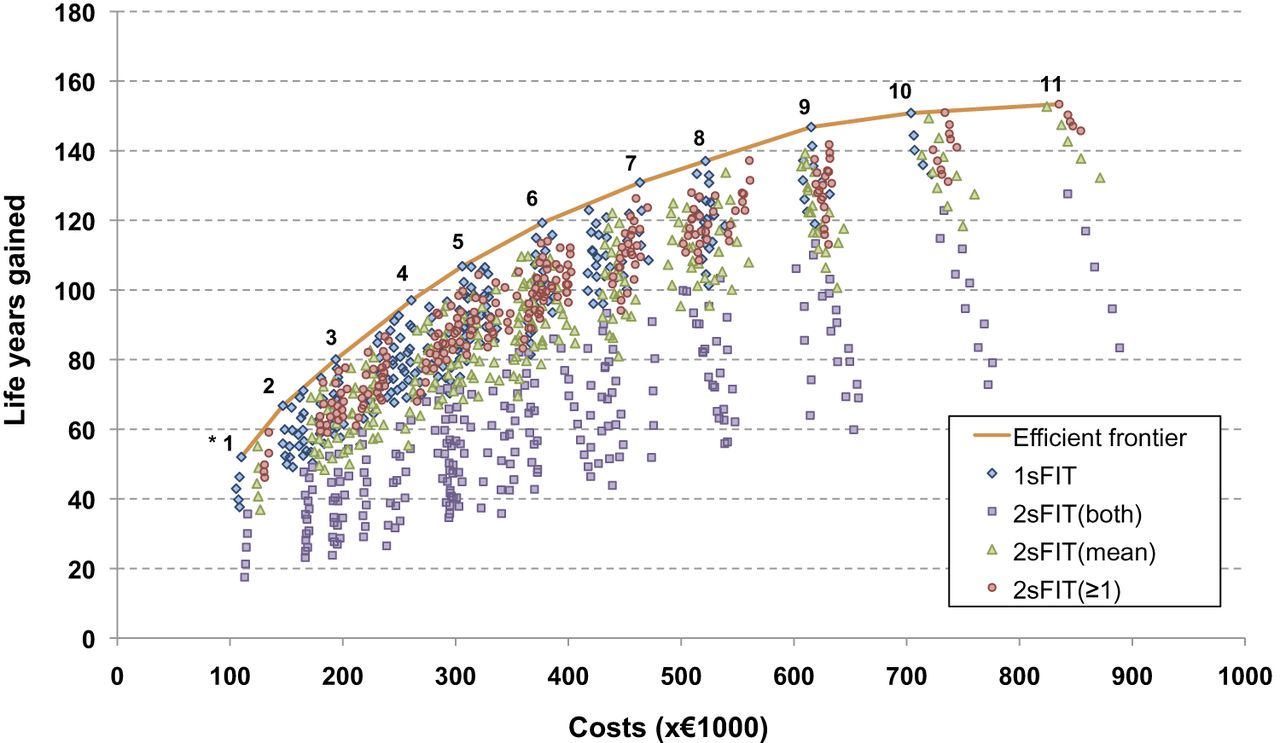
When all simulated screening strategies were considered (ie, by varying not only the cut-off level, but also the screening age range and interval), the number of LYG compared with no screening ranged between 17.5 and 153.4 per 1000 individuals, and costs ranged between €105 000 and €889 000 per 1000 individuals (figure 3). The LYG and costs of the strategies on the efficient frontier are presented in table 3. Although the ICER of biennial two-sample FIT screening between ages 55 and 75 years (mean of both samples being positive, or at least one sample being positive) compared with one-sample FIT seemed reasonable, table 3 shows that most two-sample FIT strategies are not cost-effective. When comparing the additional effect of providing two samples per screening round to the effect of providing one-sample FIT more frequently (ie, with a larger age range and/or shorter interval), the latter provided more LYG at equal or less costs than the two-sample FIT strategies. This effect is also demonstrated in figure 2, because the strategies of biennial two-sample FIT are located below the efficient frontier. The two-sample FIT screening strategies with the mean from both test results being positive or at least one positive test outcome were therefore ruled out by extended dominance and were considered not to be cost-effective compared with one-sample FIT screening. Although figure 2 demonstrates this effect for biennial FIT screening, the principle applies to all screening intervals, including annual screening.

Costs and life years gained (LYG) compared with no screening per 1000 individuals in 2005 (start of the programme), for one-sample and two-sample faecal immunochemical test (FIT) screening at different cut-off values. The data represent all simulated screening strategies, which include various sampling strategies, cut-off levels, screening age ranges and intervals. *The numbers of the strategies on the efficient frontier correspond to the cost-efficient strategies presented in table 3. 1sFIT, one-sample FIT; 2sFIT (both), two-sample FIT, referral to colonoscopy restricted to subjects with both samples positive; 2sFIT(mean), two-sample FIT, referral to colonoscopy restricted to subjects for whom the mean of both samples is positive; 2sFIT(≥1), two-sample FIT, referral to colonoscopy of all subjects with at least one sample positive. The most efficient strategies, ie, those strategies that for a given amount of costs yield the largest number of life-years saved, are connected by the efficient frontier. Strategies with the least intensive screening schedule (ie, small age range, and long screening interval) are located at the bottom left of the graph, whereas strategies with the most intensive screening schedule (ie, large age range and short screening interval) are located at the top right of the graph. The screening interventions were modelled from the year 2005, all individuals were invited for screening until they reached the end age for that particular screening strategy, and healthcare costs for each individual were calculated until death. Costs and LYG were discounted at an annual rate of 3%.
Costs per LYG compared with no screening and ICER of the cost-effective screening strategies, in a population with realistic attendance* at the screening programme
Sensitivity analyses
The higher cost-effectiveness of more frequent one-sample FIT screening compared with two-sample FIT strategies was robust to alterations in our model assumptions. However, decreasing the cost difference between one-sample and two-sample FIT by 50% resulted in multiple two-sample FIT strategies becoming efficient next to one-sample FIT. In addition, limited colonoscopy capacity did not affect the preference of one-sample FIT over two-sample FIT strategies, with the exception of the most stringent scenario. In case the colonoscopy demand was not allowed to exceed five colonoscopies per 1000 individuals per year, two-sample FIT strategies with both samples being positive were preferred over one-sample FIT.
Discussion
Our analysis demonstrates that given a screening schedule (ie, age range and screening interval), two-sample FIT strategies with the mean from both test results being positive or at least one positive test outcome provide more LYG at acceptable costs than one-sample FIT screening. However, when all simulated screening strategies are considered (ie, including varying age ranges and screening intervals), increasing the screening intensity of one-sample FIT testing (ie, greater age range and/or shorter screening interval) is more cost-effective than providing two FIT within one screening round.
This study was based on data from a randomised trial in which the attendance and diagnostic yield of one and two-sample FIT were compared.12 Considering only the relation between the positivity rate and the detection rate of advanced adenomas it seems that to choose FIT screening with either one or two samples based on the available colonoscopy capacity should be recommended. However, the current analysis demonstrates that including the costs for the screening and treatment of CRC over multiple screening rounds affects the relation between one and two-sample FIT. Although a number of two-sample FIT screening strategies (eg, with at least one sample, or the mean of both samples being positive) are close to the cost-efficiency frontier, increasing the number of one-sample FIT screening rounds was found to be a more cost-effective way of gaining health benefits.
Other cost-effectiveness analyses determining the optimal number of FIT samples are limited. Two Japanese studies compared the costs of FIT screening with either one, two or three FIT per cancer detected in a single screening round.42 ,43 In all three sampling strategies individuals were referred for diagnostic colonoscopy if at least one sample was positive. In both studies it was concluded that two-sample FIT screening with at least one test being positive would be the most desirable strategy from a diagnostic accuracy and cost-effectiveness stand point. A more recent French study did include multiple screening rounds in their cost-effectiveness model and also evaluated the effect of different cut-off levels.44 The authors concluded that three-sample FIT screening with a cut-off level of 50 ng haemoglobin/ml was the most cost-effective strategy to be preferred. The results of our current analysis do agree with these studies about the added value of multiple FIT sampling within a given screening schedule. More than one FIT sample can provide additional health benefits at acceptable costs. Unfortunately, these studies do not provide information comparing the added effect of multiple FIT samples per screening round with the effect of increasing screening intensity with one-sample FIT.
Several limitations need to be acknowledged. First, we based our analysis on data from one screening round. Therefore, we could not estimate the correlation of test outcomes between successive screening rounds. Individuals with a false-negative test result (eg, because the lesion did not bleed) in one screening round may have a higher than average probability to have another false-negative test result at a successive screening round. Therefore, we performed a sensitivity analysis based on Italian results,31 in which correlation of systematic false-negative test outcomes was assumed for advanced adenomas and CRC. The analysis showed that the cost-effectiveness of two-sample FIT decreased less than the cost-effectiveness of one-sample FIT strategies, but one-sample FIT screening remained dominant. Nevertheless, we need further data from repeat screening rounds in The Netherlands to get a good estimate of systematic false-negative rates in the population we modelled. Second, we assumed the screening attendance rate to be independent of screening intensity and the number of FIT samples performed. In the first screening round of one of the Dutch trials,10–12 the screening attendance rate was not significantly different between the two-sample FIT and one-sample FIT study arm (61.3% vs 61.5%; p=0.837). However, it could be hypothesised that, for example, adherence in the case of a more intense screening schedule with one-sample FIT would decrease compared with less intense screening schedules with two-sample screening. This would negatively affect the cost-effectiveness of more intensive screening strategies relative to two-sample testing and might alter our conclusions. Third, we based our analyses on a screening-naive population. Depending on the amount of previous screening, CRC incidence in the population and the resulting cost-effectiveness could be lower. However, this would affect the strategies we compared in a similar way. If anything, the effect of previous screening would make one-sample FIT screening more preferable, because a lower CRC incidence would reduce the added value of a second FIT sample. Finally, we did not perform a probabilistic sensitivity analysis. Given the large number of strategies that has to be evaluated for each draw, such an analysis would require a huge computational effort. We believe that simulating the range of varying strategies is one of the strengths of this analysis, because we were primarily interested in the comparison of different FIT screening strategies with varying numbers of samples provided, FIT cut-off levels, screening intervals and age ranges. Regardless of this, data on the probability distributions of most of the parameter values are lacking, which makes the interpretation of a probabilistic sensitivity analysis difficult and the outcome of limited added value. One of the most uncertain assumptions of the model is that all CRC arise from adenoma precursors. For FIT screening, this assumption will have limited impact because FIT has a low sensitivity for adenomas. In addition, the assumption of non-bleeding (and therefore for FIT undetectable) adenomas was evaluated in the sensitivity analysis by assuming correlation between false-negative results.
In conclusion, our analysis provides new insights for decision-makers; in a situation in which attendance to screening does not differ between strategies, intensifying screening with one-sample FIT was found to be more cost-effective than providing two FIT samples within one screening round. It is therefore recommended to increase the number of screening rounds with one-sample FIT screening, before considering increasing the number of FIT samples provided per screening round.
References
Supplementary materials
Supplementary Data
This web only file has been produced by the BMJ Publishing Group from an electronic file supplied by the author(s) and has not been edited for content.
Files in this Data Supplement:
- Download Supplementary Data (PDF) - Manuscript file of format pdf
- Download Supplementary Data (PDF) - Manuscript file of format pdf
Footnotes
-
Funding This trial was funded by the Dutch Cancer Society (EMCR 2006-3673), the Dutch Ministry of Health, Health Care Prevention Program–Implementation (ZonMw 63300022 and ZonMw 120720011), Olympus Medical Systems Europe GmbH, Hamburg, Germany, the Jacoba Foundation and Eiken Chemical Co., Tokyo, Japan. The funding sources had no influence on study design, data collection, monitoring, analysis and interpretation of results or the decision to submit the manuscript for publication.
-
Competing interests None.
-
Provenance and peer review Not commissioned; externally peer reviewed.