Article Text

Abstract
Objective The effects of dietary interventions on gut bacteria are ambiguous. Following a previous intervention study, we aimed to determine how differing diets impact gut bacteria and if bacterial profiles predict intervention response.
Design Sixty-seven patients with IBS were randomised to traditional IBS (n=34) or low fermentable oligosaccharides, disaccharides, monosaccharides and polyols (FODMAPs) (n=33) diets for 4 weeks. Food intake was recorded for 4 days during screening and intervention. Faecal samples and IBS Symptom Severity Score (IBS-SSS) reports were collected before (baseline) and after intervention. A faecal microbiota dysbiosis test (GA-map Dysbiosis Test) evaluated bacterial composition. Per protocol analysis was performed on 61 patients from whom microbiome data were available.
Results Responders (reduced IBS-SSS by ≥50) to low FODMAP, but not traditional, dietary intervention were discriminated from non-responders before and after intervention based on faecal bacterial profiles. Bacterial abundance tended to be higher in non-responders to a low FODMAP diet compared with responders before and after intervention. A low FODMAP intervention was associated with an increase in Dysbiosis Index (DI) scores in 42% of patients; while decreased DI scores were recorded in 33% of patients following a traditional IBS diet. Non-responders to a low FODMAP diet, but not a traditional IBS diet had higher DI scores than responders at baseline. Finally, while a traditional IBS diet was not associated with significant reduction of investigated bacteria, a low FODMAP diet was associated with reduced Bifidobacterium and Actinobacteria in patients, correlating with lactose consumption.
Conclusions A low FODMAP, but not a traditional IBS diet may have significant impact on faecal bacteria. Responsiveness to a low FODMAP diet intervention may be predicted by faecal bacterial profiles.
Trial registration number NCT02107625.
- IRRITABLE BOWEL SYNDROME
- DIET
- INTESTINAL BACTERIA
Statistics from Altmetric.com
Significance of this study
What is already known on this subject?
Dietary intervention is effective at reducing IBS symptom severity, but not all patients respond to the intervention.
Subgroups of patients with IBS have an altered gut microbiota composition.
Gut bacteria have been demonstrated to be affected by alterations in dietary composition.
What are the new findings?
Low fermentable oligosaccharides, disaccharides, monosaccharides and polyols (FODMAPs), but not traditional IBS diet might influence faecal bacterial composition.
Low FODMAP, but not traditional IBS diet responders could be discriminated from non-responders before the intervention based on faecal bacterial profiles.
Dysbiosis Index scores were higher in patients after 4 weeks of low FODMAP diet, but not after traditional IBS diet.
Non-responders to low FODMAP diet had higher Dysbiosis Index scores than responders at baseline.
How might it impact on clinical practice in the foreseeable future?
The potential ability of faecal bacteria composition to predict response to a low FODMAP diet in IBS may help in selecting patients for this intervention.
Introduction
Affecting approximately 10–15% of the Western world,1 IBS is a functional GI disorder characterised by abdominal discomfort or pain associated with altered bowel habits.2 IBS is heterogeneous in aetiology with the underlying mechanism not yet fully elucidated. However, host–microbe interactions are suggested to play a role in symptom manifestation in a subgroup of patients with IBS.3
In healthy individuals, bacteria live in symbiosis with each other and the host, which is often referred to as normobiosis. Disturbance of the intestinal bacteria may cause a permanent imbalance to occur, known as dysbiosis.4 Dysbiosis is suggested to evoke maladies of the GI tract5 and previous studies propose an altered bacterial composition,6 interpretable as dysbiosis,7 to be present in a subset of patients with IBS.
Among factors such as pathogenic bacterial infection8 and antibiotic use,9 diet is an additional factor with potential to alter gut bacterial composition.10 Nutrients such as dietary fibres, which have not been directly absorbed by the host, become a food source for bacterial species of the gut, for example, Bifidobacteria.
Dietary intervention has since long been one of the basic treatment options in IBS. Based on the dietary recommendations from the National Institute for Health and Care Excellence (NICE) and the British Dietetic Association,11 ,12 the ‘traditional’ IBS diet encourages ‘healthy eating’, with a regular meal plan, minimising portion size and reducing fats, caffeine and excessive fibre intake, together with avoidance of soft drinks and gas-producing foods such as cabbage, beans and onions. Furthermore, patients are advised to eat in a calm manner and to chew thoroughly.11 ,13 ,14 Recently, fermentable oligosaccharides, disaccharides, monosaccharides and polyols (FODMAPs) have been suggested as symptom-generating factors in IBS. FODMAPs have osmotic activity, causing increased luminal water retention,15 ,16 and promote luminal distension by rapid gas production through bacterial fermentation.17 In previous studies by our group and others, it has been demonstrated that symptoms may be alleviated in some patients with IBS after traditional and low FODMAP diet intervention.14 ,18 However, a diet low in FODMAPs has marked effects on gut bacteria19 ,20 and ramifications are still under deliberation. Further, it is still unknown why some patients with IBS respond favourably to dietary changes, while others show no or minimal response.
In this secondary analysis of patients from a study previously published by our group,14 we hypothesised that gut bacteria profiles of patients with IBS are altered through dietary intervention and that patient responsiveness to intervention may be linked to gut bacteria composition. Using multivariate analysis, we aimed to determine if dietary interventions affect gut bacteria and if bacterial profiles of responders to intervention can be discriminated from non-responders for use to predict efficacy of dietary intervention therapy.
Materials and methods
Study cohort
The study cohort has been described in detail in a previously conducted study by Böhn et al.14 Briefly, patients meeting the ROME III criteria for IBS2 were recruited through outpatient clinics in Gothenburg and Stockholm, Sweden. Exclusion criteria included other GI diseases such as IBD or coeliac disease or presence of severe liver, neurological, cardiac or psychiatric disease. Furthermore, patients were not allowed to be on excessively nutrient restrictive diets prior to the study. Patients consuming probiotics and/or on a lactose-reduced diet were allowed to continue their practices as long as they were unaltered during the study.
Study design
At the beginning of the 10-day screening period, verbal and written information was provided to patients about the study and all participating patients gave written informed consent. During screening, participants completed a stool diary based on the Bristol Stool Form scale 2 used to subgroup patients according to bowel habits. Additionally, food intake was recorded in food diaries and assessed both during screening (baseline) and after the intervention as described in detail in Böhn et al.14 After screening and at the end of the diet intervention, patients completed an IBS Symptom Severity Score (IBS-SSS) questionnaire.21 Only patients with IBS-SSS ≥175 at baseline, that is, reporting moderate or severe IBS symptoms, were eligible for study inclusion. Patients were randomised 1:1 through an external contact research organisation computer-generated web-based program to follow either a traditional IBS diet or a low FODMAP diet for 4 weeks. Faecal samples were collected once during the screening period and once during the last week of the diet intervention, as detailed in the online supplementary material. Patients that reduced IBS-SSS by ≥50 were defined as responders since this indicates a clinically meaningful improvement.21 The study was registered at ClinicalTrials.gov ID NCT02107625.
supplementary material
Intervention diets
The traditional IBS diet
Based on the British Dietetic Association and NICE dietary recommendations,11 ,13 the traditional IBS diet focused on portion control and frequency. Patients on this diet were instructed to eat three meals and three snacks during the day and to do so in a relaxed manner, chewing thoroughly and to a comfortable degree of fullness. Fibres were advised to be eaten distributed evenly over the day with a reduction in spicy and fatty foods, alcohol, coffee, onions, cabbage and beans. Soft drinks, carbonated beverages and sweeteners that end with -ol (frequently found in chewing gums) were to be avoided. Further details of the traditional IBS diet can be found in Böhn et al.14
The low FODMAP diet
Patients following this diet had restricted intake of foods containing FODMAPs. Examples of food items with high FODMAP content are foods containing wheat, barley and rye, as well as onion and certain legumes, all rich in fructans and galacto-oligosaccharides. Additionally, lactose-containing products, foods with fructose in excess of glucose, for example, apples, pears, asparagus, watermelon and honey; food items rich in mannitol, maltitol, sorbitol and xylitol, for example, peaches, apricots and artificially sweetened products were also excluded. Further details of the low FODMAP diet can be found in Böhn et al.14
Food intake assessment
All patients completed a 4-day food diary once during the screening period and once during the last week of the 28-day intervention. Average daily intakes were calculated in DIETIST XP V.3.1 (Kostdata.se, Stockholm, Sweden) for energy, dietary fibres, lactose, monosaccharides and FODMAPs as described in detail in Böhn et al.14
Symptom assessment
Bowel habits were recorded in a stool diary each day during the 10-day screening period and the 28-day intervention period. IBS symptom severity was assessed on days 0, 14 and 29 of the intervention using the IBS-SSS questionnaire. Details are found in the online supplementary material. An extensive comparison of the diets regarding clinical response was performed in our previous publication.14
Gut bacterial analysis
Gut bacterial analysis was performed by using a commercially available test, GA-map Dysbiosis Test22 (Genetic Analysis AS, Oslo, Norway), which is described in detail in the online supplementary material. Briefly, the GA-map Dysbiosis Test22 output is a bacterial profile and a Dysbiosis Index (DI) score. A DI >2 (maximum 5) indicates a bacteria composition that differs from a healthy reference group and are as such considered to be dysbiotic.22
Data and statistical analysis
Univariate analysis
Statistical analysis was performed using both GraphPad Prism V.6.04 (GraphPad Software, California, USA) and SPSS statistical package, V.21.0 (SPSS, Chicago, Illinois, USA). The Mann-Whitney U test was applied when comparing two groups for significant differences in continuous data. Results in text, tables and figures are presented as median followed by range shown as 25th and 75th percentile. In this study, while significance was denoted as a p value of <0.05, if significance did not hold true after correction for multiple comparisons using the classical one-stage method in order to account for false-positive results, presented as q values, they were thus described as tendencies.
Multivariate analysis
Multivariate factor orthogonal partial least squares discriminant analysis (OPLS-DA) (SIMCA V.13.0.3.0, Umetrics AB) was implemented to examine if responders could be discriminated from non-responders (Y variable observations) based on totality of signal intensities from 54 DNA probes targeting ≥300 bacteria on different taxonomic levels (X variables) measured through GA-map Dysbiosis Test analysis (details described in the online supplementary material). Evaluators were not blinded to responder status when analysing the microbiota data. This analysis aims to identify which of the multiple bacterial targets are associated with and drives either of the multiple outcomes that is, responder or non-responder. By using multivariate analysis, the complexity of analysing >50 variables can be reduced down to a more interpretable model. The goodness of fit of the OPLS-DA is represented by the R2 parameter with the best possible fit being R2=1, indicating that the model explains the data perfectly. When considering heterogeneous biological variables, a model would be considered to have a good fit with an R2≥0.5.23 Internal cross-validation of the model was performed whereby the data were remodelled seven times and each time a portion consisting of 1/7 of the samples was kept out until all samples had been kept out once. During this, the ability of the model to predict the class of each patient was tested. Once completed, the predictive robustness of the models ability to predict a future patient's class was defined and represented by the Q2 value. A Q2 value >0.4 is considered satisfactory with biological variables;23 furthermore, the difference between the Q2 and R2 values should not exceed 0.2–0.3 since this indicates presence of many irrelevant model terms.23 ,24 To further refine the models derived, extreme outliers which exceed the Hotelling's T2 95% ellipses of critical distance for classification and have potential to skew the model were identified and given priority for exclusion before remodelling. Then, moderate outliers exceeding the critical distance in DModX which are not powerful enough to shift the model but do not fit the model well were subsequently excluded. Finally, variable influence on projection (VIP) was used as a variable selection based on discriminatory power. While variables with a VIP >1 are most influential for the model and are most relevant for explaining the Y observations (patients with IBS), a VIP of 0.7–0.8 is commonly used.24 In this study, a VIP cut-off of 0.7 was implemented.
Results
Clinical characteristics of the study cohort
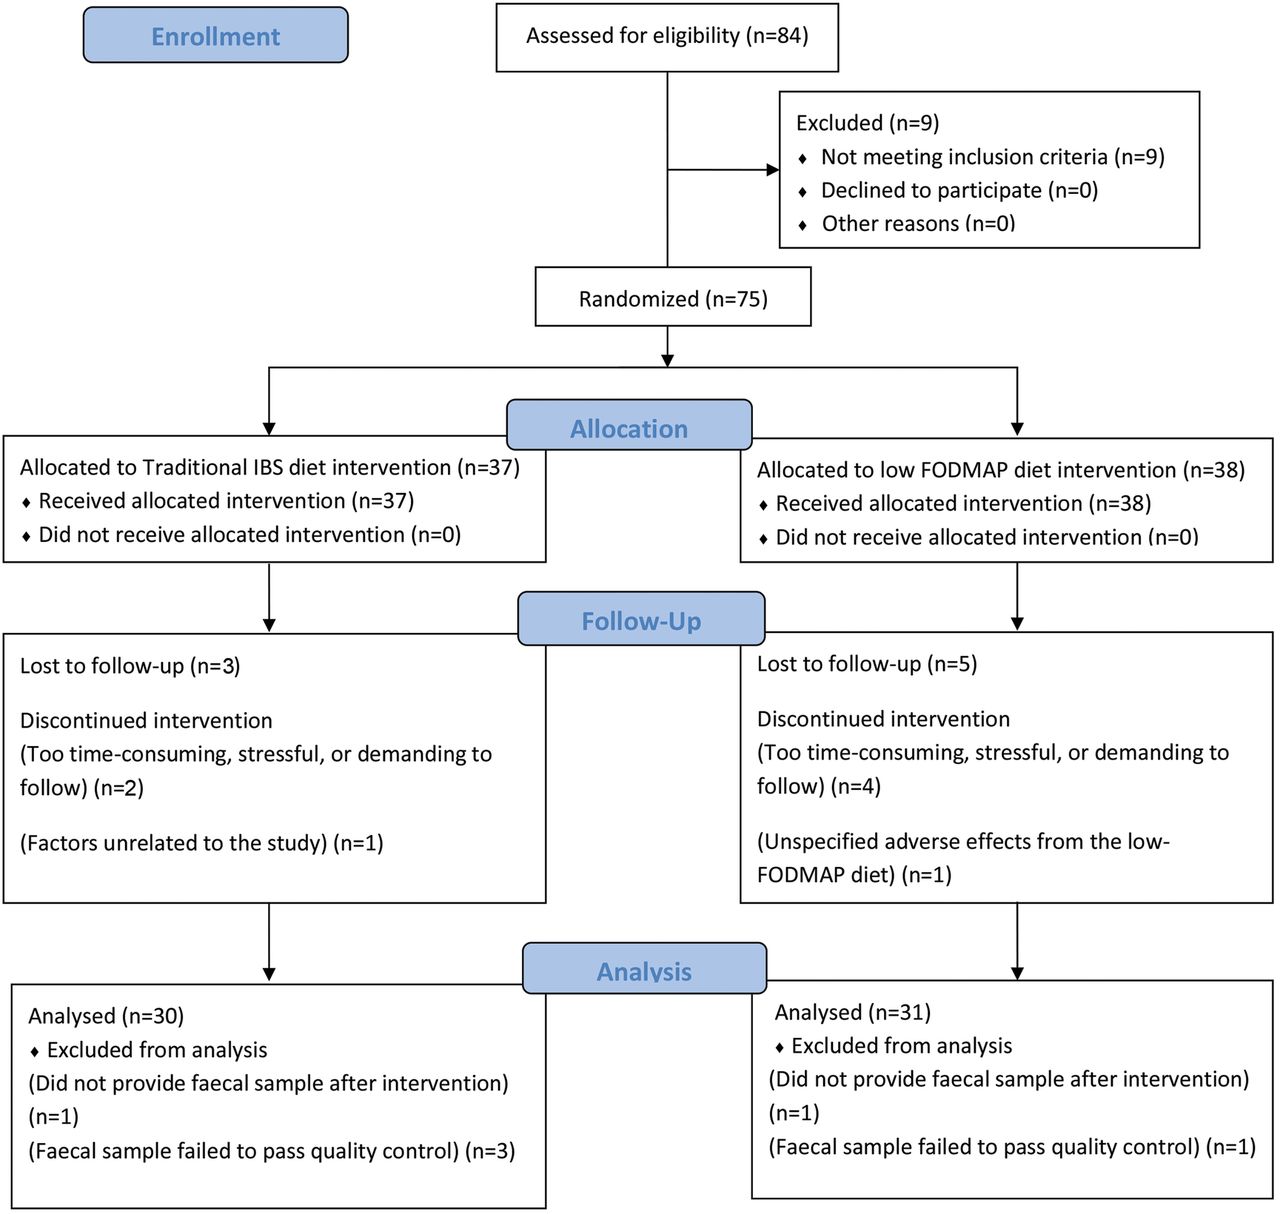
Of the 67 patients with IBS who completed the full diet intervention, two patients did not provide faecal samples, while faecal samples from four patients (two non-responders and one responder to the traditional IBS diet and one non-responder to the low FODMAP diet) failed to pass quality control during the GA-map Dysbiosis Test,22 as described in the online supplementary material. Briefly, three samples had abnormally low levels of hybridisation (as described in detail in Casén et al22) and were justified as being atypical and thus considered outliers. The fourth failed due to technical circumstances. Hence, 61 patients following a traditional IBS diet (n=30) or a low FODMAP diet (n=31), with faecal samples obtained before and after intervention, were included in this study (figure 1). In total, 35 patients were responders to the dietary interventions when following either the traditional IBS diet (n=16, 53%) or the low FODMAP diet (n=19, 61%). Distribution of IBS subgroups according to bowel habit and IBS symptom severity within the cohort is demonstrated in table 1. Good adherence to the dietary advice was recorded among all patients as previously demonstrated.14
Demographics of cohorts during diet interventions

CONSORT flow diagram. Flow chart depicting patient numbers during the different phases of the study. FODMAP, fermentable oligosaccharides, disaccharides, monosaccharides and polyols.
Faecal bacterial profiles discriminate between responders and non-responders before low FODMAP but not traditional IBS dietary intervention
OPLS-DA was performed on faecal bacterial profiles of responders and non-responders to diet therapy before and after the 28-day traditional IBS or low FODMAP dietary intervention.
Before intervention, bacterial profiles of responders and non-responders to a traditional IBS diet did not differ between the groups. The OPLS-DA fitted model for the traditional diet before the intervention comprised of one predictive component after exclusion of strong and moderate outliers and subsequent focus on variables with a VIP >0.7. The fit of the model was poor (R2=0.46) with no predictive ability (Q2=−0.04) and an unsatisfactory level of irrelevant model terms (ΔR2Q2=0.5) (figure 2A). After the traditional IBS diet, the similarity in responder and non-responder bacterial profiles was unaltered as evident by the indices of the one predictive component OPLS-DA model (R2=0.58, Q2=−0.41 and ΔR2Q2=0.99). Although model fit had improved, the predictability of the model and thus the difference between R2 and Q2 had worsened (figure 2B). Thus, bacterial profiles of responders and non-responders to a traditional IBS diet did not differ between the groups before or after the intervention.
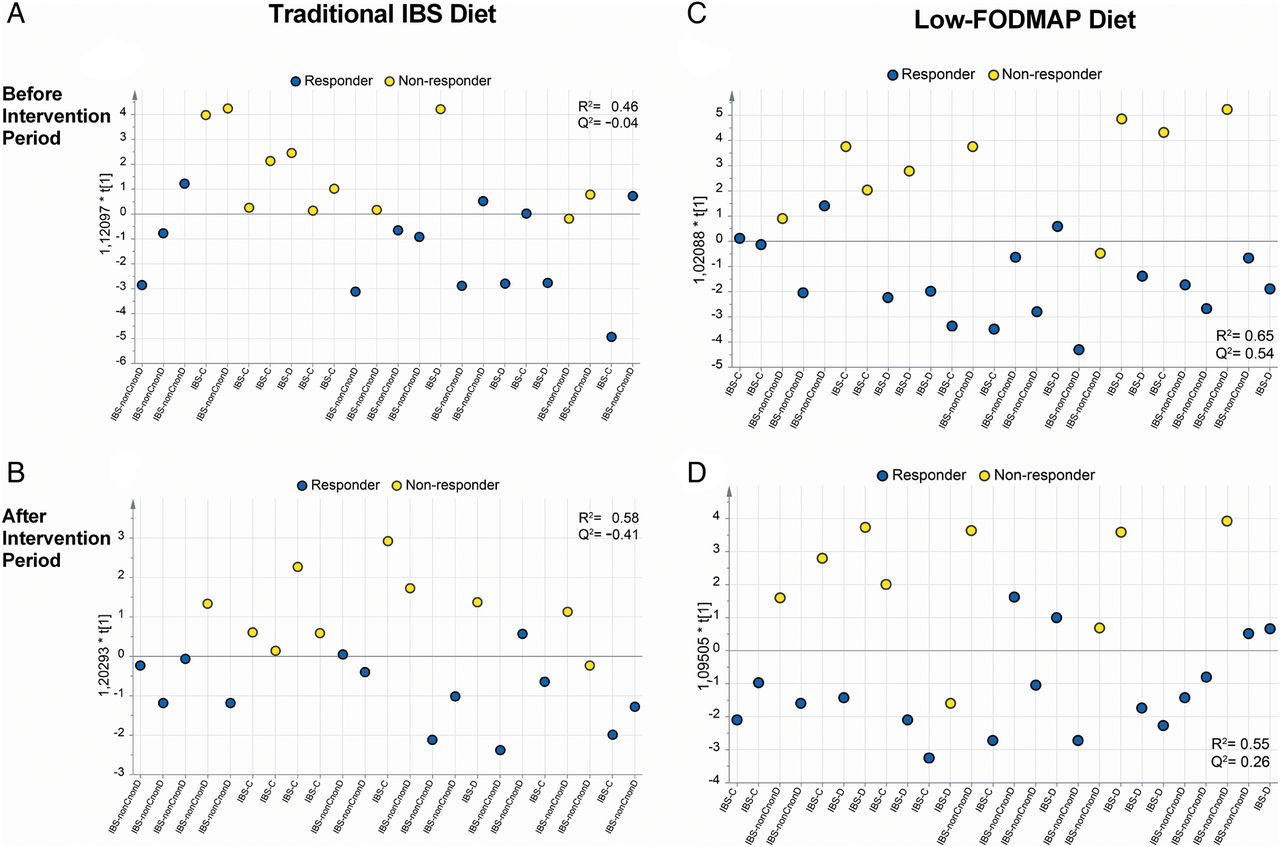
Bacterial profile analysis of non-responders and responders to dietary intervention. The GA-map Dysbiosis Test22 analysing signals from 54 probes targeting ≥300 bacteria on different taxonomic levels was used to create bacterial profiles for patients undergoing either traditional IBS diet (n=30) or low fermentable oligosaccharides, disaccharides, monosaccharides and polyols (FODMAP) (n=31) intervention. Any class discriminations made are depicted along the Y axis with each individual patient plotted along the X axis. (A) Multivariate discriminate analysis (orthogonal partial least squares discriminant analysis (OPLS-DA)) scatter plot showing the discrimination between non-responders (yellow dots) (one strong and two moderate outliers excluded) and responders (blue dots) (three moderate outliers excluded) (n=24) before traditional IBS dietary advice based on all bacterial probes (n=54), R2=0.46, Q2=−0.04. (B) OPLS-DA showing discrimination between non-responders (four strong outliers excluded) and responders (three strong outliers excluded) after traditional IBS dietary advice (n=23), R2=0.58, Q2=−0.41. (C) OPLS-DA scatter plot showing discrimination between non-responders (two strong and one moderate outliers excluded) and responders (one strong and one moderate outliers excluded) before a low FODMAP diet (n=26), R2=0.65, Q2=0.54. (D) OPLS-DA scatter plot showing discrimination between non-responders (two strong outliers excluded) and responders (three moderate outliers excluded) after low FODMAP diet (n=26), R2=0.55, Q2=0.26. An R2 value representing the goodness of fit shows the ability for a model to explain the data; while an R2 of 1 is the best possible fit, an R2>0.5 is acceptable for biological data.23 Q2 represents the predictive robustness of a model and is derived after leave one out validation. Like the R2 value, the higher the Q2 value the stronger its predictive ability with values >0.4 to be acceptable for biological data.23 IBS-C, constipation-predominant IBS; IBS-D, diarrhoea-predominant IBS; IBS-nonCnonD, IBS with mixed loose and hard stools (IBS-M) or unsubtyped IBS (IBS-U); IBS-SSS, IBS Symptom Severity Score.
Before the low FODMAP intervention, bacterial profiles of responders and non–responders were effectively discriminated against each other in an OPLS-DA model comprising one predictive component. The model had adequate robustness (R2=0.65) and moderately high predictive ability (Q2=0.54) to identify responders and non-responders to low FODMAP intervention (ΔR2Q2=0.11) (figure 2C). After the low FODMAP intervention, this discrepancy between faecal bacterial profiles of responders and non-responders persisted as depicted in a one-component OPLS-DA model (R2=0.55, Q2=0.26 and ΔR2Q2=0.3). The lower Q2 indicates that the responder and non-responder profiles had become more similar. The model was however suitably robust for classifying responders and non-responders to a low FODMAP diet based on the faecal bacterial profiles after diet intervention (figure 2D).
However, an OPLS-DA model built of bacterial profiles obtained before intervention of all patients randomised to follow either a traditional IBS or low FODMAP diet revealed the profiles to be similar before their respective interventions as indicated by the model having a poor model fit (R2=0.35) and no predictive ability (Q2=−0.025). Univariate analysis of the abundance of each investigated bacteria, that is, the relative amount of bacterial DNA respective for each bacterial probe covered in the GA-map Dysbiosis Test, presented no difference before intervention between patients destined to follow a traditional IBS diet or a low FODMAP diet (data not shown).
Limited bacterial discrepancies between responders and non-responders to a traditional IBS diet intervention
Bacterial profile composition of responders and non-responders to the traditional IBS diet intervention were compared through univariate analysis. Although abundance of many bacteria was comparable between responders and non-responders before traditional IBS diet intervention, the probe signal, indicative of bacterial abundance, of some bacteria was dissimilar. Before diet intervention Phascolarctobacterium tended to be more abundant in responders compared with non-responders while abundance of Firmicutes (Bacilli and Clostridia) tended to be higher in non-responders than responders (table 2). After intervention, only Eubacterium tended to be more abundant in non-responders compared with responders (76 (72–131) probe signal intensity (PSI) vs 69 (67–74) PSI; p=0.01, q=0.8). Analysis of bacterial changes after the traditional diet intervention in responders and non-responders, respectively, showed no significant alterations. Bacterial profile composition of all patients, irrespective of responsiveness, did not change after traditional IBS diet intervention (table 3). Data on bacterial abundance and dietary parameters for each patient both before and after the intervention were pooled and used to investigate how the dietary parameters, energy, protein, fat, carbohydrates, monosaccharides, glucose, dietary fibre, alcohol, fructose, galacto-oligosaccharides, fructans, polyols, lactose and overall FODMAP consumption impacted bacterial abundance. Correlations which held significance after correcting for multiple comparisons are presented (table 4).
Bacterial targets differing between responders and non-responders before traditional and low FODMAP diets
Bacterial targets significantly altered during dietary intervention irrespective of patient responsiveness
Correlations between bacteria and dietary parameters over the course of the intervention calculated using pooled data from before and after dietary advice for each subject
Non-responders exhibit increased abundance of certain bacteria compared with responders both before and after low FODMAP dietary intervention
Of all bacteria investigated, seven tended to be more abundant after correcting for multiple comparisons in non-responders to low FODMAP intervention compared with responders, both before and after intervention (table 2). These included Bacteroides stercoris, Pseudomonas, Acinetobacter and the sulfur-reducing anaerobic genus Desulfitispora. Additionally, six bacteria tended to be more abundant in non-responders compared with responders but only prior to the intervention (table 2). These included Streptococcus, Dorea and Ruminococcus gnavus. Comparing bacterial composition of all patients in the low FODMAP diet group, irrespective of response, the species Mycoplasma hominis tended to be lower while the genus Bifidobacterium and the phyla Actinobacteria were both significantly lower after the intervention as compared to before, as denoted by lower probe signal intensity (table 3).
All dietary intake parameters were significantly reduced after the low FODMAP intervention and we thus investigated if this correlated with bacterial abundance. Although many correlations were found, after correction for multiple comparisons, only Eubacterium, Dorea, Streptococcus and Bacteroides were found to be negatively correlated with dietary parameters such as monosaccharides and glucose, while Bifidobacterium and Actinobacteria were positively correlated with lactose (table 4).
Response to traditional IBS dietary advice, but not low FODMAP, improves DI
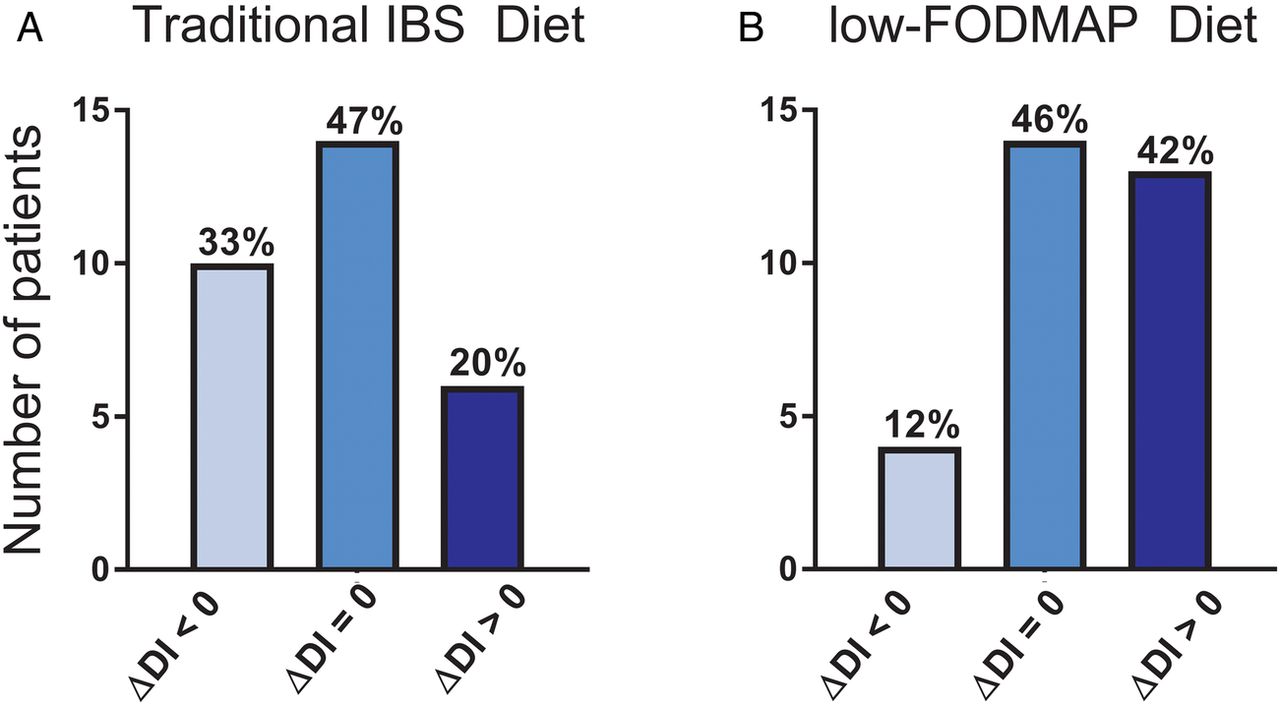
The GA-map Dysbiosis Test provides a DI analysis of study samples denoted by a DI score of 1–5. Patients following traditional IBS dietary advice were associated with reduced DI scores, whereas a low FODMAP diet was associated with increased DI scores irrespective of their intervention response (figure 3). However, when taking intervention responsiveness into consideration for both diets, approximately 50% of responders and non-responders were not associated with any change of their DI score after the intervention (table 5). However, while the frequencies of patients who were associated with higher DI scores after following a low FODMAP diet were equal among responders and non-responders, the frequency of non-responders to the traditional IBS diet who were associated with higher DI score was greater than responders (table 5). Moreover, responders and non-responders to the traditional IBS diet had similar DI scores both before (figure 4A) and after (figure 4B) the intervention. A similar comparison performed before (figure 4C) and after (figure 4D) the low FODMAP diet revealed that non-responders had consistently higher DI scores than responders. Additionally, comparing the responders before and after traditional IBS dietary advice showed no difference in DI scores (3 (3–3) vs 3 (3–3); p=0.26). This similarity in DI scores was also true for non-responders to traditional IBS diet (3 (2–4) vs 3 (2–4); p=0.56), as well as for responders (3 (2–4) vs 3 (2–4); p=0.56) and non-responders (3 (3–4) vs 3.5 (3–4); p=0.33) to the low FODMAP intervention.
Overview of responder and non-responder change in dysbiosis during intervention

Change in Dysbiosis Index scores from before to after the traditional IBS diet or low fermentable oligosaccharides, disaccharides, monosaccharides and polyols (FODMAP) intervention period. The composition of faecal bacteria was determined by the GA-map Dysbiosis Test22 in patients following traditional IBS dietary advice (n=30) low FODMAP (n=31) for 4 weeks. The difference in Dysbiosis Index scores was compared between patients following the two intervention diets. An improvement in dysbiosis and thus reduction in dysbiotic score was denoted as a negative change while a worsening and thus increase in dysbiotic score was indicated as a positive change. No change in Dysbiotic Index score was denoted by a 0.

Comparison of Dysbiosis Index between non-responders and responders both before and after the respective intervention diets. The composition of faecal bacteria was determined by the GA-map Dysbiosis Test22 in patients following traditional IBS dietary advice (n=30) or low fermentable oligosaccharides, disaccharides, monosaccharides and polyols (FODMAP) diet (n=31) for 4 weeks. Dysbiosis Index is scored between 1 and 5, where a score of 1 and 2 signifies normobiosis, 2.5 is on the boundary to being dysbiotic and 3–5 is dysbiotic of increasing severity. The number of patients within each Dysbiosis Index score group of non-responders and responders (A) before and (B) after traditional IBS dietary advice and (C) before and (D) and after low FODMAP diet. Y axis depicts absolute dysbiosis index values.
Discussion
This is the first study to demonstrate that gut bacteria profiles of adult patients with IBS responding to a low FODMAP dietary intervention differ from non-responders before starting the intervention. Additionally, the low FODMAP diet was associated with altered faecal bacteria and increased DI scores. Furthermore, patients who did not respond to the low FODMAP diet were characterised by higher DI scores before the intervention than those who responded. None of these findings was seen in the group following a traditional IBS diet.
In-depth analysis of gut bacteria generates a large amount of data and has a multitude of interlinked variables to consider. Furthermore, patients with IBS are notoriously heterogeneous as a cohort. Since this study focuses on both, multivariate statistical OPLS-DA was chosen and implemented as the best means to handle this large and complicated data set. We demonstrated that before a traditional IBS dietary intervention, faecal bacterial profiles of responders and non-responders were similar and thus had poor predictability/validation Q2 indices in an OPLS-DA model. This was not the case for responders and non-responders to a low FODMAP dietary intervention, whereby an OPLS-DA model's R2 and Q2 indices were high enough to validate the class separation. Thus, our data suggest that multivariate analysis of gut bacterial profiles might be used to predict responsiveness to dietary intervention and that severity of dysbiosis as defined by DI scores is associated with responsiveness to low FODMAP intervention in IBS. If this can be confirmed in future studies, only patients with a higher chance of treatment response should be selected for this rather restrictive exclusion diet after analysis of faecal bacterial composition.
To elucidate bacteria potentially driving differentiation between responders and non-responders, a deeper analysis was performed on bacterial profiles before and after the interventions. We demonstrated that before a low FODMAP intervention non-responders tended to exhibit a greater number of more abundant bacteria than responders including Streptococcus and Dorea, previously shown to be elevated in IBS25 and R. gnavus, a species suggested to be a potential biomarker for IBS.25 This is in contrast to a previous study in children with IBS demonstrating a greater number of abundant bacterial taxa in responders compared with non-responders before a low FODMAP intervention.26 The method used by Chumpitazi et al, identifying all sequences of the V3–V5 region, compared with the GA-map Dysbiosis Test which determines preidentified sequences of the V3–V7 regions of the 16S gene, might explain the differences between studies. In our study, a large proportion of bacteria tended to be more abundant both before and after the intervention in non-responders, suggesting potentially pathogenic or non-beneficial species from these genera might be hindering the responsiveness to a low FODMAP diet. The ability to classify responders from non-responders after a low FODMAP diet through multivariate analysis demonstrates that even after following the same dietary advice for 4 weeks the bacterial profiles are dissimilar. This leads to the hypothesis that there may be something more fundamentally different between the two groups which requires further investigation. Before traditional IBS dietary intervention, although Phascolarctobacterium and Firmicutes (Bacilli and Clostridia) tended to be more abundant in responders and non-responders, respectively, the lack of any other bacterial discrepancies corroborated with the multivariate bacterial model which depicted poor profile discrimination. We therefore conclude that there is most likely no major difference in faecal bacterial profiles between responders and non-responders to traditional dietary intervention.
Short-term interventions, like a traditional IBS diet, have previously been reported to only moderately impact gut bacteria27 ,28 contrary to a more restrictive intervention like a low FODMAP diet.29–31 This was also demonstrated in our study whereby microbial profiles of patients following traditional IBS dietary advice were not associated with any change after the intervention irrespective of responsiveness. In contrast, patients following the low FODMAP diet were associated with a lower abundance of Bifidobacteria and its taxonomic phyla Actinobacteria, which use FODMAPs in their metabolism.20 Interestingly, an extensive study by McIntosh et al32 comparing the impact of high and low FODMAP diets on gut bacteria found decreased Bifidobacteria yet increased Actinobacteria richness after a low FODMAP diet compared with a high FODMAP diet. Although not all strains of Bifidobacteria have documented beneficial effects, Bifidobacterium strains, for example, Bifidobacterium infantis 35624 and Bifidobacterium animalis DN-173 010, have been demonstrated to alleviate IBS symptoms in some patients with IBS upon supplementation.33–35 Thus, a reduction in abundance of this probiotic genera may be why symptom improvement was not seen in all patients following a low FODMAP diet. Furthermore, reduction of a whole phylum of bacteria will likely impact the bacterial community36 and may reduce other populations of bacteria, as indicated by the higher DI scores observed in some patients following the low FODMAP diet.
Dysbiosis has been suggested to be present in at least subsets of patients with IBS as indicated by altered bacterial abundance compared with healthy subjects.7 We used a DI to evaluate if intervention diets were associated with any shift of the bacterial profiles of patients with IBS. While the DI itself is not a tool for identifying changes in specific bacteria, it provides a numeric score of how the composition of a bacterial profile is in relation to that of healthy subjects. In patients following the traditional IBS dietary advice, DI scores were associated with a marginal decrease after the intervention, but the majority of those who had increased DI scores were non-responders. As previously mentioned, while the composition of a traditional IBS diet is not so different from a normal diet, the inherent regularity of the small meals may account for decreased DI scores found in the patients.
Patients following the low FODMAP diet, experiencing a more drastic dietary change, were associated with a general increase in DI scores. The measurable depletion in the abundance of certain bacteria20 and increase in DI scores after the low FODMAP intervention, irrespective of responsiveness, is corroborative data not only from a clinical perspective but also from a microbiologist and dietician perspective. However, the change in DI scores only occurred in 50% of the subjects following the low FODMAP diet. The explanation for this was neither bad compliance nor a habitual diet low in FODMAPs since significant decrease in FODMAP consumption during the intervention was documented.14 Also, a prior diet excessively restricting specific nutrients (eg, low in FODMAPs, gluten-free, vegan diet) was an exclusion factor in the study. Nevertheless, we cannot rule out that the influence of other factors, unrelated to ingestion of carbohydrates, not controlled for in this study, may have affected the study outcome.
The finding that non-responding patients tended to have higher DI scores than responding patients among both intervention groups is indeed interesting and suggests that some non-responding patients might be ‘too dysbiotic’ for dietary intervention and may benefit more from other therapies. Although speculative, a gut bacterial composition shifted too far from the healthy norm whereby even a change in diet fails to bring the composition back to that of a healthy one is plausible but requires further investigation.
Although many correlations were identified between dietary parameters and bacteria, many did not hold true after performing statistical correction for multiple comparisons. Nevertheless, Eubacterium was shown to have a negative correlation with carbohydrates, monosaccharides, fructose and glucose, respectively. This is contrary to prior findings reporting a reduction in Eubacterium in non-IBS obese patients following diets low in carbohydrates indicating a positive correlation.37 ,38 Importantly, correlations between bacterial groups and different sugar molecules may be a secondary finding due to alteration in abundance in other bacteria and/or their products of metabolism which are not included in the GA-map Dysbiosis Test or found primarily in the small intestine. Interestingly, Bifidobacterium correlating with lactose is in line with a previous study using culture supernatants whereby Bifidobacterium was observed to prefer lactose over glucose as the primary carbon source.39 Moving forward, it would thus be interesting to investigate if a less restrictive low FODMAP diet can reduce IBS symptoms while retaining consumption of lactose in order to preserve the beneficial Bifidobacterium populations of the gut.
This study of course has limitations. The cohort size was relatively small when taking into account the subgrouping of patients into the respective dietary intervention groups and then subsequently as responders and non-responders. Further, while patients were advised to follow the instructions of the respective diets and we were able to track their eating habits with food diaries, these were kept only during the first and last four days of the screening and intervention period and since we did not provide all the food during the course of the intervention we were unable to check for compliance during the remaining days of the intervention period. However, this is a common feature in most dietary intervention studies and would likely have occurred in both responders and non-responders. Furthermore, although the GA-map Dysbiosis Test has limitations since it is bound to determine abundance of preidentified sequences as previously discussed, it was specifically developed to analyse abundance of gut bacteria and has a straightforward process which translates to a clinical setting creating standardised patient bacterial profiles. Ideally, other means to identify gut dysbiosis such as through whole 16S bacterial sequencing which also delivers α and β diversity values are needed to confirm our findings yet these are less optimal for envisioned clinical interpretation. The diets of the healthy Nordic (Norwegian and Swedish) control reference group used in the creation of the GA-map Dysbiosis Test are unknown,22 but we can assume that they were eating standard Scandinavian diets similar to that of the Swedish subjects included in our study before the interventions. Therefore, there is little concern that differing diets between the two cohorts has interfered with the DI scores recorded. Finally, factors other than the effects of a lowered intake of FODMAPs per se, such as non-specific effects from being included in a study and other physiological effects of dietary changes not associated with microbiota composition, likely helped in the improvement of symptoms in responders. Additionally, while baseline variables such as age and severity of IBS were not adjusted for, they were similar between responders and non-responders and any impact of these is described in detail in our previous study.14 Finally, since some findings of this study are not from the randomised phase, for example, correlation of diet with bacterial abundance, potential confounding bias inherent to studies of this nature must be acknowledged. Even after considering these limitations and even the possibility of chance, we are confident that the study design has a high likelihood of fulfilling the aim of this study, which was to record the impact of dietary change on gut bacteria and determine if bacterial profiles predict intervention response. Identification and a detailed description of the mechanism behind symptom improvement after dietary changes in IBS are still lacking.
In summary, our study may demonstrate that before a low FODMAP, but not a traditional IBS dietary intervention, non-responders have faecal bacterial profiles distinct from patients responding favourably. Moreover, altered bacteria contributing to profile discrimination tended to be more abundant in low FODMAP non-responders compared with responders. Additionally, low FODMAP, but not traditional, dietary advice was associated with a reduced abundance of some bacteria and increased DI scores in patients after intervention irrespective of responsiveness. Finally, although future studies are required to test the robustness of our findings, our study suggests the potential ability to identify responders to a low FODMAP diet through faecal bacterial profile multivariate analyses.
References
Footnotes
Contributors SB: data acquisition, assemblage of database, interpretation of data and drafting and finalising of manuscript. Has approved the final draft submitted. LB: assemblage of database. Has approved the final draft submitted. HT: collection of study subject materials, interpretation of data and finalising of manuscript. Has approved the final draft submitted. SS, TL and LC: data acquisition. Have approved the final draft submitted. PL and HT: data acquisition and manuscript finalisation. Has approved the final draft submitted. LÖ: project planning, interpretation of data, drafting and finalising of manuscript. Has approved the final draft submitted. MS: project planning, interpretation of data, material acquisition, drafting and finalising of manuscript. Has approved the final draft submitted.
Funding The Swedish Medical Research Council (grants 13409, 21691 and 21692); AFA insurance (140330); VINNOVA (11-03475); The Marianne and Marcus Wallenberg Foundation, University of Gothenburg; Centre for Person-Centred Care (GPCC), Sahlgrenska Academy, University of Gothenburg; The Faculty of Medicine, University of Gothenburg.
Competing interests MS has received unrestricted research grants from Danone, and Ferring Pharmaceuticals and served as a Consultant/Advisory Board member for AstraZeneca, Danone, Nestlé, Chr Hansen, Almirall, Allergan, Albireo, Glycom and Shire, and as a speaker for Tillotts, Takeda, Menarini, Allergan, Shire and Almirall. HT has served as Consultant/Advisory Board member for Almirall, Allergan, Danone and Shire. LÖ has served as Consultant/Advisory Board member for Genetic Analysis, has received unrestricted research grants from AstraZeneca, and as a speaker for Takeda, AbbVie and Meda. PL has served as Consultant/Advisory Board member for Almirall, Allergan, Abbvie and Shire.
Ethics approval The regional ethics board.
Provenance and peer review Not commissioned; externally peer reviewed.