


Abstract
Using a time-dependent approach, we investigated all-site and site-specific cancer incidence in a large population stratified by diabetes status. The study analyzed a closed cohort comprised of Israelis aged 21–89 years, enrolled in a health fund, and followed from 2002 to 2012. Adjusting for age, ethnicity, and socioeconomic status, we calculated hazard ratios for cancer incidence using Cox regression separately for participants with prevalent and incident diabetes; the latter was further divided by time since diabetes diagnosis. Of the 2,186,196 individuals included in the analysis, 159,104 were classified as having prevalent diabetes, 408,243 as having incident diabetes, and 1,618,849 as free of diabetes. In both men and women, diabetes posed an increased risk of cancers of the liver, pancreas, gallbladder, endometrium, stomach, kidney, brain (benign), brain (malignant), colon/rectum, lung (all, adenocarcinoma, and squamous cell carcinoma), ovary, and bladder, as well as leukemia, multiple myeloma, non-Hodgkin lymphoma, and breast cancer in postmenopausal women. No excess risk was observed for breast cancer in premenopausal women or for thyroid cancer. Diabetes was associated with a reduced risk of prostate cancer. Hazard ratios for all-site and site-specific cancers were particularly elevated during the first year following diabetes diagnosis. The findings of this large study with a time-dependent approach are consistent with those of previous studies that have observed associations between diabetes and cancer incidence.
The association between diabetes and cancer is well established (1, 2). In recent publications, investigators have reported increased risks, among persons with diabetes, of cancers of the breast (3, 4), colon/rectum (4–6), endometrium (3, 7, 8), stomach (9–11), bladder (12–16), liver (6, 17–19), pancreas (6, 20–23), lung (24), ovary (25), kidney (26), gallbladder (6, 17), and (in women) thyroid (27); there are also reports of a reduced risk of prostate cancer (28–31). Although most of the reported associations are modest in magnitude, they have great clinical and public health importance because of the high prevalence of diabetes in many populations and the serious implications of a cancer diagnosis.
Several studies have shown higher rates of cancer incidence in the first years after diabetes diagnosis, followed by lower rates in subsequent years (14, 17, 18). Others have excluded from analysis the early period following diabetes diagnosis, ranging from 3 months (32, 33) to 2 years (21), to account for possible reverse causality. Here, we report results from the application of a time-dependent approach that accounted for diabetes duration and secular change in cancer incidence rates in a large nationwide cohort followed for 11 years. The large size of this population allowed more precise risk assessment for common cancers and enabled us to assess risk of less common cancers.
METHODS
The study was based on electronic records from the largest health maintenance organization in Israel, Clalit Health Services (Tel Aviv, Israel), which insures and provides health care to 53% (4.3 million) of the nation's population. All persons aged 21–89 years and registered with Clalit on January 1, 2002 (the date of study entry), without a previous history of cancer, were included in a closed cohort that was followed until December 31, 2012.
All individuals were followed for cancer incidence, which was ascertained by record linkage to the Israel National Cancer Registry. Established in 1960, the registry has benefited since 1982 from a national law mandating registration of cancer cases; it has greater than 95% coverage of solid tumors and approximately 85% coverage of hematologic cancers (34).
Definitions of diabetes
Incident diabetes was defined as fulfillment of at least 1 of the following 6 criteria during 2002–2012: 1) diabetes diagnosis recorded in the Clalit Chronic Disease Registry; 2) a physician's diagnosis of diabetes and a plasma glucose test result greater than 125 mg/dL within the past 12 months; 3) a hemoglobin A1c measurement of 6.5% or higher; 4) a 2-hour plasma glucose level of at least 200 mg/dL during an oral glucose tolerance test; 5) 3 or more purchases of glucose-lowering medication within 12 months of each other; and 6) 2 plasma glucose measurements higher than 125 mg/dL within 12 months of each other. The date of the earliest defining criterion was considered the date of diagnosis.
Prevalent diabetes was defined as having a diagnosis of diabetes recorded in the Clalit Chronic Disease Registry at study entry or fulfilling criterion 5 above before study entry. Information on medication use was available from 1998 onward.
Types of cancer
Cancer diagnoses were identified by International Classification of Diseases for Oncology codes. The following types of cancer were investigated: liver (codes C22.0 and C22.1), pancreas (C25.0–C25.9), gallbladder (C23.9–C24.9), endometrium (C54.0–C54.9, C55.9), stomach (C16.0–C16.9), kidney (C64.9, C65.9, C66.9, and C68.0–C68.9), brain and central nervous system (C70.0–C72.9 with behavior code 0 for benign), brain (C70.0–C72.9 with behavior code 3 for malignant), multiple myeloma (C42.1 with relevant morphology codes), colon/rectum (C18.0–C21.8), non-Hodgkin lymphoma (C02.4, C09.8. C09.9, C11.1, C14.2, C37.9, C42.2, C77, and all other sites for extranodal non-Hodgkin lymphoma), lung (all: C34.0–C34.9; adenocarcinoma and squamous cell carcinoma), leukemia (C42.0, C42.1, and C42.2 with relevant morphology codes), ovary (C56.9), bladder (C67.0–C67.9), breast (C50.0–C50.9), thyroid (C73.9), and prostate (C61.9). Apart from benign brain tumors, all cancers included in the analysis were coded as invasive (behavior code 3).
Statistical analyses
Preliminary analyses were performed to examine distributions of variables, check the plausibility of values, and decide which categories to use. To estimate hazard ratios for cancer for persons with diabetes versus those without diabetes, we applied Cox regression models, with adjustments for age (in 5-year age groups), ethnic origin (country of birth or mother's country of birth: Ashkenazi Jews (Russia, Eastern Europe, Europe, America, or South Africa); Sephardic Jews (mid and northern Africa or the Middle East); Yemenite Jews; Ethiopian and Central African Jews; Israeli Jews (including Israel-born Jews whose mothers’ birthplaces were unknown); and Israeli Arabs), and socioeconomic status (SES), categorized according to locality of the Clalit clinic (low, medium, or high). Persons with missing SES values (3.3%) were included in the analysis using a “missing” category for the variable. Adjustment for smoking status (ever smoked vs. never smoked or not known) was performed for lung and bladder cancer, and adjustment for parity (0, 1, 2–3, ≥4) was performed for breast, endometrial, and ovarian cancer. Information on hysterectomy and oophorectomy was used to define women at risk of uterine and ovarian cancer; women who had hysterectomies before 2002 were excluded from analyses of these cancers, and those who had hysterectomies during 2002–2012 with no ovarian cancer were censored at the time of hysterectomy.
Information on body mass index (BMI; weight (kg)/height (m)2) was available, but its quality was sufficient only from 2005 onward. Therefore, a sensitivity analysis of the hazard ratios that were adjusted for BMI was conducted based on BMI values recorded in 2005–2008 and a follow-up of cancer incidence in 2009–2012. Similarly, a major update of smoking information occurred in 2007–2008, and a sensitivity analysis was conducted adjusting for smoking information recorded up to and including 2008, with a follow-up of cancer incidence in 2009–2012. For the BMI adjustment analysis, we excluded persons with prevalent diabetes in order to avoid the possibility of reverse causality (i.e., a diabetes diagnosis’ influencing BMI). For the smoking adjustment this was unnecessary, because a “past smoker” classification would in most cases have preceded the diabetes diagnosis.
The time origin for the model was the date of study entry. Incident diabetes status was a time-dependent variable. Additional time-dependent variables were entered to distinguish between the first, second, and subsequent years following diabetes diagnosis. This allowed verification that hazard ratios had stabilized by 2 years after diabetes diagnosis. Patients were included in the risk sets until diagnosis of a specific cancer, death, their 90th birthday, or December 31, 2012, whichever occurred first.
The Cox regression analyses were performed using PROC PHREG in SAS, version 9.2 (SAS Institute, Inc., Cary, North Carolina). To avoid excessively long run times when analyzing this massive data set, events were grouped into 6-month periods and the Breslow method was used for handling tied event times.
To investigate whether men with diabetes underwent increased surveillance for prostate cancer, we examined prostate-specific antigen testing during a selected year—2008—comparing men diagnosed with diabetes in the years 2003, 2007, 2008, and 2009 with men who remained free of diabetes during the study period. Proportions were compared using generalized estimating equations for logistic regression with adjustment for age, SES, and ethnic origin. P values for the comparisons were 2-sided.
For the slowly progressing cancers, thyroid and prostate, the increased detection of cancer events during the initial period following diabetes diagnosis may decrease the number of events that remain to be diagnosed in subsequent years, resulting in spuriously lower hazard ratios. For these cancers, the overall 10-year relative risks were estimated using the method described in the Appendix. Standard errors and confidence limits were computed using the delta method.
RESULTS
A total of 2,284,402 members of Clalit Health Services were aged 21–89 years on January 1, 2002. Figure 1 shows the numbers of persons classified as having diabetes (prevalent or incident) and remaining free of diabetes. The 95,733 patients who had cancer prior to study entry and the 2,473 with missing data on ethnicity were excluded from the analysis. The remaining 2,186,196 individuals were included in the analysis; 47.3% were men and 52.7% women.
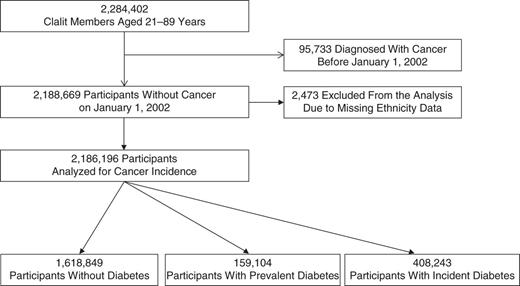
Selection of a study population of Israeli men and women medically insured by Clalit Health Services, Israel, 2002–2012. Individuals with diabetes at study entry, January 1, 2002, were designated as having prevalent diabetes. A designation of incident diabetes was made if the participant met at least 1 of 6 predefined criteria during the study period.
Demographic characteristics and numbers of cancer events according to diabetes status are presented in Table 1. Compared with persons free of diabetes throughout the study, those with prevalent diabetes (diagnosed before 2002) were older, affiliated with clinics in lower-SES localities, and less likely to have reported smoking. Individuals diagnosed with diabetes during the study period reported smoking more often.
Characteristics of a Population of Men and Women Aged 21–89 Years, Excluding Those With a Diagnosis of Cancer Before 2002, According to Diabetes Status, Clalit Health Services, Israel, 2002–2012
| Characteristic or Cancer Site | Diabetes Status | |||||
|---|---|---|---|---|---|---|
| Free of Diabetes (n = 1,618,849) | Prevalent Diabetes (n = 159,104) | Incident Diabetes (n = 408,243) | ||||
| No. | % | No. | % | No. | % | |
| Person-years in final analysis | 18,775,745 | 1,321,520 | 1,986,950 | |||
| Age, yearsa | 42.6 (16.5) | 63.8 (12.9) | 55.9 (15.7) | |||
| Sex | ||||||
| Men | 765,483 | 47.3 | 74,756 | 47.0 | 193,835 | 47.5 |
| Women | 853,366 | 52.7 | 84,348 | 53.0 | 214,408 | 52.5 |
| Ethnic originb | ||||||
| Ashkenazi Jews | 460,186 | 28.4 | 55,897 | 35.1 | 135,239 | 33.1 |
| Sephardic Jews | 411,870 | 25.4 | 46,274 | 29.1 | 109,873 | 26.9 |
| Yemenite Jews | 41,555 | 2.6 | 7,061 | 4.4 | 15,485 | 3.8 |
| Ethiopian and Central African Jews | 22,743 | 1.4 | 1,258 | 0.8 | 5,882 | 1.4 |
| Israeli Jews | 390,723 | 24.1 | 22,946 | 14.4 | 70,999 | 17.4 |
| Israeli Arabs | 291,772 | 18.0 | 25,668 | 16.1 | 70,765 | 17.3 |
| Socioeconomic status | ||||||
| Low | 640,299 | 39.6 | 69,323 | 43.6 | 176,735 | 43.3 |
| Medium | 627,953 | 38.8 | 61,681 | 38.8 | 153,193 | 37.5 |
| High | 293,489 | 18.1 | 23,828 | 15.0 | 67,315 | 16.5 |
| Missing | 57,108 | 3.5 | 4,272 | 2.7 | 11,000 | 2.7 |
| Smoking | ||||||
| Never smoker or missing | 1,110,945 | 68.6 | 116,179 | 73.0 | 267,365 | 65.5 |
| Past or current smoker | 507,904 | 31.4 | 42,925 | 27.0 | 140,878 | 34.5 |
| Incident cancer | ||||||
| All sites | 63,178 | 100.0 | 16,785 | 100.0 | 48,812 | 100.0 |
| Breast—postmenopausal | 8,959 | 14.2 | 1,938 | 11.5 | 5,619 | 11.5 |
| Breast—premenopausal | 3,168 | 5.0 | 57 | 0.3 | 858 | 1.8 |
| Colon/rectum | 7,950 | 12.6 | 2,712 | 16.2 | 8,208 | 16.8 |
| Prostate | 7,475 | 11.8 | 1,707 | 10.2 | 5,229 | 10.7 |
| Lung—all | 5,196 | 8.2 | 1,453 | 8.7 | 4,542 | 9.3 |
| Adenocarcinoma | 1,742 | 2.8 | 422 | 2.5 | 1,638 | 3.4 |
| Squamous cell carcinoma | 824 | 1.3 | 274 | 1.6 | 855 | 1.8 |
| Non-Hodgkin lymphoma | 3,192 | 5.1 | 867 | 5.2 | 2,549 | 5.2 |
| Bladder | 2,949 | 4.7 | 1,043 | 6.2 | 2,815 | 5.8 |
| Thyroid | 2,378 | 3.8 | 221 | 1.3 | 969 | 2.0 |
| Kidney | 1,847 | 2.9 | 581 | 3.5 | 1,602 | 3.3 |
| Stomach | 1,792 | 2.8 | 672 | 4.0 | 1,615 | 3.3 |
| Leukemia | 1,645 | 2.6 | 480 | 2.9 | 1,462 | 3.0 |
| Corpus uteri | 1,641 | 2.6 | 572 | 3.4 | 1,469 | 3.0 |
| Brain, benign | 1,404 | 2.2 | 394 | 2.3 | 857 | 1.8 |
| Brain, malignant | 1,105 | 1.7 | 195 | 1.2 | 742 | 1.5 |
| Pancreas | 1,224 | 1.9 | 790 | 4.7 | 2,083 | 4.3 |
| Ovary | 945 | 1.5 | 206 | 1.2 | 765 | 1.6 |
| Multiple myeloma | 836 | 1.3 | 331 | 2.0 | 1,016 | 2.1 |
| Liver | 451 | 0.7 | 306 | 1.8 | 526 | 1.1 |
| Gallbladder | 365 | 0.6 | 184 | 1.1 | 431 | 0.9 |
| All other | 6,090 | 9.6 | 1,380 | 8.2 | 2,962 | 6.1 |
a Values are presented as mean (standard deviation).
b Country of birth or mother's country of birth: Ashkenazi Jews (Russia, Eastern Europe, Europe, America, or South Africa); Sephardic Jews (mid and northern Africa or the Middle East); Israeli Jews (including Israel-born Jews whose mothers’ birthplaces were unknown).
The numbers of events for each type of cancer, with hazard ratios for cancer incidence according to diabetes status, are reported in Table 2 (women) and Table 3 (men). There were 55 fewer cancers in total than are shown in Table 1, because in the Cox analysis observations were censored at age 90 years and these 55 cancers were diagnosed in persons over 89 years of age. For both men and women with incident diabetes, hazard ratios for all-site and site-specific cancers were particularly elevated during the first year following diabetes diagnosis. Hazard ratios calculated for years 2–11 following diabetes diagnosis were similar to hazard ratios for the group with prevalent diabetes. Hazard ratios for women were higher than hazard ratios for men for all-site cancer (hazard ratio (HR) = 1.42 (95% confidence interval (CI): 1.38, 1.46) for women vs. HR = 1.33 (95% CI: 1.29, 1.36) for men) but similar for all the site-specific cancers examined. Hazard ratios were particularly elevated for liver (HR = 2.94 (95% CI: 2.17, 3.97) for women vs. HR = 2.27 (95% CI: 1.80, 2.86) for men), pancreatic (HR = 2.90 (95% CI: 2.49, 3.37) for women vs. HR = 2.91 (95% CI: 2.52, 3.37) for men), and gallbladder cancers (HR = 1.85 (95% CI:1.37, 2.49) for women vs. HR = 1.89 (95% CI: 1.35, 2.66) for men). Diabetes was not associated with excess risk of thyroid cancer (HR = 1.06 (95% CI: 0.91, 1.24) for women vs. HR = 1.25 (95% CI: 0.97, 1.61) for men) or with breast cancer in premenopausal women (HR = 1.02, 95% CI: 0.86, 1.20). Diabetes was associated with a reduced risk of prostate cancer (HR = 0.89, 95% CI: 0.84, 0.95). For all other types of cancer examined and for breast cancer in postmenopausal women, diabetes was associated with an increased risk compared with no diabetes.
Hazard Ratios for All Cancers and Site-Specific Cancers Among Women, Adjusted for Age, Socioeconomic Status, and Ethnic Group (n = 1,152,122), Clalit Health Services, Israel, 2002–2012
| Cancer Site | No. of Events | Incident Diabetes | Prevalent Diabetes | ||||||
|---|---|---|---|---|---|---|---|---|---|
| <1 Years of Follow-up | 1–<2 Years of Follow-up | 2–11 Years of Follow-up | |||||||
| HR | 95% CI | HR | 95% CI | HR | 95% CI | HR | 95% CI | ||
| All sites | 64,921 | 4.50 | 4.39, 4.61 | 1.45 | 1.37, 1.52 | 1.42 | 1.38, 1.46 | 1.41 | 1.38, 1.45 |
| Liver | 440 | 8.22 | 6.28, 10.76 | 2.02 | 1.09, 3.73 | 2.94 | 2.17, 3.97 | 3.50 | 2.74, 4.48 |
| Pancreas | 1,959 | 15.24 | 13.60, 17.08 | 5.37 | 4.38, 6.58 | 2.90 | 2.49, 3.37 | 3.10 | 2.72, 3.52 |
| Gallbladder | 520 | 8.20 | 6.53, 10.29 | 1.97 | 1.16, 3.33 | 1.85 | 1.37, 2.49 | 2.14 | 1.69, 2.72 |
| Corpus uteria | 3,016 | 4.68 | 4.17, 5.24 | 1.79 | 1.43, 2.23 | 1.79 | 1.58, 2.02 | 1.93 | 1.74, 2.15 |
| Stomach | 1,607 | 6.68 | 5.84, 7.64 | 1.16 | 0.80, 1.67 | 1.42 | 1.18, 1.69 | 1.90 | 1.65, 2.19 |
| Kidney | 1,456 | 5.45 | 4.68, 6.34 | 1.73 | 1.26, 2.38 | 1.58 | 1.32, 2.90 | 1.85 | 1.60, 2.16 |
| Brain, benign | 1,857 | 3.72 | 3.20, 4.32 | 1.39 | 1.03, 1.89 | 1.24 | 1.04, 1.49 | 1.69 | 0.48, 1.94 |
| Multiple myeloma | 970 | 7.13 | 6.01, 8.44 | 2.23 | 1.57, 3.16 | 1.69 | 1.36, 2.09 | 1.58 | 1.30, 1.92 |
| Colon/rectum | 9,019 | 6.33 | 6.00, 6.70 | 1.36 | 1.18, 1.56 | 1.44 | 1.33, 1.55 | 1.48 | 1.39, 1.57 |
| Non-Hodgkin lymphoma | 3,263 | 5.11 | 4.62, 5.66 | 1.38 | 1.09, 1.74 | 1.40 | 1.24, 1.58 | 1.48 | 1.33, 1.65 |
| Lungb | |||||||||
| All | 3,628 | 5.77 | 5.27, 6.31 | 1.67 | 1.37, 2.03 | 1.45 | 1.30, 1.62 | 1.30 | 1.17, 1.44 |
| Adenocarcinoma | 1,601 | 6.27 | 5.48, 7.18 | 1.88 | 1.42, 2.50 | 1.48 | 1.25, 1.74 | 1.22 | 1.03, 1.44 |
| Squamous cell carcinoma | 391 | 6.09 | 4.60, 8.06 | 2.33 | 1.37, 3.96 | 2.15 | 1.58, 2.93 | 1.48 | 1.08, 2.03 |
| Leukemia | 1,513 | 5.52 | 4.78, 6.37 | 1.51 | 1.09, 2.09 | 1.68 | 1.41, 2.01 | 1.40 | 1.20, 1.64 |
| Ovarya | 1,495 | 5.93 | 5.14, 6.85 | 1.05 | 0.70, 1.58 | 1.56 | 1.29, 1.88 | 1.39 | 1.18, 1.64 |
| Brain, malignant | 947 | 6.39 | 5.35, 7.64 | 1.80 | 1.21, 2.67 | 1.28 | 1.00, 1.63 | 1.25 | 1.00, 1.56 |
| Bladder | 1,213 | 3.01 | 2.50, 3.62 | 0.91 | 0.59, 1.39 | 1.31 | 1.08, 1.60 | 1.16 | 0.98, 1.37 |
| Breasta | |||||||||
| Premenopausal | 4,083 | 3.36 | 2.90, 3.90 | 1.02 | 0.72, 1.44 | 1.02 | 0.86, 1.20 | 0.89 | 0.69, 1.16 |
| Postmenopausal | 15,858 | 2.10 | 1.98, 2.23 | 1.14 | 1.02, 1.26 | 1.29 | 1.22, 1.36 | 1.12 | 1.06, 1.18 |
| Thyroid | 2,702 | 2.91 | 2.50, 3.38 | 1.04 | 0.76, 1.42 | 1.06 | 0.91, 1.24 | 1.00 | 0.84, 1.18 |
Abbreviations: CI, confidence interval; HR, hazard ratio.
a Also adjusted for number of children.
b Also adjusted for smoking.
Hazard Ratios for All Cancers and Site-Specific Cancers Among Men, Adjusted for Age, Socioeconomic Status, and Ethnic Group (n = 1,034,074), Clalit Health Services, Israel, 2002–2012
| Cancer Site | No. of Events | Incident Diabetes | Prevalent Diabetes | ||||||
|---|---|---|---|---|---|---|---|---|---|
| <1 Years of Follow-up | 1–<2 Years of Follow-up | 2–11 Years of Follow-up | |||||||
| HR | 95% CI | HR | 95% CI | HR | 95% CI | HR | 95% CI | ||
| All sites | 63,799 | 4.27 | 4.18, 4.37 | 1.46 | 1.39, 1.53 | 1.33 | 1.29, 1.36 | 1.28 | 1.25, 1.31 |
| Liver | 807 | 7.34 | 6.05, 8.91 | 2.85 | 1.99, 4.09 | 2.27 | 1.80, 2.86 | 3.00 | 2.49, 3.61 |
| Pancreas | 1,969 | 13.88 | 12.36, 15.57 | 3.45 | 2.12, 4.36 | 2.91 | 2.52, 3.37 | 3.25 | 2.85, 3.69 |
| Gallbladder | 412 | 9.53 | 7.45, 12.20 | 2.45 | 1.44, 4.17 | 1.89 | 1.35, 2.66 | 2.19 | 1.65, 2.90 |
| Stomach | 2,343 | 6.06 | 5.43, 6.76 | 1.79 | 1.42, 2.25 | 1.45 | 1.26, 1.67 | 1.69 | 1.50, 1.90 |
| Kidney | 2,485 | 5.20 | 4.65, 5.82 | 1.59 | 1.26, 2.02 | 1.48 | 1.30, 1.69 | 1.51 | 1.34, 1.71 |
| Brain, benign | 748 | 3.41 | 2.71, 4.30 | 1.33 | 0.84, 2.11 | 1.40 | 1.08, 1.81 | 1.49 | 1.20, 1.85 |
| Multiple myeloma | 1,164 | 6.72 | 5.75, 7.86 | 1.94 | 1.40, 2.70 | 1.71 | 1.41, 2.07 | 1.80 | 1.52, 2.14 |
| Colon/rectum | 9,232 | 5.90 | 5.59, 6.24 | 1.58 | 1.40, 1.79 | 1.58 | 1.47, 1.69 | 1.45 | 1.37, 1.55 |
| Non-Hodgkin lymphoma | 3,210 | 5.53 | 5.01, 6.10 | 1.24 | 0.98, 1.58 | 1.41 | 1.25, 1.59 | 1.50 | 1.35, 1.68 |
| Lunga | |||||||||
| All | 7,294 | 5.61 | 5.28, 5.97 | 1.64 | 1.44, 1.87 | 1.19 | 1.10, 1.29 | 1.26 | 1.17, 1.35 |
| Adenocarcinoma | 2,136 | 5.78 | 5.16, 6.47 | 1.79 | 1.42, 2.25 | 1.18 | 1.03, 1.36 | 1.12 | 0.97, 1.29 |
| Squamous cell carcinoma | 1,540 | 5.99 | 5.25, 6.84 | 1.33 | 0.97, 1.83 | 1.35 | 1.15, 1.60 | 1.36 | 1.17, 1.58 |
| Leukemia | 1,941 | 4.60 | 4.04, 5.24 | 2.11 | 1.67, 2.67 | 1.42 | 1.22, 1.66 | 1.38 | 1.21, 1.59 |
| Brain, malignant | 1,062 | 6.51 | 5.51, 7.69 | 1.59 | 1.08, 2.35 | 1.52 | 1.22, 1.89 | 1.17 | 0.94, 1.46 |
| Bladder | 5,367 | 3.05 | 2.80, 3.32 | 1.40 | 1.20, 1.63 | 1.25 | 1.14, 1.37 | 1.27 | 1.18, 1.38 |
| Thyroid | 833 | 3.55 | 2.80, 4.50 | 1.50 | 0.97, 2.33 | 1.25 | 0.97, 1.61 | 1.04 | 0.79, 1.37 |
| Prostate | 14,099 | 1.65 | 1.55, 1.76 | 0.93 | 0.84, 1.03 | 0.89 | 0.84, 0.95 | 0.80 | 0.76, 0.85 |
Abbreviations: CI, confidence interval; HR, hazard ratio.
a Also adjusted for smoking.
Results of the sensitivity analyses in which we adjusted for BMI and smoking are shown in Supplementary Data (available at http://aje.oxfordjournals.org/). They show only modest, insubstantial changes from the hazard ratios that are presented in Table 2 and Table 3.
The proportion of men who had prostate-specific antigen testing in 2008 was higher (P < 0.001) among those who were diagnosed with diabetes during 2008 (42.4%; n = 5,063) than among those diagnosed with diabetes in 2003 (33.8%; n = 3,820), 2007 (35.1%; n = 4,425), or 2009 (33.0%; n = 3,568) or who remained free of diabetes (30.6%; n = 76,844). The differences between men with and without diabetes were maintained after adjustment for age, SES, and ethnic origin (odds ratio = 1.7, 95% CI: 1.6, 1.7).
The 10-year estimated relative risks of thyroid cancer, starting from diabetes diagnosis, were 1.24 (95% CI: 1.09, 1.39) for women and 1.51 (95% CI: 1.22, 1.80) for men, compared with estimated relative risks close to (and not significantly different from) 1.0 for persons with prevalent diabetes and for the 2–11 years following diagnosis among persons with incident diabetes. The relative risk for prostate cancer was 0.97 (95% CI: 0.93, 1.02) for the same 10-year inclusive period, compared with estimated relative risks substantially (and significantly) below 1.0 for persons with prevalent diabetes and for the 2–11 years following diagnosis in persons with incident diabetes.
DISCUSSION
In this very large population-based study with 11 years of follow-up, Cox regression hazard ratios were higher in men and women with diabetes for all-site cancer, as well as for a number of site-specific cancers, including cancers of the liver, pancreas, gallbladder, endometrium, stomach, kidney, brain (benign and malignant), colon/rectum, lung (overall, adenocarcinoma, and squamous cell carcinoma), ovary, and bladder as well as for breast cancer in postmenopausal women, leukemia, multiple myeloma, and non-Hodgkin lymphoma. The rates of cancer were particularly high in the first year following diabetes diagnosis, decreased somewhat in the second year, and remained elevated thereafter. Hazard ratios for all-site cancer incidence were higher for women with diabetes than for men with diabetes, probably due to the decreased risk of prostate cancer among men with diabetes; notable differences were not observed between the sexes in the hazard ratios of any other type of cancer.
The main strengths of this study were the large size of the cohort and the time-dependent analytical approach. Duration from diagnosis of diabetes was assessed by following incidence in a general population. Rates of cancer were calculated separately for persons who were diagnosed with diabetes before the study index date, for individuals who were diagnosed with diabetes during the study period, and for those who remained free of diabetes. Statistical adjustments were made for several factors that could affect cancer incidence. The comprehensive definition of diabetes was based on a number of criteria and likely was highly sensitive. However, it is possible that a small proportion of individuals without diabetes were misclassified as having diabetes, reducing the specificity. Any misclassification of diabetes status would be expected to lead to underestimation of the true association of diabetes with cancer incidence. Data were not available to distinguish between the types of diabetes; thus, individuals with type 1 diabetes and women with gestational diabetes were included in the diabetes groups. However, the proportion of such cases within our diabetes group is expected to have been small, and their inclusion is therefore not expected to have had much impact on the results. Only 3.5% of adults with diabetes in Western countries are estimated to have type 1 diabetes. We estimate that in Israel approximately 5% of all incident diabetes cases in women of reproductive age are gestational. Both diabetes diagnosis and cancer diagnosis were ascertained according to patient records, which do not account for the duration or implications of undiagnosed disease or for precursors of overt disease. A recent meta-analysis of 16 prospective cohort studies, comprising 891,426 persons, showed prediabetes to be associated with an increased risk of all-site cancer, as well as with increased risks of cancer of the stomach, colon/rectum, liver, pancreas, breast, and endometrium but not with cancer of the bronchus, lung, prostate, ovary, kidney, or bladder (35).
Data on age, sex, ethnicity, and SES were virtually complete in our study. However, incomplete data on smoking status and BMI are weaknesses of this study and of other studies based on administrative data (36–38). Nevertheless, the sensitivity analyses we performed, with adjustments for smoking and BMI, did not change the overall conclusions of this research. Due to the way smoking information was recorded by the clinician in the patients’ computerized files, we could not distinguish between persons who had never smoked and persons whose smoking status was unknown. However, the proportions of current and former smokers in our cohort reflected smoking ratios reported for the general Israeli population (39).
We found results similar to those of a recently published Australian report (33), despite differences in study design. Harding et al. (33) included only diabetes patients who were entered into a diabetes registry; those with less severe diabetes may have been underrepresented. In contrast, our definition of diabetes was broader, allowing the inclusion of undetected cases of diabetes. Furthermore, we applied the same definition of diabetes across all years of the study, so it was not subject to the changes in the definition of diabetes that have occurred over the years. Harding et al. (33) compared observed cancer incidence in their cohort with published data for the Australian population (expected rates). In contrast, we followed, in the same cohort, people with prevalent and incident diabetes and people without diabetes. We were also able to adjust for SES and ethnic origin and to perform sensitivity analyses adjusting for BMI, smoking, and (in the case of prostate cancer) cancer screening.
The findings of our study are consistent with those of smaller population-based studies conducted in China (40) and British Columbia (36). Johnson et al. (36) estimated hazard ratios in the first 3 months following diabetes diagnosis and subsequently up to 10 years following diagnosis. In contrast, we estimated separately the hazard ratios in the first year, in the second year, and in subsequent years following diabetes diagnosis. We decided to designate a longer period due to our observation that particularly elevated rates of some cancers (such as multiple myeloma and cancers of the pancreas and lung) persisted for more than 1 year after the diagnosis of diabetes. In addition, our large numbers enabled us to examine these periods separately while still retaining good precision for estimating the rates in subsequent years. The number of incident cases of diabetes in our database was more than 7 times larger than that included in a pooled analysis of 97 observational studies (1), and the total number of cancer events (128,720 events) was more than the total number of deaths in that analysis (123,205 deaths), of which only a portion were deaths due to cancer. The conduct of a large population study avoids the shortcomings of pooled analyses, such as heterogeneity of data on diabetes. Moreover, cancer incidence, as investigated in this study, is more directly related to cancer risk than is cancer mortality, which may be influenced by treatment or competing risks.
Deciphering the temporal relationship between diabetes and cancer is critical to accurate assessment of the relationship between these diseases (36). Temporal differences between disease onset and disease detection create biases that impede analyses. Reverse causality and surveillance bias or detection bias may explain the highly elevated hazard ratios for cancer observed during the first year following a diabetes diagnosis. If the malignant condition accelerates the development of diabetes, then reverse causality can occur. Reverse causality may be particularly relevant to cancers of the pancreas (4) and perhaps also of the liver (18), due to the metabolic function of these organs. Cancer events that are detected as a result of increased screening or medical check-ups at the time of diabetes diagnosis might be subject to detection bias. In the current analysis, we were unable to distinguish the specific biases that could account for the highly elevated hazard ratios observed during the year following diabetes diagnosis. Nevertheless, we believe that in some cases these elevated hazard ratios do not indicate a biological association but rather may reflect increased and possibly harmful surveillance. For thyroid and prostate cancers, in particular, increased screening has been cited as the reason for dramatic increases in incidence rates (41–44). High rates of complications from treatment and biopsies—and low numbers of avoided deaths—suggest that increased incidence may be due largely to overdiagnosis (44–46).
Because one of the criteria for being defined as having diabetes was the receipt of 3 prescriptions of glucose-lowering medication during the course of a year, “immortal time bias” may have occurred if there were individuals who died or were diagnosed with cancer before receiving the second or third prescription. This could have occurred only in individuals who had none of the other criteria for diabetes. Such bias would have attenuated the hazard ratios for cancer in individuals with incident diabetes but only during the first year after a diabetes diagnosis. Because these estimated hazard ratios were already very high and our main focus was on the hazard ratios 2 or more years after diagnosis, we did not attempt to make any correction for this potential bias.
We found that the likelihood of undergoing a prostate-specific antigen test was slightly higher for persons with diabetes 1 year before diagnosis or 1 or several years after diagnosis, but it was substantially higher during the year of diagnosis. Increased use of other diagnostic tests could explain some of the elevated hazard ratios for cancer incidence observed during the first year following diabetes diagnosis. Contrasting with our findings, in a Canadian study diabetes was associated with lower mammogram use (47) independently of SES (48).
We calculated incidence rates for prostate and thyroid cancers that included the first 2 years of diabetes diagnosis, under the presumption that for these slowly progressing tumors, early detection could decrease later rates. For both men and women, thyroid cancer was associated with diabetes when cancer incidence was assessed from the time of diabetes diagnosis onward but not when the first 2 years following diagnosis were excluded from the analysis. Prostate cancer was associated with diabetes when the first 2 years following diabetes diagnosis were excluded from the analysis but not when rates were calculated from the time of diabetes diagnosis. However, because the prostate cancer rate appeared to stabilize after diagnosis and remain below 1.0 for up to 11 years, it is likely that the lifetime risk following diabetes diagnosis would remain below 1.0 even after including the first 2 years following diagnosis.
The ambiguity regarding the relationship between diabetes and thyroid cancer is congruent with a recently published meta-analysis of 14 cohort studies and 3 case-control studies in which Yeo et al. (27) reported high heterogeneity in the risk of thyroid cancer for persons with diabetes. Overall, an association was found between diabetes and the incidence of thyroid cancer in women but not in men; the association was clearest in geographical areas with higher incidence of thyroid cancer (27), possibly due to greater statistical power.
More studies are needed to investigate the differential effects of reverse causality and detection bias on estimated cancer incidence in individuals with diabetes, with the aim of determining more precisely the associations between diabetes and site-specific cancers. In-depth analysis of tests performed for cancer evaluation and data on stage of cancer at diagnosis could help identify detection bias. Nevertheless, identifying the actual onset dates of diabetes and cancer and the association between the two diseases is challenging, because both diseases may progress silently over time, and many factors may affect interactions between them.
In conclusion, we have shown, in a very large population-based study—including larger numbers of persons diagnosed with diabetes and larger numbers of cancers diagnosed than previously reported—that diabetes is associated with increased risk of a wide range of cancers and with a reduced risk of prostate cancer. We found no association with thyroid cancer or premenopausal breast cancer. Further work is called for to shed light on issues of reverse causality and detection bias in the risks of specific cancers, as well as the role of glucose-lowering medications in the observed association between diabetes and various cancers.
ACKNOWLEDGMENTS
Author affiliations: Unit for Cardiovascular Epidemiology, Gertner Institute for Epidemiology and Health Policy Research, Sheba Medical Center, Tel Hashomer, Israel (Rachel Dankner, Maya Sadeh, Alla Berlin); Susan and Herman Merinoff Center for Patient-Oriented Research, Feinstein Institute for Medical Research, Manhasset, New York (Rachel Dankner); Department of Epidemiology and Preventive Medicine, School of Public Health, Sackler School of Medicine, Tel Aviv University, Tel Aviv, Israel (Rachel Dankner, Laurence S. Freedman); Tisch Cancer Institute, Icahn School of Medicine at Mount Sinai, New York, New York (Paolo Boffetta); Clalit Health Services and Clalit Research Institute, Tel Aviv, Israel (Ran D. Balicer, Alla Berlin); Department of Public Health, Ben-Gurion University of the Negev, Beer Sheva, Israel (Ran D. Balicer); Israel Center for Disease Control, Ministry of Health, Tel Hashomer, Israel (Lital Keinan Boker); School of Public Health, Faculty of Social Welfare and Health Sciences, Haifa University, Haifa, Israel (Lital Keinan Boker); Unit for Biostatistics, Gertner Institute for Epidemiology and Health Policy Research, Sheba Medical Center, Tel Hashomer, Israel (Liraz Olmer, Laurence S. Freedman); Community Division, Clalit Health Services, Tel Aviv, Israel (Margalit Goldfracht); and Family Medicine Department, Ruth and Bruce Rappaport Faculty of Medicine, Technion–Israel Institute of Technology, Haifa, Israel (Margalit Goldfracht).
This study was funded by the European Foundation for the Study of Diabetes.
We thank Dr. Ori Davidov of the Department of Statistics at Haifa University for imparting his insights during the early stages of developing our statistical approach.
Conflict of interest: none declared.
REFERENCES
APPENDIX
Estimation of the Overall 10-Year Relative Risk
The 10-year relative risk of cancer for persons with diabetes versus persons without diabetes is given by the ratio of their 10-year cancer incidence rates. Suppose that I0 is the annual incidence rate of cancer among persons without diabetes. Then, because I0 is small, the annual incidence rate in persons with diabetes will be approximately exp(λ)I0, where λ is the log hazard ratio for that year. Now suppose that the log hazard ratio for the first year after diabetes diagnosis is λ1, for the second year λ2, and for the remaining years, up to 10 years after diagnosis, λ3. Then the incidence over 10 years in the nondiabetic group is 10I0, and the incidence in the diabetic group is approximately I0(exp(λ1) + exp(λ2) + 8 exp(λ3)), so that the relative risk is (exp(λ1) + exp(λ2) + 8 exp(λ3))/10.
Estimates of the log hazard ratios were substituted into this expression to obtain the estimated relative risk. The standard error and confidence limits of the estimated relative risk were computed using the delta method.
Author notes
Abbreviations: BMI, body mass index; CI, confidence interval; HR, hazard ratio; SES, socioeconomic status.

