Article Text

Abstract
Objective There is substantial variation in colonoscopy use and evidence of long wait times for the procedure. Understanding the role of system-level resources in colonoscopy utilisation may point to a potential intervention target to improve colonoscopy use. This study characterises colonoscopy resource availability in Ontario, Canada and evaluates its relationship with colonoscopy utilisation.
Design We conducted a population-based study using administrative health data to describe regional variation in colonoscopy availability for Ontario residents (age 18–99) in 2013. We identified 43 colonoscopy networks in the province in which we described variations across three colonoscopy availability measures: colonoscopist density, private clinic access and distance to colonoscopy. We evaluated associations between colonoscopy resource availability and colonoscopy utilisation rates using Pearson correlation and log binomial regression, adjusting for age and sex.
Results There were 9.4 full-time equivalent colonoscopists per 100 000 Ontario residents (range across 43 networks 0.0 to 21.8); 29.5% of colonoscopies performed in the province were done in private clinics (range 1.2%–55.9%). The median distance to colonoscopy was 3.7 km, with 5.9% travelling at least 50 km. Lower colonoscopist density was correlated with lower colonoscopy utilisation rates (r=0.53, p<0.001). Colonoscopy utilisation rates were 4% lower in individuals travelling 50 to <200 km and 11% lower in individuals travelling ≥200 km to colonoscopy, compared to <10 km. There was no association between private clinic access and colonoscopy utilisation.
Conclusion The substantial variations in colonoscopy resource availability and the relationship demonstrated between colonoscopy resource availability and use provides impetus for health service planners and decision-makers to address these potential inequalities in access in order to support the use of this medically necessary procedure.
- COLONOSCOPY
- HEALTH SERVICE RESEARCH
- COLORECTAL CANCER
Data availability statement
Data may be obtained from a third party and are not publicly available. The dataset from this study is held securely in coded form at ICES. While legal data sharing agreements between ICES and data providers (eg, healthcare organisations and government) prohibit ICES from making the dataset publicly available, access may be granted to those who meet pre-specified criteria for confidential access, available at www.ices.on.ca/DAS (email: das@ices.on.ca). The full dataset creation plan and underlying analytical code are available from the authors on request, understanding that the computer programs may rely upon coding templates or macros that are unique to ICES and are therefore either inaccessible or may require modification.
This is an open access article distributed in accordance with the Creative Commons Attribution Non Commercial (CC BY-NC 4.0) license, which permits others to distribute, remix, adapt, build upon this work non-commercially, and license their derivative works on different terms, provided the original work is properly cited, appropriate credit is given, any changes made indicated, and the use is non-commercial. See: http://creativecommons.org/licenses/by-nc/4.0/.
Statistics from Altmetric.com
WHAT IS ALREADY KNOWN ON THIS TOPIC
There is limited evidence of the extent to which access to colonoscopy varies geographically and its association with colonoscopy utilisation.
WHAT THIS STUDY ADDS
There was substantial variation in access to colonoscopy across Ontario. Reduced colonoscopy access, as measured by colonoscopist density and travel distance to colonoscopy, was associated with lower colonoscopy utilisation rates.
HOW THIS STUDY MIGHT AFFECT RESEARCH, PRACTICE AND/OR POLICY
Poor access to colonoscopy may be detrimental to patients through its impact on colonoscopy utilisation.
Future research is needed to better understand relationships between colonoscopy access, use and patient outcomes.
Introduction
Colonoscopy is a common medical procedure used to screen for, diagnose and support the ongoing management of malignant and non-malignant gastrointestinal conditions, including colorectal cancer and inflammatory bowel disease. Data from Canada as well as international studies have documented substantial variations in colonoscopy utilisation rates which are not explained by differences in casemix or clinical indicators of need.1–3 Further, wait times for colonoscopy have been found to exceed medically acceptable wait times.4–11 For example, while the Canadian Association of Gastroenterologists (CAG) recommends that colorectal cancer screening colonoscopies be performed within 6 months of referral, the 2012 national median wait time for screening colonoscopies was over 9 months.6 Individuals presenting with colorectal cancer symptoms waited a median of 3–5 months for colonoscopy, despite the CAG-recommended wait time of 2 months.6
The Aday and Andersen Framework for the Study of Access to Care provides a conceptual framework to understand the factors influencing colonoscopy wait times and utilisation.12 According to this framework, colonoscopy use and wait times are indicators of realised access to care. Factors which may influence realised access include health system resources and their organisation, which are defined as indicators of potential access to care. Thus, characteristics of colonoscopy resources within the healthcare system, including the density of physicians who perform this procedure and the geographical distribution of these resources may explain, at least in part, colonoscopy wait times and variations in colonoscopy utilisation. Previous Canadian research supports this hypothesis. A 2001 study reported substantial geographical variation and undersupply of endoscopists in Ontario, with 11 of 49 counties with an endoscopist density rate that was at least 25% lower than the provincial rate. Further, there was a strong, positive correlation (r=0.82) between colonoscopist density and colonoscopy utilisation.1
This prior evidence was produced prior to the introduction of the population-based, publicly funded colorectal cancer screening programme in 2007 which was expected to greatly increase the demand for and utilisation of colonoscopy.13 14 Through this programme, all average-risk adults age 50–74 are offered routine colorectal cancer screening via a faecal immunochemical test (previously via faecal occult blood test) every 2 years or flexible sigmoidoscopy every 10 years, with abnormal tests followed up via colonoscopy, while those at increased risk of colorectal cancer are screened directly via colonoscopy at an interval defined by their care provider. There has also been expansion of private endoscopy clinics in Ontario, which may improve access to colonoscopy by increasing system capacity and reducing wait times. At the same time, there are concerns around the quality of procedures performed in these private facilities, with evidence of lower completion rates and missed colorectal cancers.15–17 Thus, the objective of this study was to measure and describe the availability of colonoscopy resources in Ontario, Canada in the screening era and to evaluate the relationship between colonoscopy resource availability and utilisation. As the population ages and demand for colonoscopy continues to grow, this study provides important evidence of system-level determinants of colonoscopy utilisation and points to potential targets for intervention to promote more timely and equitable use of colonoscopy.
Materials and methods
This is a population-based cross-sectional descriptive study of the availability and utilisation of colonoscopy resources in Ontario, Canada. Ontario is Canada’s largest province with a universal healthcare system in which all citizens and permanent residents eligible for coverage under the Ontario Health Insurance Programme (OHIP). We evaluated three colonoscopy availability measures: colonoscopist density, private clinic access and travel distance to colonoscopy, as well as colonoscopy utilisation rates. Colonoscopy resource availability and use was measured using colonoscopy networks that were determined by starting with an existing health services area classification, which we modified to reflect colonoscopy utilisation patterns.18–20 We report colonoscopy network-level variations in resource availability and associations between resource availability and utilisation in 2013.
Study population
The study population included all Ontario residents aged 18–99 who were covered under the publicly funded provincial health insurance programme (OHIP) in 2013, excluding those we were not able to assign to a colonoscopy network.
Data sources
We used administrative data housed at ICES (formerly known as the Institute for Clinical Evaluative Sciences). ICES is an independent, non-profit research institute whose legal status under Ontario’s health information privacy law allows it to collect and analyse healthcare and demographic data, without consent, for health system evaluation and improvement. ICES databases used in this study included the Registered Persons Database which contains demographic information on all Ontario residents, the OHIP physician claims database which contains billing claims for all Ontario physicians, including fee codes that represent the billable service, the ICES Physician Database which contains specialty and workload data on all physicians in Ontario, the Postal Code Conversion File to compute distance between postal codes, and the Ontario Multispecialty Physician Networks database that identified physician network membership for Ontario residents, physicians and acute care hospitals for fiscal years 2008/2009–2010/2011.18 These datasets were linked using unique encoded identifiers and analysed at ICES.
Development of colonoscopy networks
We used previously developed Ontario physician networks18 to create colonoscopy networks in which to measure colonoscopy resource availability and utilisation. Briefly, the original 78 physician networks were developed by linking (1) residents to their usual provider of primary care via rostering and primary care utilisation patterns, (2) primary care providers and their patients to acute care hospitals via non-maternal medical admission patterns and (3) specialists to acute care hospitals via their volume of inpatient services. These networks were developed based on patterns of health services utilisation observed from April 2008 to March 2011. These networks are not geographically or spatially bound but rather capture the providers and institutions that tend to share care for a common group of residents.
We used OHIP claims to identify all colonoscopies received by physician network residents (see online supplemental table 1) for colonoscopy fee codes). We calculated the colonoscopy loyalty for each physician network, defined as the proportion of colonoscopy recipients who received their procedure from a physician in their home network. Across the 78 physician networks, the mean colonoscopy loyalty was 60.9% and two networks had 0% loyalty. We mapped the physician network locations, their colonoscopy loyalty and between-network colonoscopy travel patterns. We amalgamated physician networks with low colonoscopy loyalty, close proximity to neighbouring networks, and strong patterns of between-network travel for colonoscopies to form 43 colonoscopy networks.19 20 This amalgamation identified 43 colonoscopy networks with higher mean colonoscopy loyalty (79.9%) than the original physician networks and no networks with 0% loyalty (online supplemental table 2).
Supplemental material
Study variables
Colonoscopist density was defined as the number of full-time equivalent (FTE) colonoscopists, per 100 000 colonoscopy network residents in 2013. Colonoscopists were physicians who performed more than 50 colonoscopies in 2013, regardless of specialty. FTE measures a physician’s workload based on their total billings for 2013, in relation to the same-year total billings of other physicians of the same specialty.21 An FTE of >1 indicates that a physician has higher OHIP billings than their peers, while an FTE of <1 indicates that a physician has lower OHIP billings than their peers.
Private clinic access was defined as the proportion of colonoscopies received by colonoscopy network residents that were performed in a private clinic. Physicians who perform colonoscopies in a private clinic are eligible to claim an additional fee, represented by fee code E749 (colonoscopy, sigmoidoscopy or endoscopy rendered in a private office).17 Colonoscopy recipients who had this fee code billed on the same date as their colonoscopy were defined as having received a colonoscopy in a private clinic, while all others were defined as having occurred in hospital.
Travel distance to colonoscopy was calculated as the straight-line distance, in kilometres (km), between an individual’s postal code centroid and the postal code centroid for each colonoscopist in that individual’s colonoscopy network, keeping the shortest distance if there was more than one colonoscopist in the individual’s colonoscopy network.22 23
Colonoscopy network utilisation rates were calculated as the number of colonoscopies received by network residents, per 1000 network residents. Rates were age and sex standardised using direct standardisation, with the study population as the standard population.
Analysis
We described the availability and utilisation of colonoscopy in Ontario in 2013 and characterised the variation in colonoscopist density, private clinic access, travel distance to colonoscopy and colonoscopy utilisation across the 43 colonoscopy networks. The relationships between the contextual effects of colonoscopist density and private clinic access, both measured at the network level, and age-standardised and sex-standardised colonoscopy utilisation rates were evaluated using Pearson correlation coefficients. The relationship between the individual-level effects of travel distance to colonoscopy and colonoscopy was evaluated using log-binomial regression, with adjustment for age and sex. All analyses were completed using SAS V.9.3.24
Results
The eligible population included 10 943 884 Ontario adults, of which 1 105 612 (10.1%) were excluded as they could not be assigned to one of the 43 colonoscopy networks, leaving a final study population that included 9 838 272 individuals. The mean age was 48.4 years (SD 18.3) and 52.5% were female. There were 430 938 colonoscopies received by the study population, with 4.2% of individuals receiving at least one colonoscopy in 2013. There were 1024 physicians who performed at least one colonoscopy in 2013, with 825 (80.6%) performing at least 50 colonoscopies in the year. These colonoscopists performed a median of 438 (IQR 240–700) colonoscopies in 2013.
Regional variations in colonoscopy resource availability and utilisation
In 2013, there were 9.4 FTE colonoscopists per 100 000 residents of Ontario. Across the 43 colonoscopy networks, colonoscopist density varied from a low of 6.6 FTEs per 100 000 residents to a high of 21.8 FTEs per 100 000 residents (table 1). In addition, there was one colonoscopy network that had no active colonoscopists in 2013. In the same year, 29.5% of colonoscopies received by Ontario adults were performed in private clinics, with colonoscopy network-level private clinic use ranging from a low of 1.2% to a high of 55.9%.
Network-level colonoscopy resource availability, quality and utilisation
The median travel distance to the closest colonoscopist for the study population was 3.7 km, with 7 191 023 (73.1%) residing less than 10 km from the closest colonoscopist, 2 069 534 (21.0%) residing between 10 and 49 km, 443 824 (4.5%) residing between 50 and 199 km, and 133 505 (1.4%) residing more than 200 km from the closest colonoscopist.
The 2013 provincial age-standardised and sex-standardised colonoscopy utilisation rate was 43.8 colonoscopies per 1000 residents, with colonoscopy network-level utilisation rates that ranged from a low of 15.9 colonoscopies per 1000 residents to a high of 61.3 colonoscopies per 1000 residents (table 1).
Associations between colonoscopy resource availability and utilisation
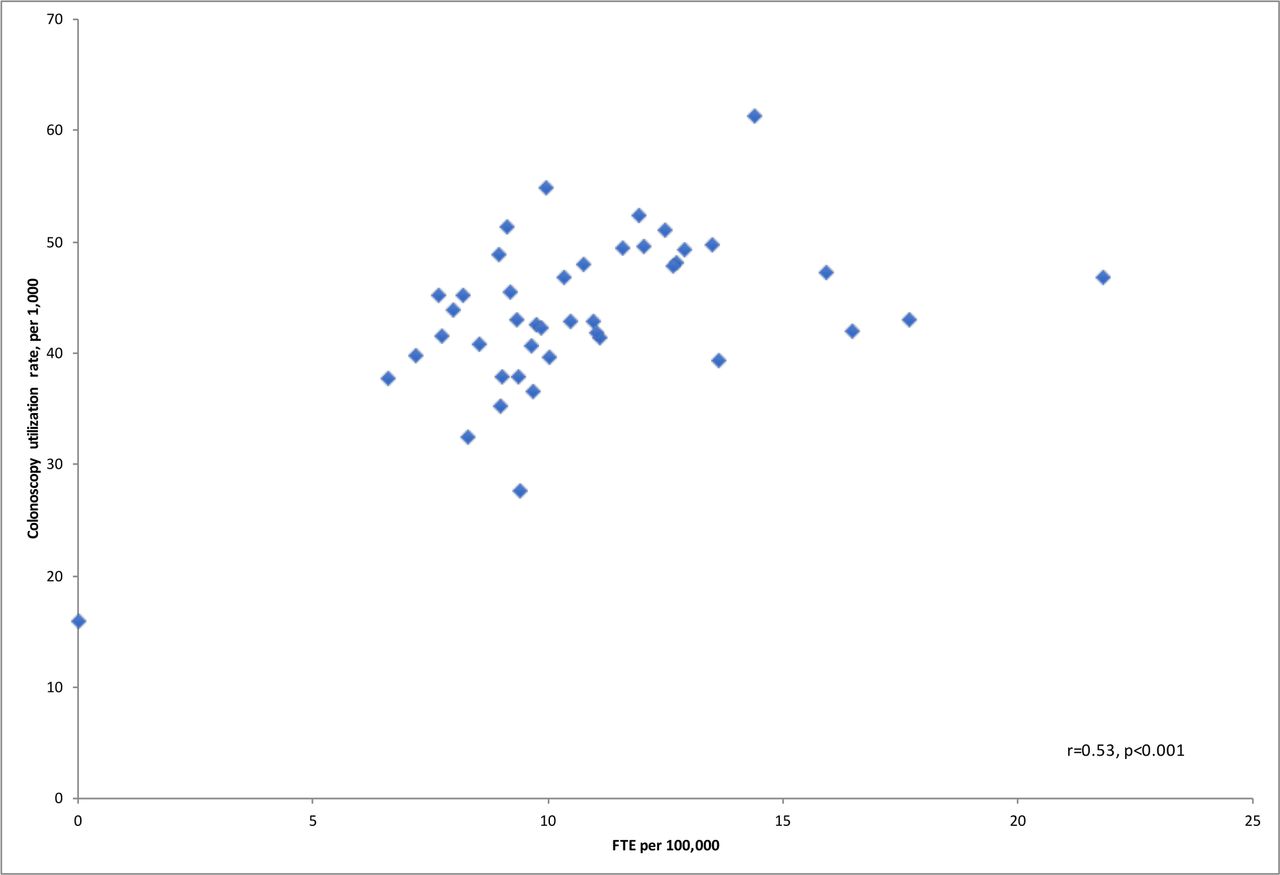
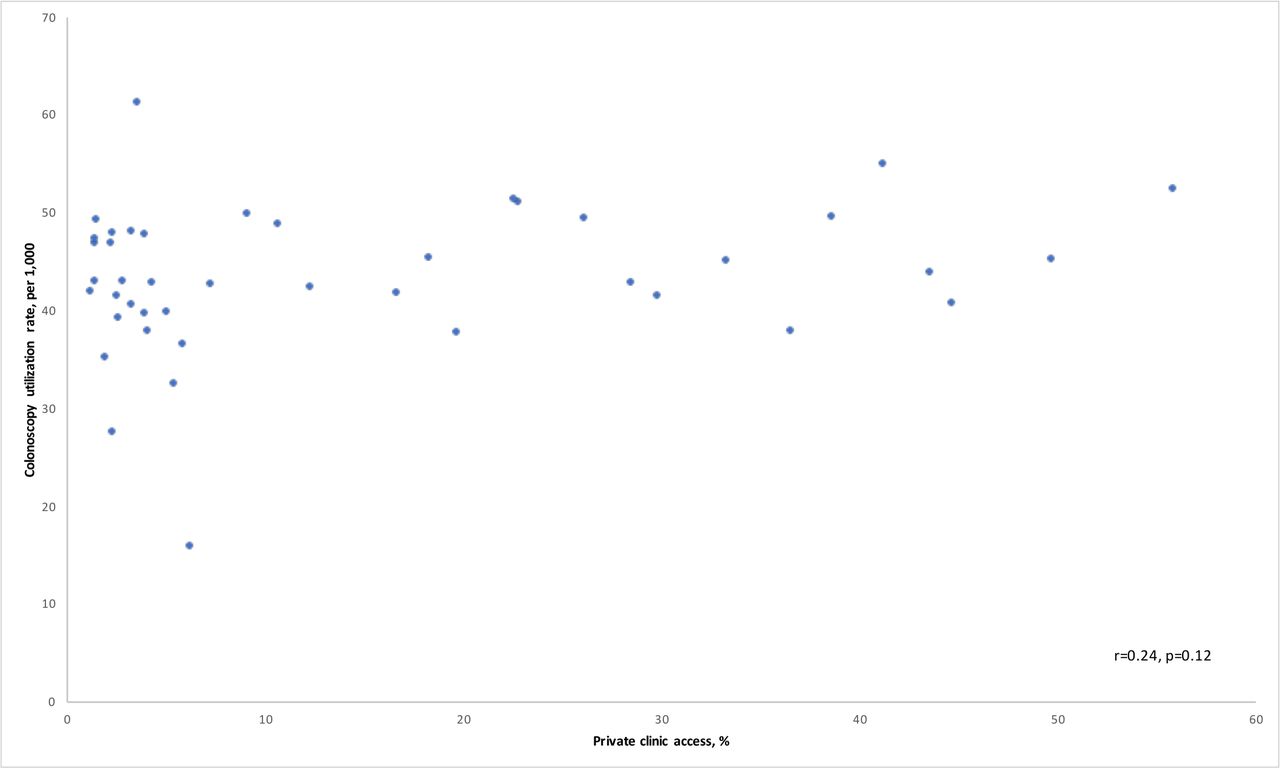
Network-level colonoscopist density was moderately positively correlated with age-standardised and sex-standardised colonoscopy utilisation rates (r=0.53, p<0.001), indicating that networks with higher colonoscopist density also had higher colonoscopy utilisation rates (figure 1). When the network with no active colonoscopists in 2013 was excluded from this analysis, the correlation decreased slightly (r=0.36, p=0.02). The correlation between private clinic access and age-standardised and sex-standardised colonoscopy utilisation rates was weak and not statistically significant (r=0.24, p=0.12) (figure 2).

Scatterplot of colonoscopist density and age-standardised and sex-standardised colonoscopy utilisation rates across 43 colonoscopy networks in Ontario, 2013.

Scatterplot of private clinic access and age-standardised and sex-standardised colonoscopy utilisation rates across 43 colonoscopy networks in Ontario, 2013.
The unadjusted colonoscopy utilisation rate varied depending on how far residents lived from the closest colonoscopist, with the lowest rate (28.8 colonoscopies per 1000 residents) among individuals residing ≥200 km from the closest colonoscopist (table 2). Compared with individuals who lived less than 10 km from a colonoscopist, the age-adjusted and sex-adjusted colonoscopy utilisation rate was 4% lower among those who lived 50–199 km from a colonoscopist (rate ratio (RR) 0.96, 95% CI 0.94 to 0.97) and 11% lower among individuals who lived at least 200 km from a colonoscopist (RR 0.89, 95% CI 0.86 to 0.92) (table 2). In contrast, the age-adjusted and sex-adjusted colonoscopy utilisation rate was 3% higher among individuals who lived 10–49 km from a colonoscopist in contrast to those who lived less than 10 km from a colonoscopist (RR 1.03, 95% CI 1.02 to 1.03).
Association between distance to closest colonoscopist and colonoscopy utilisation
Discussion
This population-based study characterised the availability of colonoscopy resources in Ontario, Canada in 2013. There was substantial geographical variation in these resources across the province, with network-level colonoscopist density that ranged from 0.0 to 21.8 FTEs per 100 000 network residents, and private clinic access that ranged from 1.2% to 55.9% of colonoscopies performed in private clinics. While the majority of Ontario adults lived close to colonoscopy, with a median distance of less than 5 km, a small minority (5.9%) had to travel at least 50 km to reach a colonoscopist. Colonoscopy utilisation rates were positively correlated with colonoscopist density, indicating that networks with higher resource availability had higher colonoscopy utilisation rates, although this finding was attenuated after excluding a network that had no active colonoscopists in 2013. A travel distance greater than 50 km to the closest colonoscopist was associated with reduced colonoscopy utilisation. Private clinic access was not correlated with colonoscopy utilisation rates.
This is the first study to describe in detail regional variations in the availability of colonoscopy resources in Canada or other developed countries. Much of the existing literature focuses on a single measure of resources, predominantly physician density. These previous studies support our findings of geographical variations in the density of specialists who perform colonoscopies.25 26 An Ontario study from 2001 reported county-level colonoscopist density rates from 1.3 to 10 colonoscopists per 100 000 residents, with an overall Ontario rate of 4.0 colonoscopists per 100 000 residents.1 We observed higher rates of colonoscopist density, suggesting that access to colonoscopy may have improved in the province since 2001. However, this increased availability of colonoscopists may have been offset by increased colonoscopy demand that was expected with the introduction of the provincial colorectal screening programme in 2007.13 14 Furthermore, methodological differences between the two studies may explain the increased density observed in our study. Specifically, we used FTEs to calculate colonoscopist density rather than physician head counts, which improves physician density measures as physicians may work more or less than 1.0 FTE. We also defined colonoscopists as physicians who performed at least 50 colonoscopies in a year, while the 2001 study used a more restrictive definition requiring at least 200 colonoscopies a year.27 Finally, the 2001 study reported county-level physician density, while we used colonoscopy networks to capture resource availability. Unlike the colonoscopy networks, the geographical boundaries that define Ontario counties likely do not reflect colonoscopy utilisation, which could potentially reduce observed variations in physician density between counties.
Consistent with the Aday and Andersen Framework for the Study of Access to Care, increased potential access to care, reflected in higher colonoscopist density and shorter travel distance, were associated with increased colonoscopy utilisation. The relationship between colonoscopist density and colonoscopy utilisation is in line with previous research that demonstrated colonoscopy utilisation increases with greater physician availability.1 More broadly, both higher gastroenterologist and general surgeon density and shorter travel times to colonoscopy have been associated with greater colorectal cancer screening uptake28–30 and shorter time to diagnosis of colorectal cancer.20 Higher gastroenterologist and primary care physician density is associated with an earlier stage at colorectal cancer diagnosis,25 31 a higher odds of 5-year survival after colorectal cancer diagnosis,31 and decreased colorectal cancer mortality.32 Our findings, together with these previous studies, point to the importance of colonoscopist availability and travel times on healthcare utilisation, with a potential downstream effect on health outcomes.
There is evidence to indicate that private clinic access has increased in Ontario over time. A previous Ontario study reported that the proportion of colonoscopies performed in private clinics increased from 10% to 15% between 1993 and 2005.17 By 2013, that figure was 29%. However, it is not clear the extent to which this increase may have resulted in substantial improvements in access to colonoscopy for Ontario residents. These changes may reflect a redistribution of existing resources from hospitals to private clinics rather than an absolute increase in colonoscopy capacity in the province. Further, many of these private clinics are likely located in urban areas, leaving more rural and remote areas relatively underserved. Additional research is needed to better understand the impact of private clinics on colonoscopy utilisation and outcomes considering the concerns around quality of colonoscopies performed in private clinics, and the barriers that individuals may face in accessing private clinics given the extra fees often charged to patients at these clinics.15–17 33 34
Our use of colonoscopy networks to measure colonoscopy resources addresses a common problem in studies of health system resources, namely the use of arbitrary catchment areas to identify the population served by resources within the catchment. Previous research has often used predefined geographical areas, such as census areas or counties, despite evidence that healthcare utilisation does not follow arbitrary geographical boundaries.35 36 Any catchment area border crossing that occurs when individuals use healthcare can result in biased estimates of populations and resources.36 The colonoscopy networks used in this study were derived based on observed colonoscopy utilisation patterns, thereby minimising border crossing and maximising the likelihood that a network’s population accurately identify the individuals served by the providers and institutions within the network. While outside the scope of this paper, we also evaluated the use of counties, local health integration networks (LHINs) and smaller sub-LHINS to measure colonoscopy resources, with none performing as well as the colonoscopy networks on measures of colonoscopy loyalty.19
This study had several strengths and limitations. First, our population-based study and use of administrative data allowed us to capture all colonoscopies provided to the study population. Our development and use of colonoscopy networks minimised the impact of boundary crossing on our measures of colonoscopy resources and more accurately reflect catchments for colonoscopy resources by defining networks based on individuals’ use of colonoscopy rather than geographical boundaries or travel times. However, it remains a possibility for individuals to seek care from physicians outside of their home network and for physicians to provide care to patients outside of their home network. Thus, we have not completely eliminated the border crossing issue and so there may be misclassification in our colonoscopy resource measures from miscounting the population and physicians serving a given network. Second, we computed our measure of colonoscopy travel distance using straight-line distance between residents’ and physicians’ postal code centroids. In rural areas where postal codes cover large geographical areas, these postal code centroids are rough approximations of individuals’ residences and physicians’ practice locations, resulting in misclassification in our distance calculations.23 Particularly, this measurement approach would underestimate the distance between residents and colonoscopists who share postal codes yet are geographically distant. These measures of travel distance also do not represent road distance and do not account for variations in travel time. Third, we adjusted for age and sex in evaluating differences in colonoscopy availability and use, although there may be other clinical and non-clinical factors influencing use that we did not account for, such as family history of colorectal cancer or education. Fourth, two measures of colonoscopy access were contextual measures, measured at the network-level and evaluated via correlations with network-level colonoscopy utilisation rates. These analyses may be prone to the ecological fallacy, wherein the associations observed at the network-level may differ than those that exist at the individual level. Fifth, this is a cross-sectional study and therefore we cannot draw conclusions about temporality of the associations between colonoscopy resource availability and quality and colonoscopy utilisation. Sixth, we excluded approximately 10% of eligible individuals because they were not assigned to one of the physician networks that were used to create the colonoscopy networks, either because they were very low healthcare users or because they were not residing in Ontario during the time the networks were created. We do not expect that these excluded individuals would have disproportionately belonged to specific networks, but rather have reflected the distribution of the final study population across the 43 networks. We; therefore, do not think this exclusion resulted in selection bias within our study. However, it may have resulted in slight overestimates in our measures of colonoscopist density and colonoscopy utilisation. Seventh, individuals may have received other gastrointestinal investigations, including flexible sigmoidoscopy or CT colonoscopy, instead of colonoscopy, particularly if they lived in areas with limited colonoscopy availability. This may be contributing to the lower levels of colonoscopy use in areas with limited colonoscopy resources that we observed in this study. Eighth, there may be other system-level factors that are influencing colonoscopy use aside from colonoscopy resource availability. Specifically, as patients are typically referred for colonoscopy by primary care physicians, areas with limited availability of primary care physicians may have fewer referrals and thus lower utilisation rates. Further, variations in primary care physicians’ likelihood to refer patients for screening colonoscopy may also contribute to variations in use. Finally, despite examining health system resources in 2013, we think the findings of this study are still relevant today. There is no evidence to suggest that there have been any substantial changes in colonoscopy resource availability or utilisation in Ontario that would change the associations observed in this study and so we expect that the availability of colonoscopy resources remains an important determinant of colonoscopy utilisation.37
Conclusion
Problems of poor access to colonoscopy may be detrimental to patients through its impact on colonoscopy utilisation. While prior studies have documented long colonoscopy wait times and unexplained variations in colonoscopy utilisation in Ontario, few studies have investigated system-level determinants of those outcomes, particularly since the introduction of the population-based colorectal cancer screening programme that was expected to substantially increase demand for colonoscopy. In this study, we used colonoscopy networks to evaluate three measures of potential colonoscopy access: colonoscopist density, private clinic access and distance to colonoscopy. These networks were developed from actual colonoscopy referral and utilisation patterns in Ontario and so are better measures of the resources available to network residents than other geographical catchment areas. Our findings indicate that there were substantial geographical variations in the availability of colonoscopy resources in Ontario in 2013, with evidence to suggest that reduced colonoscopist density and longer travel distance to colonoscopy are associated with lower use of this important procedure. Future research is needed to further investigate the impact of colonoscopy resource availability on healthcare utilisation and healthcare outcomes, including individual-level studies using methods to evaluate both individual and contextual effects. These studies will have important implications on health system planning and resource allocation with the goal of improving the care and outcomes of patients with gastrointestinal conditions in which colonoscopy plays a key role in diagnosis and management.
Data availability statement
Data may be obtained from a third party and are not publicly available. The dataset from this study is held securely in coded form at ICES. While legal data sharing agreements between ICES and data providers (eg, healthcare organisations and government) prohibit ICES from making the dataset publicly available, access may be granted to those who meet pre-specified criteria for confidential access, available at www.ices.on.ca/DAS (email: das@ices.on.ca). The full dataset creation plan and underlying analytical code are available from the authors on request, understanding that the computer programs may rely upon coding templates or macros that are unique to ICES and are therefore either inaccessible or may require modification.
Ethics statements
Patient consent for publication
Ethics approval
This study involves human participants but ICES is a prescribed entity under Ontario’s Personal Health Information Protection Act (PHIPA). Section 45 of PHIPA authorises ICES to collect personal health information, without consent, for the purpose of analysis or compiling statistical information with respect to the management of, evaluation or monitoring of, the allocation of resources to or planning for all or part of the health system. Projects that use data collected by ICES under section 45 of PHIPA, and use no other data, are exempt from REB review.
Acknowledgments
This study was supported by ICES, which is funded by an annual grant from the Ontario Ministry of Health (MOH) and the Ministry of Long-Term Care (MLTC). This study also received funding from the Canadian Institutes of Health Research (CIHR). Parts of this material are based on data and information compiled and provided by Ontario Ministry of Health (MOH). The analyses, conclusions, opinions and statements expressed herein are solely those of the authors and do not reflect those of the funding or data sources; no endorsement is intended or should be inferred. This document used data adapted from the Statistics Canada Postal CodeOM Conversion File, which is based on data licensed from Canada Post Corporation, and/or data adapted from the Ontario Ministry of Health Postal Code Conversion File, which contains data copied under license from ©Canada Post Corporation and Statistics Canada. Parts of this material are based on data and/or information compiled and provided by the Canadian Institute for Health Information (CIHI). However, the analyses, conclusions, opinions and statements expressed in the material are those of the author(s), and not necessarily those of CIHI.
References
Supplementary materials
Supplementary Data
This web only file has been produced by the BMJ Publishing Group from an electronic file supplied by the author(s) and has not been edited for content.
Footnotes
Contributors All authors conceptualised and designed the study. CW conducted all data processing and analysis. CW drafted the manuscript. All authors reviewed and edited the manuscript. All authors read and approved the final manuscript.
Funding This study was funded in part by a grant awarded to Dr. Groome from the Canadian Institutes of Health Research (CIHR 119370). The funders had no role in the design of the study, collection, analysis and interpretation of the data, or writing of the manuscript.
Competing interests None declared.
Provenance and peer review Not commissioned; externally peer reviewed.
Supplemental material This content has been supplied by the author(s). It has not been vetted by BMJ Publishing Group Limited (BMJ) and may not have been peer-reviewed. Any opinions or recommendations discussed are solely those of the author(s) and are not endorsed by BMJ. BMJ disclaims all liability and responsibility arising from any reliance placed on the content. Where the content includes any translated material, BMJ does not warrant the accuracy and reliability of the translations (including but not limited to local regulations, clinical guidelines, terminology, drug names and drug dosages), and is not responsible for any error and/or omissions arising from translation and adaptation or otherwise.