Article Text

Abstract
Objective The aim of this study was to investigate the association between obesity, diabetes and metabolic related liver dysfunction and the incidence of cancer.
Design This study was conducted with health record data available from the National Health Service in Tayside and Fife. Genetics of Diabetes Audit and Research Tayside, Scotland (GoDARTS), Scottish Health Research Register (SHARE) and Tayside and Fife diabetics, three Scottish cohorts of 13 695, 62 438 and 16 312 patients, respectively, were analysed in this study. Participants in GoDARTS were a volunteer sample, with half having type 2 diabetes mellitus(T2DM). SHARE was a volunteer sample. Tayside and Fife diabetics was a population-level cohort. Metabolic dysfunction-related liver disease (MDLD) was defined using alanine transaminase measurements, and individuals with alternative causes of liver disease (alcohol abuse, viruses, etc) were excluded from the analysis.
Results MDLD associated with increased cancer incidence with a HR of 1.31 in a Cox proportional hazards model adjusted for sex, type 2 diabetes, body mass index(BMI), and smoking status (95% CI 1.27 to 1.35, p<0.0001). This was replicated in two further cohorts, and similar associations with cancer incidence were found for Fatty Liver Index (FLI), Fibrosis-4 Index (FIB-4) and non-alcoholic steatohepatitis (NASH). Homozygous carriers of the common non-alcoholic fatty liver disease (NAFLD) risk-variant PNPLA3 rs738409 had increased risk of cancer. (HR=1.27 (1.02 to 1.58), p=3.1×10⁻²). BMI was not independently associated with cancer incidence when MDLD was included as a covariate.
Conclusion MDLD, FLI, FIB-4 and NASH associated with increased risk of cancer incidence and death. NAFLD may be a major component of the relationship between obesity and cancer incidence.
- cancer
- obesity
- epidemiology
- genetics
- fatty liver
Data availability statement
Data may be obtained from a third party and are not publicly available. Data will not be published.
This is an open access article distributed in accordance with the Creative Commons Attribution Non Commercial (CC BY-NC 4.0) license, which permits others to distribute, remix, adapt, build upon this work non-commercially, and license their derivative works on different terms, provided the original work is properly cited, appropriate credit is given, any changes made indicated, and the use is non-commercial. See: http://creativecommons.org/licenses/by-nc/4.0/.
Statistics from Altmetric.com
Summary box
What is already known about this subject?
Recent studies have found increased rates of specific cancers as well as overall cancer risk in patients with metabolic dysfunction-related liver disease (MDLD).
What are the new findings?
We found that individuals with (MDLD) have higher overall cancer risk than healthy individuals as well as increased risk of specific cancers such as colon, breast and lung. We also show that when MDLD is accounted for, obesity does not significantly increase overall cancer risk. Our mendelian randomisation analysis provides evidence that there may be a causal link between MDLD and cancer incidence.
How might it impact on clinical practice in the foreseeable future?
These findings may inform future research into the mechanisms by which cancer incidence is increased in those with obesity. They may also have utility in cancer risk screening.
Introduction
Non-alcoholic fatty liver disease (NAFLD) is the most common cause of liver disease globally, affecting around 25.2% of adults worldwide.1 NAFLD, a spectrum of simple steatosis to non-alcoholic steatohepatitis (NASH), is traditionally associated with endpoints, which affect the liver, including fibrosis, cirrhosis and hepatocellular carcinoma (HCC).2 Recent studies have found associations between NAFLD and specific extrahepatic cancers, including colon and breast cancer, as well as overall cancer risk.3 4 The relationship between NAFLD and cancer as well as the synergy between NAFLD and other cancer risk modifiers is not fully understood.
Obesity, commonly defined as body mass index (BMI) equal or higher than 30 kg/m2, is a major cause of NAFLD, with 51.3% of NAFLD patients also being obese.5 6 Obesity has also been linked with cancer incidence at 13 different sites in the body.7 Wolin et al estimate that excess weight or obesity account for 20% of all cancers.8 Mechanistically, several factors associated with increased fat mass have been proposed to cause cancer.9 For example, dysregulation of circulating hormones and cytokines, including insulin, insulin-like growth factor signalling, adipokines, inflammation and sex hormones, may disrupt normal cell cycle control and promote tumour formation. Indeed, there is significant overlap of many of such pathological abnormalities between both overweightness and NAFLD.10 The elements of shared pathophysiology of NAFLD and overweightness could potentially mean that the observed increases in cancer risk share a common aetiology. Allen et al found only small increases in cancer incidence in obese patients without NAFLD.4 Recently, a study by Pfister et al in patients with HCC showed an association with NASH and limited antitumour surveillance.11 This highlights the value in epidemiological studies assessing the relationship between NAFLD and the risk of cancer.
This study uses an alanine transaminase (ALT)-defined metabolic dysfunction-related liver disease (MDLD) phenotype .12–14 ALT is positively correlated with hepatic steatosis, and when other causes of liver disease are excluded, this can be an effective method of NAFLD diagnosis.15 Recently, Eslam et al described a phenotype of metabolic dysfunction associated fatty liver disease (MAFLD) based on biochemical, imaging or biopsy along with type 2 diabetes mellitus (T2DM), obesity or other metabolic risk factors.16 17 The diagnosis of NAFLD in clinical settings often differs from the definitions applied in large-scale epidemiological studies. Clinically patients with suspected NAFLD are not always subjected to invasive investigations such as biopsies or ultrasound imaging; therefore, this necessitates the use of more commonly measured biomarkers and use of exclusion criteria to eliminate other causes of raised ALT. Therefore, in this study, we develop and validate a definition of MDLD in large-scale data resources and in order to test its associations with cancer incidence.18
The aim of this study was to analyse the effects of MDLD on cancer incidence and cancer death. In addition, the study aimed to investigate the interaction between BMI and MDLD. Finally, using Mendelian randomisation methods, we investigated whether the relationship between MDLD and cancer was causal or not.
Methods
Data
GoDARTS
This study aimed to analyse the incidence of all cancer longitudinally. The first cohort used was Genetics of Diabetes Audit and Research Tayside, Scotland (GoDARTS), a case–control type 2 diabetes study based in Tayside, Scotland. Key descriptive statistics and demographic attributes of this cohort are shown in table 1. This cohort was used for discovery and comprised of electronic health records (EHRs) from 13 695 eligible individuals.19 The mean age at sign up was 63.41 years and participants had a mean follow-up of 8.95 years. Of 48.6% of patients were men. On patients’ date of sign-up, they were phenotyped by biochemical and haematological investigations, anthropometric measurements and lifestyle questionnaires. This date was used as the beginning of the follow-up period. A total of 2794 patients had cancer incidents during the follow-up period.
Mean characteristics of GoDARTS patients stratified by NAFLD status at time of enrolment to GoDARTS
Mean characteristics of SHARE patients stratified by NAFLD status at age 60 (beginning of follow-up period)
SHARE
Two further, independent cohorts were analysed for replication. The second data source was Scottish Health Research Register (SHARE). This is a cohort in which individuals volunteer to allow their medical records to be used for scientific research and is open to anyone in Scotland over the age of 16. The characteristics of this cohort are shown in table 2. This comprised 62 438 patients with EHRs available once patients with exclusions for alternate causes of raised ALT livers were removed.20 This cohort was used for replication of findings in GoDARTS. The mean age in SHARE was 57.0 years, and 61.6% were women.
Tayside and Fife T2DM Cohort
Replication of results was also undertaken in Tayside and Fife (T&F) T2DM Cohort. This cohort comprises all patients in the T&F National Health Service (NHS) region who had a diagnosis of T2DM at some point in their lives. Many of the patients received a diagnosis of T2DM during the follow-up period; therefore, the T2DM rate is not 100% at baseline. The characteristics of this cohort are shown in table 3. Like the two previous cohorts, medical records from the NHS are available for these patients. The cohort 16 312 patients eligible after exclusions for other hepatic insults were made. The mean age of these patients was 65.0 years, and 48.1% were women. Results for analysis in T&F are reported in the supplemental appendix.
Supplemental material
Mean characteristics of Tayside and Fife diabetics patients stratified by NAFLD status at age 60 (beginning of follow-up period)
The results from T&F were not meta-analysed with GoDARTS and SHARE, as this is a primarily diabetic cohort, therefore does not capture those who do not go on to get diabetes. The ascertainment bias in this cohort that only contains individuals who did eventually get diabetes is likely to have resulted in the lower point estimate for MDLD in cancer risk that we have observed. To ensure that there was no overlap in participants between cohorts, patients in SHARE who were also in GoDARTS were excluded from SHARE, and participants in GoDARTS or SHARE were excluded from analysis in T&F, meaning each cohort was completely independent.
To allow comparison with the GoDARTS cohort, a baseline point had to be chosen from which to begin the follow-up period in which to analyse cancer incidence in SHARE and T&F. The age of 60 was chosen as it is close to the mean baseline age of GoDARTS, and importantly close to the mean age of MDLD diagnosis in GoDARTS (60.8 years) and in the literature.21 This allowed a more robust replication of findings in GoDARTS in the two replication cohorts, ensuring that age was not a source of heterogeneity in analysis. These criteria left 26 891 patients in SHARE and 11 141 patients in T&F suitable for analysis with a median follow-up time of 11.0 years and 8.0 years, respectively. The EMRs available for patients in all cohorts are from the NHS T&F authorities. Consort diagrams can be found for each cohort in the supplemental appendix.
Outcomes
All outcomes were defined using NHS medical record data, made available for participants in each of the three cohorts. As such, all data were recorded in the same format; all diseases were recorded in International Classification of Disease-10 (ICD10) codes and biochemical measures in the same, relevant units22 (eg, Units per litre for ALT measurements)
MDLD phenotype
MDLD cases and controls were defined using the liver function test ALT, a commonly used marker of liver damage and a useful surrogate for NAFLD.12 14 23–26 This was chosen as it is commonly measured and Schindhelm et al found in a population cohort that raised ALTs are a good surrogate for NAFLD.23 Elevated ALT levels were considered to be over 30 U/L for men, and over 19 U/L for women (normal ALT reference ranges: men—5–30 U/L; women—5–19 U/L.). These upper limits are those suggested by Prati et al as the maximum normal values of ALT in healthy adult men and women.27 Raised ALT levels correlate with NAFLD and are an appropriate surrogate marker for the disease, provided other causes of liver disease are ruled out.23 28 There is substantial evidence that raised ALT levels in the absence of any apparent liver insult are extremely likely to be caused by NAFLD.29 All samples from GoDARTS, SHARE and T&F were analysed in the same laboratory.
MDLD cases were defined as any patient who had experienced at least two raised ALT measurements, at least 3 months apart. This time scale was chosen as 3 months is a commonly used definition of chronic and most cases of acute hepatitis, such as drug induced, will have resolved.30 This also increases the specificity of the definition. Due to the lack of confirmatory biopsy and ultrasound data in all patients, we have refrained from referring to this phenotype as ‘NAFLD’ and instead have used MDLD.
Exclusions
Patients were excluded from analysis if they had features of other chronic liver disease recorded in their medical records. These included: any positive serological tests for antismooth muscle antibody, antinuclear antibodies or antimitochondrial antibodies, any positive serology for hepatitis B surface antigen or hepatitis C antibody or mention of cause of liver disease in medical records. In GoDARTS, 1157 patients had both immunological and virological screens at some point, which were negative; therefore, they were included in analysis. Patients with alcohol dependence or any documentation of alcoholic liver disease in their EHRs were excluded using ICD codes: ‘K70’ and ‘F10’. In addition, patients who self-reported drinking more than 20 g (2.5 units) a day for women and more than 30 g (3.75 units) a day for men were excluded. Allen et al concluded that alcohol was not likely to explain the increase in cancer incidence seen with NAFLD in their study.4
Validation of phenotype
To validate this phenotype, sensitivity and specificity analyses were conducted in GoDARTS comparing this to cases of NAFLD confirmed in EHRs with the ‘K76.0’ ICD10 code. The sensitivity of this definition was 97.4%, and the specificity was 32.0%. These analyses were also conducted in SHARE using the same method, with a sensitivity of 75.3% and specificity of 54.2%, and in T&F with sensitivity of 94.6% and specificity of 38.3%. The SHARE cohort has lower sensitivity compared with the other two cohorts, likely due to the lower average age of the cohort and the lower prevalence of diabetes, resulting in lower healthcare interaction, morbidity and mortality. Also, due to the relatively low numbers of confirmed NAFLD in EHRs, small differences in numbers can have large effects on sensitivity and specificity percentages.
The specificity of the MDLD phenotype when compared with EHR-defined NAFLD is low due to the insensitivity of the latter. It is well documented that NAFLD is underdiagnosed and under recorded in clinical settings, leading to the majority of cases not being recorded.13 This means that our MDLD definition based on ALT levels picks up many cases, which are not recorded in EHRs.
Another method of detecting NAFLD non-invasively is the Fatty Liver Index (FLI).31 This uses BMI, waist circumference, triglycerides and gamma glutamyl transferase to define NAFLD and has been validated in a number of cohorts as an accurate surrogate of NAFLD. Of 4164 patients in GoDARTS had the required data available for this measure. In GoDARTS, FLI correlated significantly with MDLD as diagnosed by ALT levels (Pearson correlation coefficient=0.33 (0.31–0.36), p<0.0001)
The Fibrosis-4 (FIB-4) scoring system was also used in the GoDARTS study.32 A FIB-4 score of greater than 3.25 has been shown to predict advanced hepatic fibrosis; therefore, this score was used as the cut-off. This was calculated using the highest recorded AST and ALT measurements and platelet count before the beginning of the GoDARTS for each individual to calculate the highest FIB-4 score they had experienced.
To further validate this, phenotype-positive control tests were run against chronic kidney disease (CKD) in GoDARTS, as it has been shown to associate with NAFLD.33 During the follow-up, 1131 patients had incidence of CKD. MDLD was found to associate with incidence of CKD in a Cox proportional hazards (CPH) model adjusted for sex, T2DM, age and BMI (HR=1.32 (1.25 to 1.39), p<0.0001).
A positive control test with the well-known NAFLD risk variant PNPLA3 rs738409 was conducted.34 In GoDARTS, 8399 eligible participants had been genotyped for this variant. In a logistic regression (LR) with an additive model, adjusted for age and sex, PNPLA3 rs738409 was associated with increased MDLD at the beginning of the study (OR=1.23 (1.12–1.36), p<0.0001).
Clinically adjudicated NAFLD and NASH
As well as our ALT-based MDLD definition, some patients had NAFLD confirmed in hospital admissions data with the ICD10 code ‘K76.0’. This is referred to as ‘NAFLD hospitalisation’ in subsequent sections. In GoDARTS, 0.36% of participants had this code reported in their medical records at any point.
Non-alcoholic steatohepatitis (NASH) was phenotyped by searching admissions, deaths and biopsy files for cases of NASH, defined using the ICD10 codes for NASH, fibrosis and cirrhosis. This may have been a main cause of hospitalisation or concomitant morbidity.
Mendelian randomisation
Mendelian randomisation methods were used to assess whether the relationship between MDLD and cancer incidence was causative.35 The missense variant PNPLA3 rs734809, which is strongly associated with the development and progression of fatty liver disease, was chosen as it has been shown in a large number of studies to associate with MDLD and has been used in previous Mendelian randomisation studies on MDLD. The ratio method was used to conduct this analysis.34 In GoDARTS, 7715 patients had been genotyped for this variant, and 343 of these were homozygous carriers (minor allele frequency (MAF)=20.6%). In SHARE, 1755 patients had been genotyped for this variant, with 50 being homozygous carriers (MAF=23.0%)
Overweight and obesity definitions
In this study, overweight is defined as a BMI greater than 25 kg/m2 and less than 30 kg/m2. Obesity is defined as a BMI equal or over 30 kg/m2.36
Cancer phenotype
Cancer incident data were obtained from the Scottish cancer register, part of the Scottish Morbidity Record.37 This contains all diagnoses of cancer made in Scotland in NHS care, in ICD10 code format. These data were available for patients in GoDARTS, SHARE and T&F. Cases were cross-checked with recorded cases in hospital admissions and death record files. The cancer records were identified by the relevant ICD10 codes for malignant neoplasms or neoplasms of unknown behaviour. These were any code including ‘C’, ‘D0’, ‘D37’, ‘D38’, ‘D39’ or ‘D4’. Obesity-related cancer incidents were phenotyped similarly, but specifically for the 13 reported obesity-related cancer sites.7
Cancer deaths were phenotyped based on death certificate files in EHRs. These list a main cause of death and contributing causes of death for each patient who has died. These were also cross-checked with the Scottish cancer register file.
Statistical methods
All data analyses were carried out in the statistical package R. The effects of MDLD and other independent variables on cancer incidence were analysed using a CPH model. Patients were censored at the point at which they had a cancer incident recorded, death, or September 2016 when the follow-up period ended. Patients with missing data were excluded from analysis.
To assess whether MDLD-affected cancer death risk in the presence of non-cancer death as a competing risk regressions (CRR) using Fine and Gray’s method were run. LR models were used to evaluate the effect of MDLD on death cause.
The main baseline causal model is assessing the effect of MDLD on cancer incidence.
In the GoDARTS cohort, models were adjusted for sex, age, BMI, T2DM and smoking status. In GoDARTs, models with BMI replaced by weight or waist measurement were also run, as these are slightly different measures of obesity and may have provided further insight into the associations. Hypertension, activity level, alcohol consumption and deprivation level were not included in the models as they did not have a significant effect on cancer incidence in the adjusted model. In the SHARE cohort, models were adjusted for sex and T2DM. Smoking and BMI data were not widely available for individuals in the SHARE cohort; therefore this was not controlled for in most analyses.
Patient and public involvement statement
There was no patient involvement in the design of this study.
Results
MDLD and cancer incidence
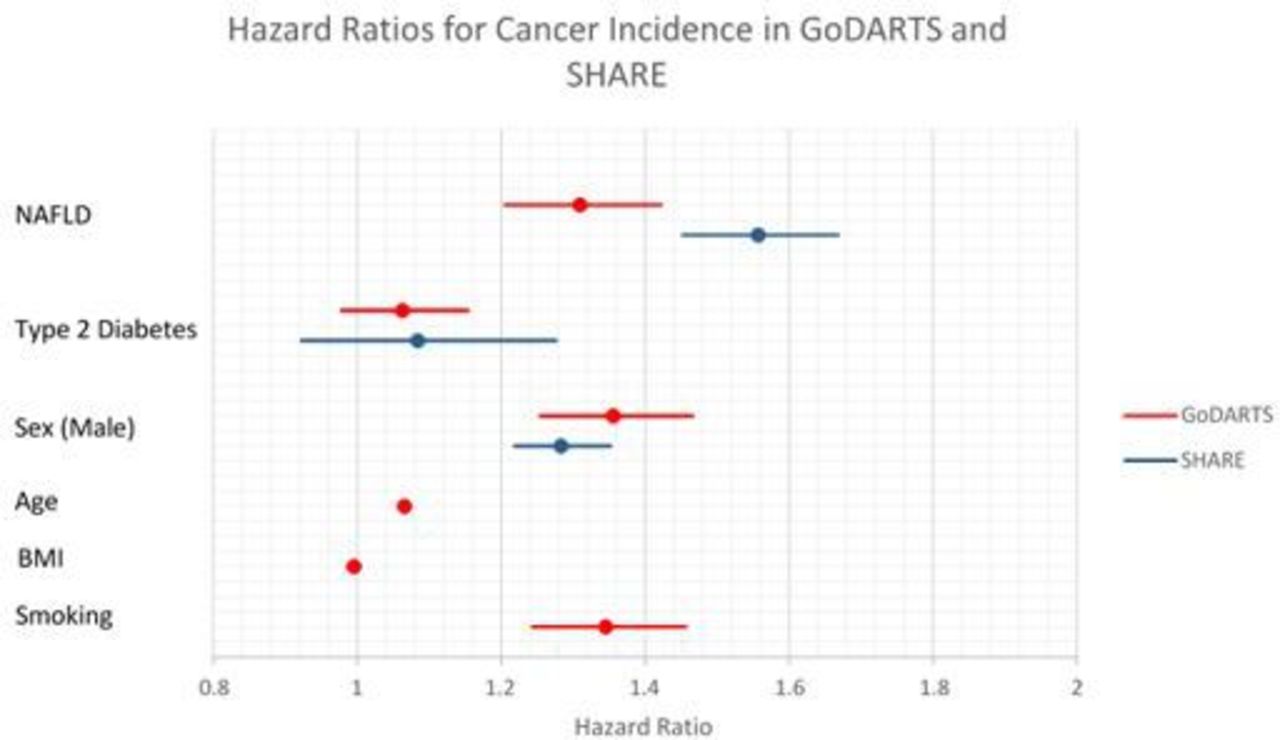
In the GoDARTS cohort, MDLD was associated with increased cancer incidence. During the follow-up period, 18.5% of controls compared with 22.2% of patients with MDLD developed cancer. In controls, 1244 patients had cancer incidents and 1550 patients had incidents in MDLD cases. Patients who had MDLD at enrolment to GoDARTS had increased cancer incidence independent of sex, age, BMI, smoking status and diabetes status (figure 1, HR=1.31 (1.27 to 1.35), p<0.0001). Using the same covariates, the FLI was associated with increased cancer incidence (HR=1.004 (1.00 to 1.008), p=5.0×10⁻²) and FIB-4 score over 3.25 was associated with increased cancer risk (HR=1.31, 95% CI 1.29 to 1.53, p=3.2×10⁻³).

Hazard Ratios for Cancer Incidence in GoDARTS and SHARE - GoDARTS, Genetics of Diabetes Audit and Research Tayside, Scotland; SHARE, Scottish Health Research Register.
We tested whether BMI was associated with cancer incidence. When MDLD was not taken into account, BMI was associated with increased cancer incidence (HR=1.09 (1.01 to 1.18), p=3.1×10⁻²). This association was completely abrogated when adjusted for the presence of MDLD. Similar results were found for other markers of adiposity, weight and waist measurements.
When analysis was limited to obesity-related cancers, BMI was associated with increased cancer incidence (HR=1.01 (1.00 to 1.03), p=3.3×10⁻²). Similarly to the analysis of all cancer incidences, BMI was not associated with cancer incidence when MDLD was added as a covariate.
Similar results were found in the SHARE cohort. Out of 26 891 patients analysed, 5728 had cancer incidents in the follow-up period. MDLD was associated with increased cancer incidence (figure 1, HR=1.56 (1.45 to 1.67), p<0.0001). MDLD hospitalisation prior to baseline was associated with increased cancer risk, with a HR of 2.54 (95% CI 1.14 to 5.65, p=2.3×10⁻²). NASH was also associated with increased cancer incidence (HR=4.18 (1.74 to 10.0), p=1.4×10⁻³). Among the patients in SHARE, 1912 had BMI data available. In these patients, when MDLD was accounted for, BMI was not significantly associated with overall cancer incidence, or with obesity-related cancer incidence.
Similar results were found in the population-based diabetes cohort from T&F. Out of the 11 141 patients analysed, 1819 had cancer incidents in the follow-up period after the age of 60. MDLD was associated with cancer incidence in the follow-up period (HR=1.16 (1.04 to 1.29), p=5.9×10⁻³). Full results are shown in online supplemental appendix.
As well as increasing all primary cancer incidence, MDLD was associated with increased incidence of specific cancers in GoDARTS and SHARE, shown in figure 2. Due to lower numbers of cases, the CIs for these are wider than for all primary cancers combined. Breast and uterine cancer analyses were limited to women, with prostate cancer analyses limited to men. T&F was not meta-analysed in this analysis due to the primarily diabetic composition of the cohort, which did not capture those over 60 who did not go on to get T2DM. The ascertainment bias in this cohort that only contains individuals who did eventually get diabetes is likely to have resulted in the lower point estimate for MDLD in cancer risk that we have observed.

Hazard Ratios for Cancer Incidence at Specific Sites in Meta-Analyis of GoDARTS and SHAREGoDARTS, Genetics of Diabetes Audit and Research Tayside, NAFLD, non-alcoholic fatty liver disease; Scotland; SHARE, Scottish Health Research Register.
MDLD and cancer death
The relationship between MDLD and cancer death was analysed in GoDARTS. In a CPH model adjusted for age, sex, diabetes, BMI and smoking, MDLD was associated with increased risk of cancer death (HR=1.40 (1.21 to 1.61), p<0.0001). FLI was associated with increased cancer death risk in the same CPH model (HR=1.009 (1.002 to 1.015), p=9.8×10⁻³).
MDLD was associated with increased risk of non-cancer death in the same model (HR=1.23 (1.12 to 1.35), p<0.0001). To estimate the effects of MDLD specifically on cancer death more accurately, competing risks analyses were run.
A CRR using Fine and Grays’s method was run to analyse the association between MDLD and cancer death with non-cancer-related death as a competing risk. In a model with sex, T2DM, smoking, obesity and age, MDLD increased risk of cancer with a subdistribution HR (SHR) of 1.28 (95% CI 1.11 to 1.47, p<0.0001).
In SHARE, a CRR adjusted for sex and T2DM with non-cancer death as a competing risk was run. Patients with MDLD had a significantly higher risk of cancer death (SHR=3.12 (2.38 to 4.10), p<0.0001).
In those patients who died during the follow-up period of GoDARTS, MDLD was associated with increased chance of cancer being the main cause of death in a LR adjusted for age, sex, T2DM, smoking and BMI (OR=1.33 (1.10 to 1.62), p=3.6×10⁻³). This was also found in SHARE in a LR adjusted for sex and T2DM (OR=1.54 (1.17 to 2.03), p=2.0×10⁻³).
Further analysis showed that this association between MDLD and cancer death is one of the major drivers of the shorter life expectancies of patients with MDLD. This is shown in the online supplemental appendix. The proportion of all deaths with cancer as the main or a contributing cause in GoDARTS is shown in table 4.
Proportion of all deaths due to cancer stratified by NAFLD and type 2 diabetes status in GoDARTS
Further to the analyses in GoDARTS and SHARE, similar results were found in the T&F diabetics’ cohort. MDLD was associated with increased cancer death. (SHR=1.40 (1.20 to 1.63), p<0.0001) Full results are shown in the online supplementary appendix.
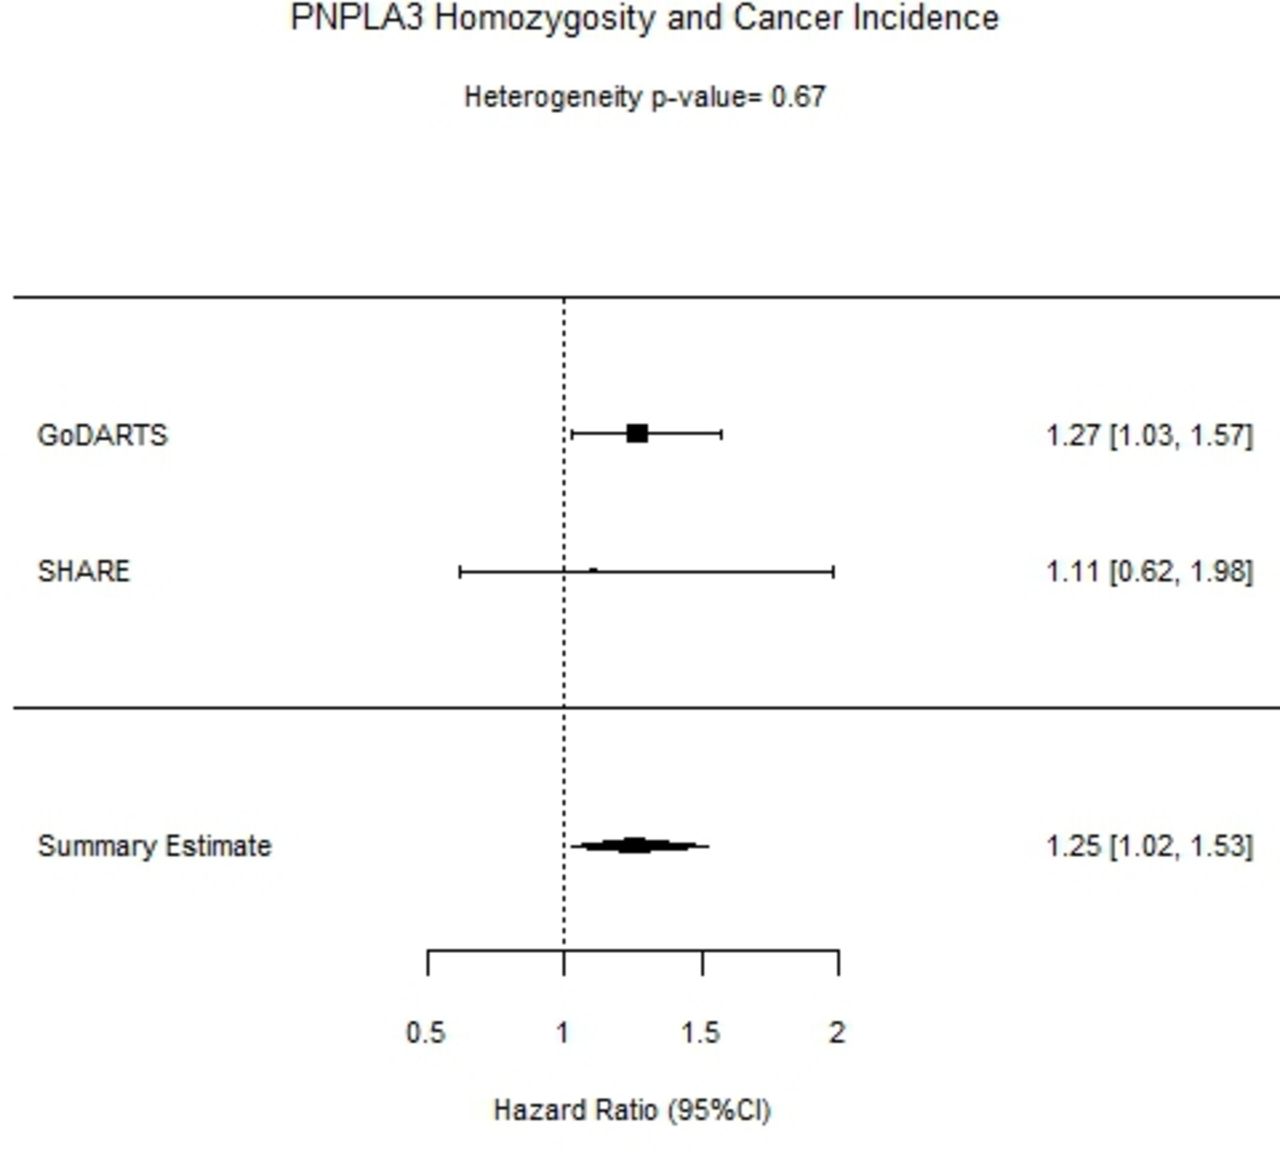
PNPLA3 and cancer incidence
The effects of PNPLA3 on cancer incidence during the follow-up period in GoDARTS and SHARE were evaluated. Homozygous carriers of PNPLA3 rs738409 had increased risk of cancer incidence (HR=1.27 (1.02 to 1.58), p=3.1×10⁻²). These results were meta-analysed with results from SHARE, shown in figure 3.
Forest plot of Cancer Incidence and PNPLA3 rs738409 in GoDARTS, SHARE, and meta-analysis of both cohorts. GoDARTS, Genetics of Diabetes Audit and Research Tayside, Scotland; SHARE, Scottish Health Research Register.
This association was also observed in GoDARTS when patients with liver cancer were excluded from analysis, as PNPLA3 rs738409 has been shown to increase liver cancer risk38 (HR=1.26 (1.01 to 1.58), p=3.8×10⁻²). Similar results were found in an adjusted CRR with death as a competing risk (SHR=1.24 (1.00 to 1.54), p=4.9×10⁻²).
Mendelian randomisation analysis was conducted to estimate the effect of MDLD on cancer incidence. Using the ratio method in a meta analysis of GoDARTS and SHARE, MDLD was found to be significantly associated with cancer incidence, with a β estimate of 1.33 (95% CI 0.18 to 2.49, p=0.023).
Discussion
Summary of key results
In this study, we found that a significant increase in cancer incidence exists in patients with MDLD, high FLI, high FIB-4 and NASH. We also report an association between the strongest genetic instrument for NAFLD risk (PNPLA3 rs738409) and cancer incidence. Cancer incidence and death were higher in those who had MDLD in GoDARTS, SHARE and T&F using the raised ALT definition as a surrogate of NAFLD. This demonstrates the generalisability of this result. This is the first truly large-scale observational study to show these associations as well as the first to show the effect of BMI on cancer incidence is driven to null when MDLD is accounted for. In SHARE and T&F, NAFLD admissions were associated with increased cancer incidence. NASH also increased cancer incidence, with a larger effect size than MDLD. Other non-invasive biomarkers, including FLI and FIB-4 score prior to enrolment to the GoDARTS study, were also found to increase risk of cancer during the follow-up period. These results support findings from other published studies that link NAFLD to cancer of all types.3 4 It also suggests that the more proinflammatory form of NAFLD, NASH, may have more of an effect and this may give clues to the biological mechanism(s).
Limitations
MDLD phenotype
The MDLD phenotype may be a limitation of this study. Case ascertainment for NAFLD is clinically performed using ultrasound or the gold-standard biopsy method. However, these tests are not routinely performed in order to diagnose NAFLD. Therefore, in a population cohort, data on liver biopsies and ultrasound scans are not commonly found. Instead, chronically raised ALTs in the absence of virological, immunoligcal and alcoholic liver insult are generally understood to indicate NAFLD.14 39 There is not only substantial evidence linking ALT levels to NAFLD but also evidence that NAFLD can exist in patients with normal ALT levels; however, the true normal range used in this study negates this.23 Furthermore, a non-sensitive MDLD phenotype would drive the association towards null, and, therefore, we cannot exclude the fact that the true association may be stronger than that we have observed. While we acknowledge that ALT levels may have a limited sensitivity for defining mild NAFLD, we have shown that our ALT-based definition is highly sensitive for more advanced cases, such as those with the FLI measured and those hospitalised with steatosis. In GoDARTS, SHARE and T&F, we estimated sensitivity to be 97.4%, 75.3% and 94.6%, respectively, for such advanced cases. Indeed, our use of exposures such as MDLD, FIB-4, FLI and NASH are included under the umbrella of metabolic associated fatty liver disease (MAFLD).16
Genetic evidence to further validate the main MDLD phenotype in this study is demonstrated by the observation that the major NAFLD susceptibility variant in PNPLA3, rs738409, was associated with our MDLD phenotype with an to a very similar magnitude to that previously reported.40 The high sensitivity of the phenotype and similar effects of other NAFLD related phenotypes on cancer incidence, plus previous literature linking NAFLD to cancer support the validity of the ALT based MDLD phenotype.3 4
While we show that our MDLD phenotype is accurate, even if part of the aetiology of the raised ALT levels is alcohol or another cause, this is still an important and interesting result. The observation that when ALT levels are taken into account, BMI no longer associates with cancer incidence changes current understanding of the link between cancer and obesity.
We found NASH to be associated with increased cancer incidence, and suggest its associated hepatic inflammation may contribute to cancer risk. The majority of patients with NASH however also have a diagnosis of fibrosis, which could mean the effect is fibrosis rather than inflammation driven.
Covariate data Missingness
The missingness of BMI and smoking data for patients in SHARE is a possible limitation of the current study. In the analysis of cancer incidence in GoDARTS, T&F and the sub-group of SHARE patients with BMI data available, the inclusion of BMI as a covariate did not modify the association between MDLD and cancer. In GoDARTS also, MDLD was not associated with rates of smoking when age and sex were adjusted for. Due to this, the analysis of MDLD and cancer without BMI and smoking as covariates is still valid, and comparable with the analyses undertaken in GoDARTS. Allen et al, used similar methodology, as they did not correct for smoking and found that BMI played a relatively small part in cancer risk compared with NAFLD.4 The self-reported nature of alcohol intake in GoDARTS, and missingness of this data in SHARE and T&F, as well as the ubiquitous nature of alcohol consumption at the sub clinical level, does not allow us to exclude the possibility that general alcohol consumption may play a role in the relationship between NAFLD and cancer, however this is likely to be a limitation of the concept of NAFLD in general.
BMI as a marker of obesity
BMI is an accurate and useful marker of obesity, although is not perfectly correlated with abnormal body fatness as factors such as muscle mass can impact the result.41 To assess whether this was a factor in the lack of association between BMI and cancer incidence, other measures of body fatness including waist measurement and weight were analysed. These also did not associate with cancer incidence when MDLD was taken into account.
Interpretation of results
HCC has long been associated with NAFLD and is widely recognised as one of the most severe endpoints of NAFLD.2 There is emerging evidence that the association between NAFLD and cancer extends beyond the liver to other parts of the body. Kim et al found in a cohort follow-up study that, in addition to an increased risk of liver cancer, NAFLD dramatically increased rates of extrahepatic cancers, including breast and colon in those who were diagnosed with NAFLD prior to the 10 year follow-up period.3 Allen et al similarly showed that NAFLD was associated with increased extrahepatic cancer risk, in sites such as the colon, lung and prostate.4 In the current study, we found an increase in cancer incidence in many of these specific sites, including breast, colon, liver, lung and prostate. Collectively, these data, including the results that we describe, supports the notion that NAFLD increases incident cancer risk.
We found that MDLD was also associated with increased risk of cancer death in all three cohorts. This data correlates with our earlier findings that NAFLD is associated with increased cancer incidence, as increased incidence is naturally linked to increased mortality. Analysis of causes of death as reported by ICD10 codes in medical records showed that the deaths of patients with MDLD were more likely to be due to cancer. Cancer was also responsible for a large amount of the shorter lifespans of patients with MDLD, as there was no significant effect of MDLD on age of death when patients with a cancer diagnosis were excluded. Similar results were found in a recent study in a large Swedish cohort with biopsy confirmed NAFLD.42 In this study, Simon et al found that excess death in NAFLD patients was primarily driven by extra-hepatic cancers and cirrhosis, while other causes such as cardiovascular disease and HCC had only a small effect. These findings agree with those of the current study, further implicating NAFLD in the development of extrahepatic cancer.
We showed that homozygous carriers of the PNPLA3 NAFLD risk variant, rs738409, had an increased risk of cancer incidence. In a Mendelian randomisation analysis, we showed PNPLA3 rs738409 increased MDLD incidence, MDLD increased cancer incidence, and PNPLA3 rs738409 increased cancer incidence. This novel finding is supporting evidence that MDLD is causally associated with increased cancer incidence.
Substantial evidence links cancer to hyperinsulinemia. For example, hyperinsulinemia has been found to be a risk factor for colon cancer.43 Patients with NAFLD are more likely to have hyperinsulinemia, and this is associated with reduced insulin clearance.44 This insulin excess may underlie, at least in part, the mechanistic basis by which NAFLD increases cancer incidence, as insulin/Igf-1 may promote tumour formation through mitogenic pathways downstream of their receptors.45 Furthermore, NAFLD is a pro-inflammatory state that may inhibit cell cycle checkpoints. The larger effect sizes of NASH and FIB-4 on cancer incidence observed in this study are consistent with the notion of inflammation driving a proportion of cancer risk. Indeed, this observation has been validated recently in a study by Pfister et al, which showed inhibited anti-tumour surveillance in those with HCC caused by NASH.11
In a model adjusted for age and sex, BMI was found to be associated with increased cancer incidence. Many studies have shown increased cancer risk with increasing BMI, therefore this finding is consistent with previous literature. We found that BMI was not associated with overall cancer incidence when NAFLD was taken into account, and the same was found for waist and weight measurements. We also found that individuals who were obese but did not have MDLD were not at increased risk of cancer incidence compared with those of a healthy weight. This finding supports those of Allen et al.4 When we limited analyses to so-called obesity related cancers, we found similar results, as BMI was associated with cancer incidence, but not when MDLD was adjusted for. This was found in all three cohorts analysed. The lack of independent association between BMI and cancer incidence in our study may suggest that NAFLD is a major component in the increased risk of cancer observed in overweight and obese patients.
Generalisability
The results of this study are generalisable to those of white European descent, and especially those who are at increased risk of NAFLD including patients with obesity and T2DM. Given the high prevalence of obesity, T2DM and other metabolic dysfunctions, the results have important implications for a large portion of the population. The large number of participants involved allowed for high statistical power further ensuring the external validity of results. The use of population-level data in the T&F replication limited the influence of selection bias on results.
Conclusion
In the current study, we have shown that MDLD is associated with increased risk of cancer incidence. There is also an association between MDLD and cancer death, and cancer is a key factor in the shorter life expectancies associated with MDLD patients. Furthermore, we are first to show the association between BMI and cancer is driven to null when MDLD is included in the model. This is further replicated in two additional, large cohorts, demonstrating the robust nature of this relationship. Given the large numbers of participants, these findings are likely generalisable to the general population. A key, novel finding of the study was that the missense variant PNPLA3 rs738409 is associated with increased cancer incidence. These findings suggest that the effect of NAFLD on cancer incidence may be causative, and that a major component of the association between body weight and cancer may be driven by NAFLD.
Data availability statement
Data may be obtained from a third party and are not publicly available. Data will not be published.
Ethics statements
Patient consent for publication
Ethics approval
This study involves human participants and was approved by NHS Tayside Ethics committee GoDARTS—Tayside Medical Ethics Committee 053/04. Ethics committee SHARE—East of Scotland NHS REC 13/ES/0020. Participants gave informed consent to participate in the study before taking part.
Acknowledgments
We are grateful to all the participants in this study, the general practitioners, the Scottish School of Primary Care for their help in recruiting the participants and to the whole team, which includes interviewers, computer and laboratory technicians, clerical workers, research scientists, volunteers, managers, receptionists and nurses. The study complies with the Declaration of Helsinki. We acknowledge the support of the Health Informatics Centre, University of Dundee, for managing and supplying the anonymised data and NHS Tayside, the original data owner. The NHS provided ethical approval for access to the anonymised data. Dissemination of the results of this study to participants was not applicable. Ethics committee GoDARTS—Tayside Medical Ethics Committee 053/04. Ethics committee SHARE—East of Scotland NHS REC 13/ES/0020. We acknowledge the support of the NIHR for data acquisition. SHARE has ongoing funding from NHS Research Scotland and established by funding from The Wellcome Trust Biomedical Resource Grant Number 099177/Z/12/Z. The Wellcome Trust United Kingdom Type 2 Diabetes Case Control Collection (GoDARTS) was funded by The Wellcome Trust (072960/Z/03/Z, 084726/Z/08/Z, 084727/Z/08/Z, 085475/Z/08/Z, 085475/B/08/Z) and as part of the EU IMI-SUMMIT program.
References
Supplementary materials
Supplementary Data
This web only file has been produced by the BMJ Publishing Group from an electronic file supplied by the author(s) and has not been edited for content.
Footnotes
Contributors AT, MKS, CNAP and JFD contributed to the study design, data collection, analysis, interpretation and drafting and critical revision of the manuscript.PA, BC, CH and JA contributed to the data analysis, interpretation, drafting and critical revision of the manuscript. ASFD and ERP contributed to data collection and critical revision of the manuscript. All authors participated in the critical revision and final approval of this manuscript. AT acts as guarantor.
Funding This study was funded by AstraZeneca through Stratified Medicine Scotland Innovation centre.
Disclaimer The funders had a role in the design and conduct of the study; analysis, interpretation of the data, preparation, review and approval of the manuscript for publication.
Competing interests Philip Ambery, Javier Armisen, Benjamin Challis and Carolina Haefliger are employees of AstraZeneca and are shareholders of AstraZeneca.
Provenance and peer review Not commissioned; externally peer reviewed.
Supplemental material This content has been supplied by the author(s). It has not been vetted by BMJ Publishing Group Limited (BMJ) and may not have been peer-reviewed. Any opinions or recommendations discussed are solely those of the author(s) and are not endorsed by BMJ. BMJ disclaims all liability and responsibility arising from any reliance placed on the content. Where the content includes any translated material, BMJ does not warrant the accuracy and reliability of the translations (including but not limited to local regulations, clinical guidelines, terminology, drug names and drug dosages), and is not responsible for any error and/or omissions arising from translation and adaptation or otherwise.