Article Text

Abstract
Background and aims Chronic hepatitis B patients in Taiwan with no or limited liver injury are not reimbursed for antiviral treatment by the Taiwan National Health Insurance (NHI). Innovative fibrosis marker, age-adjusted Fibrosis-4 Index (FIB4-AA), was implemented to evaluate the tendency of liver fibrosis in these patients.
Methods The FIB-4 indices of 256 antiviral treatment-naïve chronic hepatitis B patients at Kaohsiung Medical University Hospital from 2003 to 2019 were reviewed. The difference in initial FIB-4 and last FIB4-AA was treated as a categorical variable, representing the tendency of liver fibrosis in each individual aside from ageing. Logistic regression was implemented to evaluate the three parameters most dependent on increment of FIB4-AA: e seroconversion, body mass index (BMI) and initial FIB-4 index.
Results The yearly FIB-4 growth rate of an individual without chronic hepatitis was lower than that of the study group (0.0237 vs 0.0273 for males, 0.02 vs 0.0288 for females). Patients undergoing or completing e seroconversion were less prone to increment of FIB4-AA (p=0.036, OR 0.524). Logistic regression revealed that BMI ≥25 kg/m2 significantly less increment of FIB4-AA (p=0.001, OR 0.383, 95% CI 0.212 to 0.690), while patients with initial FIB-4 <1.29 were prone to increasing liver FIB4-AA (p=0.000, OR 3.687, 95% CI 1.999 to 6.797).
Conclusion Chronic hepatitis B patients not meeting the reimbursement criteria of the Taiwan NHI are prone to increment of liver fibrosis marker. Overweight is associated with less increment of fibrosis marker, while initial FIB-4 <1.29 is associated with increasing fibrosis marker.
- hepatitis B
- hepatic fibrosis
- obesity
This is an open access article distributed in accordance with the Creative Commons Attribution Non Commercial (CC BY-NC 4.0) license, which permits others to distribute, remix, adapt, build upon this work non-commercially, and license their derivative works on different terms, provided the original work is properly cited, appropriate credit is given, any changes made indicated, and the use is non-commercial. See: http://creativecommons.org/licenses/by-nc/4.0/.
Statistics from Altmetric.com
Summary box
What is already known about this subject?
Liver fibrosis of chronic hepatitis B patients eventually leads to cirrhosis, decompensation and hepatocellular carcinoma (HCC). The fibrosis in hepatitis B carriers with low disease activity need further investigation.
Hepatic steatosis was known to reduce hepatitis B virus (HBV) replication. An inverse association between steatosis and HBV virological factors, particularly the amount of hepatitis B surface antigen, had been reported. However, steatosis is known to induce liver fibrosis and severe steatosis is also found to be associated with fibrosis in treatment-naive patients with chronic hepatitis B.
Body mass index (BMI) was an independent predictor of the degree of fat infiltration in liver.
Previous literature had concluded that chronic hepatitis B patients with fibrosis-4 index (FIB-4) <1.29 tend to have significantly reduced risk of HCC.
A positive correlation between FIB-4 and histological fibrosis stage had been reported, which made FIB-4 a simple, noninvasive tool to estimate liver fibrosis of chronic hepatitis B patients.
Currently, there is no longitudinal study to investigate the association between BMI and progression of liver fibrosis in patients with chronic hepatitis B.
Summary box
What are the new findings?
This study uses a novel age-adjusted Fibrosis-4 Index (FIB4-AA) as a logical, non-invasive method for a longitudinal evaluation of liver fibrosis.
Via FIB4-AA, chronic hepatitis B patient with low disease activity were shown to be under risk of liver fibrosis, and patients with low initial FIB-4 (<1.29) were under more risk of progression of fibrosis compared with patients with more fibrotic liver (FIB-4 >1.29).
The present study, to the best of our knowledge, is the first to show that being overweight (body mass index (BMI) larger or equal to 25) is associated with less increment of liver fibrosis marker in hepatitis B carriers. This finding was revealed by FIB4-AA, and was also observed by aspartate aminotransferase-to-Platelet Ratio Iindex (APRI)-growth (the difference between initial and last APRI score).
How might it impact on clinical practice in the foreseeable future?
In this study, FIB4-AA was shown to be a potential noninvasive tool to evaluate the progression of liver fibrosis for clinical implementation.
The current study also revealed that, overweight (BMI ≥25 kg/m2) hepatitis B carriers with low disease activity tend to have less risk of liver fibrosis when compared those with BMI <25 kg/m2. Further research to investigate the phenomenon will help elucidate the mechanism of hepatitis B virus and overnight/steatosis related liver fibrosis.
Our study revealed that the patients with low initial FIB-4 (<1.29) were under more risk of fibrosis progression, we believe more preemptive measures, such as vigorous follow-up with risk stratification and timely antiviral treatment, should be taken to prevent further fibrosis patients with less fibrotic liver (FIB-4 <1.29).
Background
Liver fibrosis and cirrhosis are serious complications of chronic hepatitis B (CHB) infection, and the fibrosis-4 index (FIB-4) has been used as a practical, non-invasive evaluation of liver fibrosis stage.1 2 The area under the receiver operating characteristic curve (AUROC) of FIB-4 was comparable or even superior to that of the aspartate aminotransferase (AST)-to-Platelet Ratio Index (APRI) in terms of ≥F2 fibrosis and cirrhosis, and the diagnostic power was similar to that of the FibroTest or even ARFI.1 2 A positive correlation between FIB-4 and histological fibrosis stage had been reported,3 4 which made FIB-4 a simple, non-invasive tool to estimate liver fibrosis of CHB patients.
According to the Taiwan National Health Insurance (NHI) reimbursement criteria, antihepatitis B virus (HBV) viral treatment (ie, interferon (since 2003) and nucleoside/nucleotide analogue (NUC) (since 2008)) was reimbursed only to patients with relatively severe disease (ie, liver failure) or impaired liver function tests to some degree and duration (table 1). Therefore, a large proportion of CHB carriers, who are considered to have low disease activity, do not meet the reimbursement criteria; hence, no antiviral treatment was prescribed. However, after decades of CHB infection, liver cirrhosis develops in 30%–40% of infected people, and hepatocellular carcinoma develops in 1%–5% of cirrhotic patients.5 6 Herein, we conducted a retrospective study of 256 CHB patients who did not receive any antiviral treatment for HBV and were regularly followed up with AST, alanine aminotransferase (ALT) and platelet count (PLT) documented for a least 18 months since 2003 to evaluate the natural progression of the FIB-4 indices of these patients with an innovative variable: age-adjusted FIB-4 (FIB4-AA).
Summary of the Taiwan NHI reimbursement criteria for noncirrhotic hepatitis B antiviral treatment*
Objectives
This study aimed to investigate the variables associated with liver fibrosis. The study cohort included CHB inactive carriers or, by definition, those who did not match the reimbursement criteria of the current Taiwan NHI for antiviral treatment.
Materials and methods
Patient cohort
From documentation since 2000, there were 764 CHB patients at Kaohsiung Medical University Hospital who all tested seropositive for hepatitis B surface antigen (HBsAg) when enrolled and 256 antiviral treatment-naïve patients with records of at least two sets of FIB-4 data. (Online supplemental figure 1 shows the inclusion and exclusion criteria.
Supplemental material
For all 256 patients, it was confirmed that before and during the study time frame, there was no major organ failure, no history of hepatocellular carcinoma, no history of alcohol abuse, no prescription of bone marrow suppression agents, no prescription of clopidogrel, no diagnosis of liver cirrhosis (according to imaging), no diagnosis of immune thrombocytopenia or thrombotic microangiopathy, no diagnosis of bone marrow disorder and no coinfection of HIV and hepatitis C virus (HCV). There was no previous or ongoing antiviral treatment for HBV (ie, interferon or NUC) during the duration of the FIB-4 follow-up. The duration of follow-up of each patient ranged from 1.5 to 15 consecutive years. The earliest documentation of FIB-4 (AST/ALT and PLT) was in 2003, and the last was in 2019. There were 244 patients with FIB-4 data sets comprised of PLT and AST/ALT from the same blood draw. Twelve patients’ initial or last FIB-4 were obtained by separate blood tests for AST/ALT and PLT, within a 60-day interval. Among the 256 patients, 239 had hepatitis B e-antibody (HBeAb) data available, 244 had hepatitis B e-antigen (HBeAg) data available, and 247 had data on either HBeAb or HBeAg available. A total of 226 patients had body mass index (BMI) information available.
Data collection
Patient data including age, sex, body weight, body height, liver imaging by abdominal ultrasonography or CT and associated medical history were collected when the patients were enrolled. Serological viral markers (HBsAg, HBeAg, hepatitis B e Ab (anti-HBe), anti-HCV antibody), liver function tests and PLT were available in the studied time frame. The FIB-4 follow-up criteria were defined as follows for each FIB-4 index:
AST and ALT were tested in the same blood test. PLT was obtained in the same blood test or in a different blood draw within a 60-day interval.
AST, ALT and PLT were deemed as a set for FIB-4.
The interval between the initial and the last set of FIB-4 was over 1.5 years, judged by the dates of the AST/ALT test.
Normal AST and ALT levels and liver cirrhosis
At Kaohsiung Medical University Hospital, normal AST and ALT levels were defined as ≤42 IU/mL and ≤40 IU/mL, respectively. The upper limit of normal (ULN) of ALT was appointed to be 40 IU/mL, the same value suggested by the Asian Pacific Association for the Study of the Liver.7 The Taiwan NHI reimbursement criteria for HBV antiviral treatment did not designate specific values for the ULN; instead, the ULNs of AST and ALT were determined by each medical unit. In 2018, the American Association for the Study of Liver Diseases (AASLD) suggested lower ULNs for ALT (35 IU/mL for males and 25 IU/mL for females) for CHB patients, and we adopted those ULNs to estimate the natural progression of FIB-4 in healthy individuals. Liver cirrhosis was determined before or on the date of the initial FIB-4 index. The diagnosis of cirrhosis was based on the findings of abdominal ultrasonography, CT or the presence of oesophageal or gastric varices on esophagogastroduodenoscopy. Although the 256 patients had no diagnosis of cirrhosis when enrolled, 5.5% (n=14) of the study cohort had an initial FIB-4 >2.65, indicating severe fibrosis.3
Serological assays
Blood PLT and serum AST levels, ALT levels were measured on a haematology and biochemistry autoanalyzer (Beckman Coulte, Brea, California, USA). Hepatitis B viral markers as HBsAg, HBeAg and HBeAb were tested by a commercial enzyme immunoassay (Abbott Laboratories, North Chicago, Illinois, USA).
Calculation of the FIB-4 index
The FIB-4 index was calculated according to the formula developed by Sterling et al,8 based on the cohort of the AIDS Pegasys Ribavirin International Coinfection Trial study9:
FIB-4=Age (years)×AST (U/L)/[PLT (109/L) * ALT1/2 (U/L)].8 10
Statistical analysis
The formula of FIB-4 per se included age as a multiplier, which clearly indicated that FIB-4 increases naturally by ageing. To neutralise the influence of ageing during the follow-up period, we calculated the patient’s last FIB-4 with their age at the initial FIB-4. The age-adjusted FIB-4 was referred to as FIB4-AA.
FIB4-AA=Age(1)×AST(2)/[PLT(2)×ALT(2)1/2]
Age (1), AST (1), ALT (1) and PLT (1) represent the parameters of the initial FIB-4.
Age (2), AST (2), ALT (2) and PLT (2) represent the parameters of the last FIB-4.
Subtracting the initial FIB-4 from FIB4-AA, we obtained FIB4-AA growth.
FIB4-AA growth=Age(1) ×{AST(2)/[PLT(2)×ALT(2)1/2] – AST(1)/[PLT(1)×ALT(1)1/2]}
FIB4-AA growth was deemed a categorical parameter, and depending on its positivity or negativity, and the interpretation would be as follows:
Patients with positive FIB4-AA growth were assumed to have tendency of worsening liver fibrosis status during the observed years.
Patients with zero or negative FIB4-AA growth were considered to have stationary or improved liver fibrosis status during the observed years.
Furthermore, another method was created to examine fibrosis without interference from age. Herein, we introduce ‘expected last FIB-4’, or FIB4(2)Exp:
FIB4(2)Exp = Age(2) × AST(1)/[PLT(1) × ALT(1)1/2]
As the formula indicates, AST, ALT and PLT were fixed as the initial test values, and the age of the patient at the last FIB-4 was used.
By subtracting the real-world last FIB-4, or FIB4(2), from FIB4(2)Exp, we obtain the ‘difference between FIB4(2) and FIB4(2)Exp’, or FIB4(2)ExpDiff:
FIB4(2)ExpDiff = FIB4(2) - FIB4(2)Exp
FIB4(2)ExpDiff was also treated as a categorical parameter, and depending on its positivity or negativity, its interpretation was the same as that of FIB4-AA growth.
Patients with positive FIB4(2)ExpDiff values were assumed to have tendency of worsening liver fibrosis status during the observed years.
Patients with zero or negative FIB4(2)ExpDiff values were considered to have stationary or improved liver fibrosis status during the observed years.
In terms of categorical values, the positivity and negativity of FIB4-AA growth and FIB4(2)ExpDiff of the 256 patients were identical, which suggested that the idea of FIB4-AA growth and FIB4(2)ExpDiff would be useful to convey the progression of liver fibrosis.
The mean and SD were calculated for continuous variables, and percentages were used for categorical variables. Pearson’s χ2 test was used to determine the independence of parameters with positivity and negativity of FIB4-AA growth, and p<0.05 in two-tailed tests was considered statistically significant. The parameters tested were sex, average age during follow-up, HBeAg, anti-HBe, BMI and initial FIB-4.
The average age during the follow-up was the mean age obtained from the initial and last FIB-4 data sets. The patients were categorised into three groups according to their average age (age <30, 30–60 and >60 years) for theχ2 test and then categorised with the cut-off ages of 35, 40 and 45 years for dichotomy studies.
A complete e antigen seroconversion was defined as the disappearance of HBeAg and appearance of HBeAb. In the studied group, most patients had been tested for HBeAg (n=244), but only 239 patients were tested for HBeAb, and three patients had been tested for HBeAb, but no definite HBeAg was available. A patient with negative HBeAg or positive HBeAb in the initial status was considered to be undergoing e antigen seroconversion or have complete e antigen seroconversion.
The patients were then categorised into four groups according to their BMI based on the classification of the Centers for Disease Control and Prevention (CDC, USA): BMI <18.5 kg/m2 (underweight), 18.5–25 kg/m2 (normal weight), >25 kg/m2 (overweight) and 30.0 kg/m2 or higher (obese), and the independence of different BMI groups were also checked by the χ2 test. χ2 tests were then applied to further dichotomy studies of independence, adopting cut-off BMIs ranging from 22 kg/m2 to 30 kg/m2, including BMI ≥23 kg/m2, a cut-off of overweight in the Asian population suggested by WHO,11 and BMI ≥25 kg/m2, a cut-off of overweight suggested by the CDC, USA.
According to Kim et al, an FIB‐4 cut‐off value of 1.0 and 1.6 helped to exclude severe fibrosis and cirrhosis, while 2.65 and 3.6 helped rule in severe fibrosis and cirrhosis.3 Therefore, the initial FIB-4 values were used to categorise the patients into five groups as FIB-4 <1, 1–1.6, 1.6–2.65 and >2.65 as this was a non-cirrhotic cohort. Then initial values were dichotomised with a cut-off value of 1.29 to observe independence. A FIB-4 cut-off value of 1.29 was chosen based on the fact that increased risks of cirrhosis, cirrhosis-related complications, hepatocellular carcinoma and liver-related mortality were observed in patients with FIB-4 > 1.29.12 13
Logistic regression was then performed to further evaluate the independence of parameters with significance suggested by previous χ2 tests: age, BMI, initial FIB-4 and e seroconversion.
The statistical significance of all tests was defined as p<0.05 in two-tailed tests. All analyses were performed using SPSS statistical software, V.25 (SPSS statistics, IBM).
Results
Basic demographic data
The FIB-4 changes of a total of 1294.25 person-years were collected. Table 2 shows the basic demographic data of the 256 patients. Of these patients, 181 (70.7%) were male, and the average age was 45.7 (10.3) years. Among the 256 patients, 239 had HBeAb information available, and 170 (71.1%) patients were HBeAb(+); 244 patients had HBeAg data available, and 167 (68.44%) tested negative for HBeAg; 247 patients had either HBeAb or HBeAg data available, and 188 (76.11%) were considered to be undergoing or have completed e seroconversion (ie, either tested positive for HBeAb or negative for HBeAg). A total of 226 patients had information on BMI; these patients had their body weight and body height checked when enrolled, and 95 (42%) patients were overweight or obese (BMI ≥25 kg/m2).
Basic clinical features of the chronic hepatitis B patients
Yearly growth rate of the FIB-4 index
According to the AASLD hepatitis B 2018 guidance,14 the liver function test ALT was set to have a ULN of 35 for males and 25 for females. The AST levels for males and females were also set to 35 and 25, respectively. For nonchronic hepatitis individuals aged 30–60 years old, the yearly FIB-4 growth rate was calculated to be 0.0237 (AST/ALT 35/35) for males and 0.02 (AST/ALT 25/25) for females. The yearly FIB-4 growth rate of the 256 patients was 1294.25 person-years, which was 0.0277 per year (male vs female=0.0273 vs 0.0288 per year). The yearly FIB-4 growth rate, whether male, female or the overall group, was larger than that of the assumed nonchronic hepatitis group.
For the study cohort, the yearly FIB-4 growth rate between the observed male (n=181) and female (n=75) groups was different (male vs female=0.02 vs 0.05), but this difference was nonsignificant (p=0.41) when tested with Student’s t-test.
Sex
Among the 256 patients, 139 (54%) patients had positive FIB4-AA growth; 53% (96/181) of the males had positive FIB4-AA growth, while 57% (43/75) of the females had positive FIB4-AA growth. The χ2 test showed no significant difference between the FIB4-AA growth of males and females (p=0.53).
e seroconversion
The seroconversion of HBeAg, or e seroconversion, was considered to be the introduction of an inactive phase for hepatitis B carriers and was also associated with a reduction in liver fibrosis and a lower incidence of cirrhosis.15 16
Negative HBeAg
There were 244 patients who had HBeAg data available, and 68.44% (167 patients) tested negative for HBeAg. The positive FIB4-AA growth group accounted for 58.97% (46/78) and 51.81% (86/166) of the HBeAg-positive and HBeAg-negative patients, respectively. In terms of the risk of fibrosis, negative HBeAg did not reach statistical significance (Pearson χ2 test, p=0.295, OR=0.748). However, complete e antigen seroconversion includes the disappearance of HBeAg and the appearance of HBeAb,15 and further analysis considering HBeAb was performed.
Positive HBeAb
In total, 239 of the 256 patients had HBeAb data available, of which 170 patients tested positive for HBeAb and 69 patients tested negative for HBeAb. The positive FIB4-AA growth group accounted for 50.59% (86/170) and 63.77% (44/69) of the HBeAb-positive and HBeAb-negative patients, respectively. The independence checked by Pearson’s χ2 test showed p=0.06, OR=0.582 and 95% CI 0.327 to 1.034, which was not significant enough to declare that HBeAb-negative patients were more prone to fibrosis than HBeAb-positive patients.
Negative HBeAg or positive HBeAb
Patients with available HBeAg or HBeAb data were pooled for further analysis (n=247). The 247 patients were divided by conditions of ‘HBeAg positive and HBeAb negative’ and ‘HBeAg negative or HBeAb positive’ to reflect the status of ‘non-e seroconversion’ and ‘undergoing or completed e seroconversion’, respectively. The positive FIB4-AA growth group accounted for 66.10% (39/59) of the non-e seroconversion patients and 50.53% (95/188) of the undergoing or completed e seroconversion patients, and Pearson’s χ2 test showed p0.036, OR 0.524 and 95% CI 0.285 to 0.964. Patients undergoing e seroconversion and those who completed e seroconversion were less likely to suffer from progression of liver fibrosis.
Age
Further study was performed to determine whether the age of the patient had an influence on FIB4-AA growth. When divided by age with a 30-year interval (ie, <30, 30–60 and >60years), patients under 30 years were prone to have increasing FIB4-AA (65.38%, 17/26), and the tendency (positive FIB4-AA growth >50%) remained among patients 30–60 years (56.22%, 113/201), then dropped to less than 50% (37.93%, 11/29) among patients >60 years, but the difference was still not significant (p=0.10).
To determine whether positive FIB4-AA growth depended on a specific cut-off age, the patients were separated dichotomously by cut-off ages of 35, 40, 45 and 50 years. The most significant cut-off age was 40 years (p=0.220, OR=0.724). The p values for the cut-off ages of 35, 45 and 50 were 0.39, 0.35 and 0.67, respectively, and all lacked statistical significance.
Body mass index
The next potential parameter for progressive fibrosis was BMI. In total, 226 patients had BMI recorded at enrolment. The patients were divided into four groups by their BMI according to the CDC classification (ie, BMI <18.5 kg/m2 (underweight), 18.5–24.9 kg/m2 (normal weight), ≥25 kg/m2 (overweight) and 30.0 kg/m2 or higher (obese)); 50% (3/6), 61.6% (77/125), 44.87% (35/78) and 35.29% (6/17) of patients classified as underweight, normal weight, overweight and obese, respectively, had positive FIB4-AA growth. There was a clear trend that, except for underweight patients, a larger BMI implies less progression of FIB4-AA. The trend was significant (p=0.035), as tested by Pearson’s χ2 examination.
To determine whether there is a specific cut-off value of BMI on which FIB4-AA growth depends, the patients were divided dichotomously into non-overweight (BMI <25 kg/m2) and overweight (BMI ≥25 kg/m2) groups for further analysis. Positive FIB4-AA growth was observed in 61.07% (80/131) of the patients in the non-overweight group and 43.16% (41/95) of the patients in the overweight group. This trend was also significant (p=0.0054, OR 0.469, 95% CI 0.432 to 1.214).
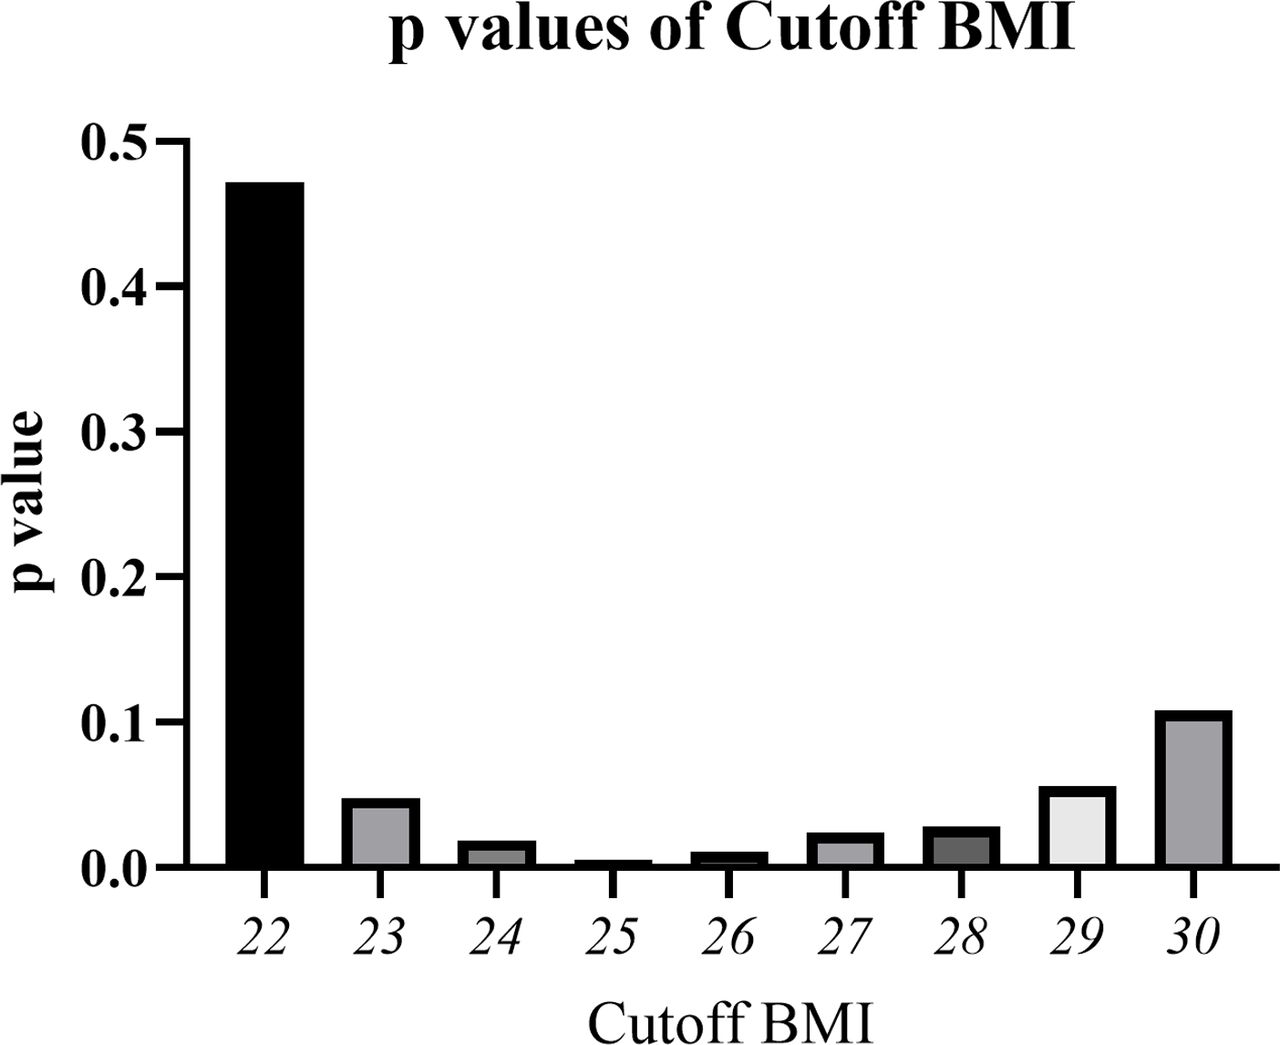
To determine the most significant cut-off BMI value, several cut-off BMI values were examined by the χ2 test. Significant dependence (p<0.05) of negative FIB4-AA growth or less progression of liver fibrosis was found between a BMI of 23 kg/m2 (p=0.048, OR=0.568, 95% CI 0.324 to 0.996) and a BMI of 28 kg/m2 (p=0.028, OR 0.431, 95% CI 0.201 to 0.926) (figures 1 and 2).

Cut-off BMI and significant dependence on less liver fibrosis. The significance (p value) of cut-off BMI values ranging from 22 to 30 kg/m2 was examined to determine the dependence between BMI and progression of liver fibrosis. Significant dependence (p<0.05) on negative FIB4-AA growth, or ‘less progression of liver fibrosis’, was found for BMIs ranging from 23 to 28 kg/m2, and the minimal p value appeared at BMI ≥25 kg/m2 (p=0.0054). BMI, body mass index; FIB4, Fibrosis-4 Index.

The OR of cut-off BMI values ranging from 22 to 30 kg/m2 was examined. A larger BMI tends to have an OR <1, which implies protection from liver fibrosis. ORs <0.5 were observed for cut-off BMI values ranging from ≥25 to 30 kg/m2, and the minimal OR (0.431) appeared at BMI ≥28 kg/m2. BMI, body mass index.
To further verify the influence of higher BMI towards liver fibrosis, AST to Platelet Ratio Index, APRI, without ‘age’ in the formula, was implemented. The difference between initial and last APRI was calculated, yielding APRI-growth. APRI-growth was designated in the same fashion of FIB4-AA growth.
APRI growth = [AST(2)/ULN]×100/PLT(2) - [AST(1)/ULN]×100/PLT(1)
APRI growth was also deemed a categorical parameter, and depending on its positivity or negativity, and the interpretation would be as follows:
Patients with positive APRI growth were assumed to have tendency of liver fibrosis status during the observed years.
Patients with zero or negative APRI growth were considered to have stationary or improved liver fibrosis status during the observed years.
Among the 226 patients, positive APRI growth was observed in 48.09% (63/131) of the patients in the non-overweight (BMI <25 kg/m2) group and 35.79% (34/95) of the patients in the overweight (BMI ≥25 kg/m2) group. This trend that overweight patients had less liver fibrotic risk was also observed (p=0.065, OR 0.602, 95% CI 0.350 to 1.034).
Initial FIB-4
The last parameter for categorisation was the initial FIB-4 index of each patient. The χ2 test was used to determine whether initial fibrosis status implies a risk of further fibrosis. The cut-off values of the initial FIB-4 index were set at 1.0, 1.29, 1.6 and 2.65, and the results showed that patients with a lower initial FIB-4 index (<1.6), tended to have progressive fibrosis.
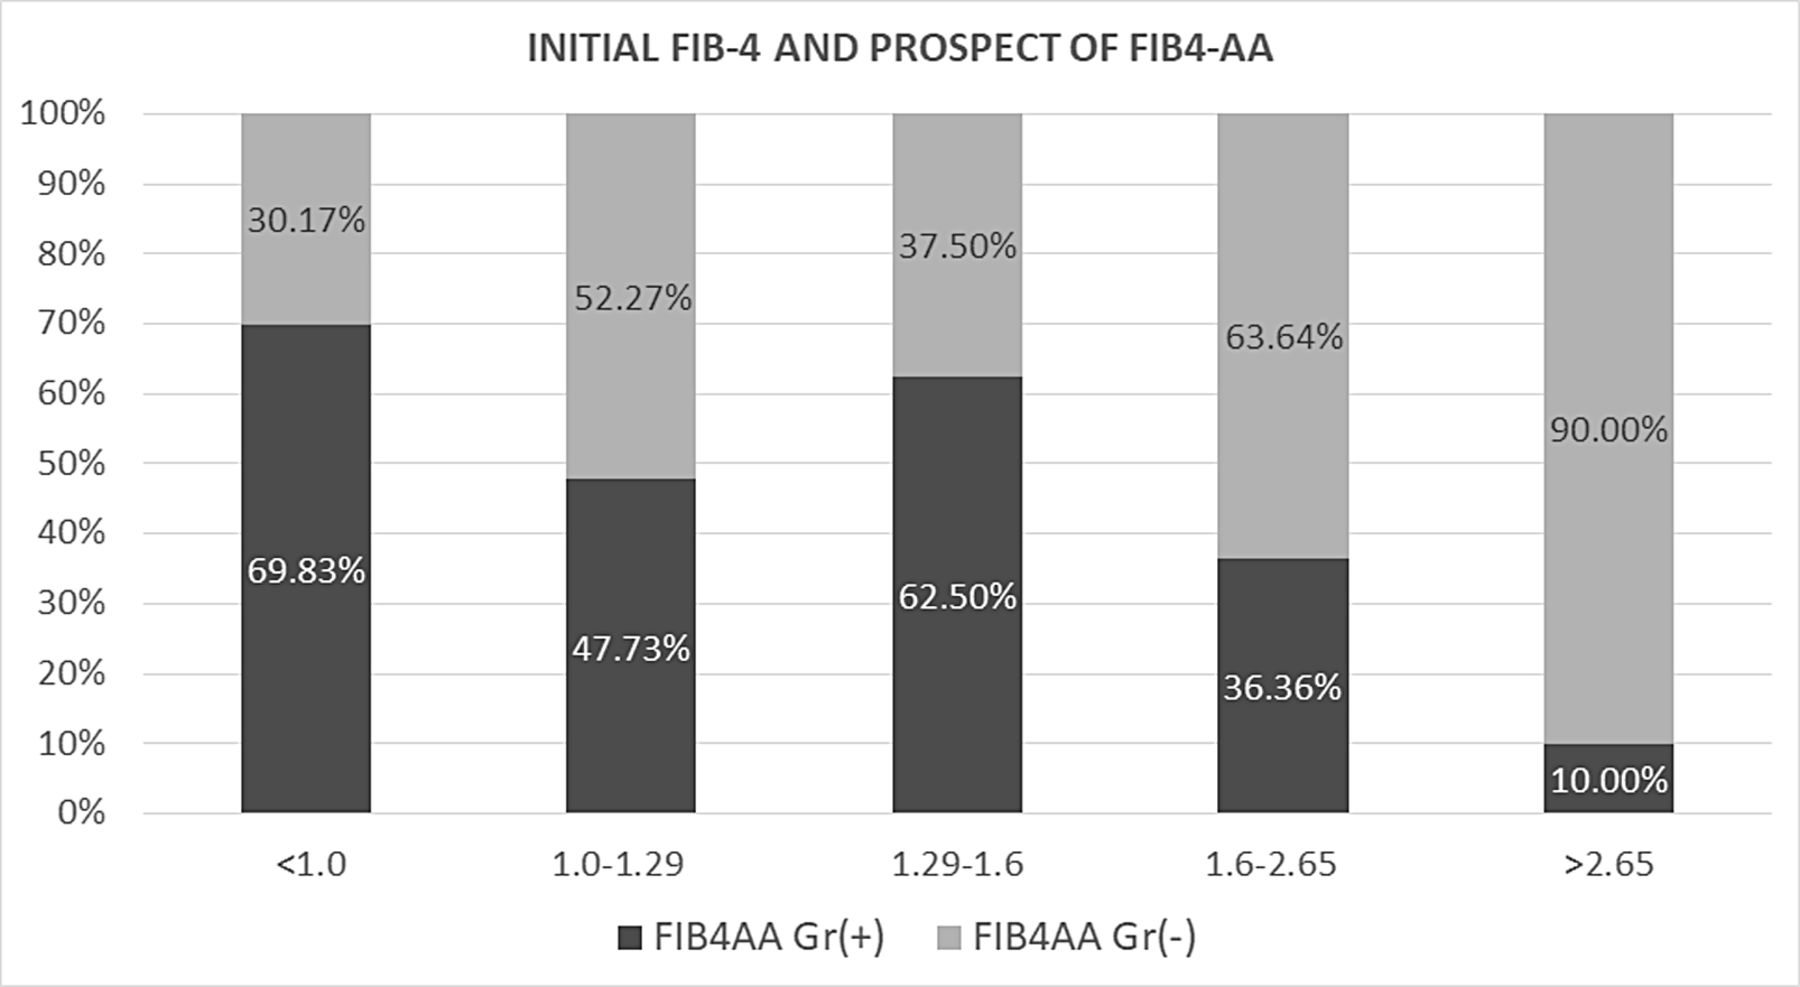
For initial FIB-4 <1.0 (n=116), 1.0–1.29 (n=44), 1.29–1.6 (n=32), 1.6–2.65 (n=44) and >2.65 (n=20), the percentages of positive FIB4-AA growth were 69.83%, 47.73%, 62.5%, 36.36% and 10.00%, respectively. The trend was significant (p=6.00E-07) (figure 3).

. For initial FIB-4 <1.0 (n=116), 1.0–1.29 (n=44), 1.29–1.6 (n=32), 1.6–2.65 (n=44) and >2.65 (n=20), the percentages of positive FIB4-AA growth were 69.83%, 47.73%, 62.5%, 36.36% and 10.00%, respectively. The trend was significant (p=6.00E-07) in that patients with a lower initial FIB-4 index tended to have progressive fibrosis. FIB-4, Fibrosis-4 Index.
The tendency of fibrosis was also significant for patients with initial FIB-4 <1.29 compared with patients with initial FIB-4 ≥1.29 (p=0.000, OR 2.784, 95% CI 1.650 to 4.697).
Logistic regression
The current study identified possible candidates factors related to FIB4-AA growth: e seroconversion (p=0.036, OR=0.524), BMI (for BMI >25 kg/m2, p=0.005, OR: 0.469) and initial FIB-4 (for initial FIB-4 <1.29, p=0.000, OR: 2.784), as listed in table 3.
Parameters associated FIB4-AA growth revealed by the χ2 test
A total of 218 patients with records of e seroconversion (either e antigen or e antibody), BMI and initial FIB-4 were pooled for logistic regression. The basic clinical features are listed in table 4.
Basic clinical features of the 218 chronic hepatitis B patients analysed by logistic regression
The logistic regression of the 218 patients revealed that BMI >25 kg/m2 was a significant factor in delaying fibrosis (p=0.001, OR 0.383, 95% CI 0.212 to 0.690), while a lower initial FIB-4 on enrolment implies a greater possibility of further fibrosis. A total of 88 of 134 (65.7%) patients with initial FIB-4 <1.29 were found to have fibrosis progression during follow-up. Compared with patients with an initial FIB-4 greater than or equal to 1.29, those with an initial FIB-4 <1.29 were significantly more likely to have fibrosis progression (p=0.000, OR 3.687, 95% CI 1.999 to 6.797) (table 5).
Parameters-associated FIB4-AA growth revealed by multiple logistic regression (n=218)
Discussion
FIB-4 was developed to estimate the fibrosis status of HCV and HIV coinfected patients in 2006 based on a multiple logistic regression model,8 and the logic of each parameter of FIB-4 was likely to be as follows. First, in a fibrotic liver, due to the delayed clearance of AST relative to ALT, the AST level tends to be higher than that of ALT. Second, as liver fibrosis progresses and portal hypertension develops, PLTs are reduced due to less thrombopoietin produced by hepatocytes17 and sequestration by an enlarged spleen. Finally, age is considered to reflect the duration of chronic hepatitis and hence the progression of liver fibrosis.18
Among other commonly used tools for liver fibrosis evaluation, FIB-4 and APRI use routine blood tests to follow chronic hepatitis patients, and FIB-4 had similar or better AUROC values for fibrosis ≥F2 and cirrhosis when compared with APRI.2
A meta-analysis concluded that the FIB-4 index was valuable for detecting significant fibrosis and cirrhosis in CHB-infected patients18 and had higher diagnostic accuracy for cirrhosis than APRI.3 FIB-4 index <1.29 even helps define patients with the lowest hepatocellular carcinoma risk.13
A positive correlation between FIB-4 and fibrosis stage of CHB patients had been reported, the mean value of the FIB‐4 was observed to increase from 0.60±0.50 in F0 to 3.27±2.24 in F4 as the fibrosis stage increases from 0 to 4.3 The positive correlation allowed an estimation of liver fibrosis progression via a simple calculation of FIB-4. However, the parameter of age, a numerator in FIB-4 formula results in FIB-4 increment. To eliminate the impact of ageing, the present study introduced new factors to analyse the associated parameters of liver fibrosis, such as e seroconversion, BMI and initial FIB-4.
By introducing the idea of FIB4-AA growth and FIB4(2)ExpDiff, the impact of ageing in the FIB-4 index formula was eliminated. When treated as categorical parameters, the positivity and negativity of FIB4-AA growth and FIB4(2)ExpDiff were identical in the 256 patients. The integrity of the results of the two calculations proved that both FIB4-AA and FIB4(2)Exp effectively convey the progression of liver fibrosis, and positive FIB4-AA growth or FIB4(2)ExpDiff implies ‘tendency of worsening liver fibrosis’, while zero or negative FIB4-AA growth or FIB4(2)ExpDiff implies ‘stationary or ameliorating liver fibrosis’. The idea of FIB4-AA and FIB4(2)ExpDiff could be applied to further data mine FIB-4 records to help elucidate the process of liver fibrosis.
The 256 CHB patients underwent regular follow-up at Kaohsiung Medical University Hospital and were not qualified to receive antiviral treatment during the observed period according to the Taiwan NHI criteria. The criteria are summarised in table 1. According to the criteria, these 256 patients were regularly followed and had no conditions of liver decompensation (defined as prolonged prothrombin time ≥3 s or total bilirubin ≥2.0 mg/dL), e antigen-positive patients had no significant flare up, and e antigen-negative patients had no persisting hepatitis. However, under the current criteria, patients still suffer from increment of liver fibrosis markers. The presumed yearly FIB-4 growth rate of an individual without chronic hepatitis was lower than that of the study group (0.0237 vs 0.0273 for males, 0.02 vs 0.0288 for females).
HBeAg seroconversion, defined as the loss of HBeAg with the appearance of anti-HBe, is often associated with clinical remission, a transition to inactive liver disease,19 and is an important end point in the treatment of hepatitis B.15 A reduction in liver fibrosis and lower incidences of cirrhosis have been observed with HBeAg seroconversion.16 χ2 tests showed that HBeAb positivity (n=239) was a protective factor (p=0.06), and when considering both e antigen-negative and e antibody-positive patients (n=247), statistical significance was reached (p=0.036). Though logistic regression for the 218 patients showed that HBeAg seroconversion was not significant enough to halt the increment of fibrosis marker (p=0.183), a larger person-year study may help to clarify the role of e seroconversion.
The current study showed that overweight, or BMI ≥25 kg/m2, was significantly associated with a lack of increase in FIB4-AA, which could imply less risk of liver fibrosis progression. In fact, the trend was significant (p<0.05) when the cut-off BMI was set to 23–28, and the ORs were <0.5 for BMI values in the range of 25–28. When tested with APRI, without the influence of patient’s ‘age’, similar trend was also observed (p=0.065). The seemingly protective effect of higher BMI could be associated with increased fat infiltration in the liver20 or steatosis, which has been known to attenuate HBV replication21 22 and even help achieve the goal of HBsAg loss.23 24 On the other hand, HBV X protein was found to induce hepatic steatosis,25 and the liver steatosis group (mean BMI=27.16 kg/m2) was reported to be significantly associated with all-cause mortality and cancer in patients with CHB.24 In fact, steatosis per se, in the long run, may induce the progression of fibrosis.26 27
Despite disputes about the impact of liver steatosis on CHB patients, to the best of our knowledge, this study was the first to suggest that a certain degree of overweight is clinically favourable for reducing the tendency of liver fibrosis. Similar protective effect of overweight BMI against viral28 29 or tuberculosis28 30 infection had been reported in recent years, possible mechanisms includes increased CD4 cell counts29 or serum leptin concentration, the latter is positively associated with total body fat mass, and might affect T-helper 1/T-helper 2 balance in the host immune system.30 Though the significance stands when the cut-off BMI was set between 23 and 28 in the current study, a cut-off BMI ≥25 kg/m2 was most significant (p=0.0054, OR=0.469). As BMI ≥28 kg/m2 is generally regarded as a risk factor for steatosis-related liver fibrosis,31 32 it may be prudent to suggest a protective BMI between 24 kg/m2 and 26 kg/m2 for CHB carriers without any other existing comorbidities or risk of comorbidities instead of the ideal BMI <23 kg/m2 suggested by the WHO for Asians.11
Based on the fact that HBV viral load predicts liver fibrosis,33 records of the initial and final levels of HBV viral load and HBsAg titers of each individual, which this study lacks, would help explain the finding that overweight status suppresses liver fibrosis. In fact, a recent study indicated that high BMI hinders liver fibrosis improvement in patients under long-term HBV antiviral therapy,34 which implied that the potential protective effect of overweight BMI only works in patients with certain amount of viral load. Further studies should include liver biopsy and viral load to help confirm and elucidate the mechanism by which overweight reduces the progression of fibrosis.
The last parameter that significantly predicts liver fibrosis is the initial FIB-4 index. A low initial FIB-4 index, such as initial FIB-4 <1.29, implied a higher possibility of fibrosis in the current study (p=0.00, OR 3.687, 95% CI 1.999 to 6.797). This trend could be explained as follows: in the natural course of liver fibrosis, the HBV viral load is gradually reduced over the years,35 a more advanced fibrotic status may imply a lower viral load, and a lower level of circulating virus leads to less fibrosis progression.36 A similar trend was found when the patients were divided into age <30, 30–59 and ≥60 years, though statistical significance was not reached (p=0.10); older patients were found to be less prone to liver fibrosis.
This finding should attract our attention, as FIB-4 >1.29 implied a higher risk of developing hepatocellular carcinoma,12 and proactive measures should be taken to prevent or even reverse liver fibrosis in so-called inactive carriers. Antiviral treatments such as NUCs should be considered if HBV DNA is detectable.37
Our study has a few limitations. First, it was a retrospective study that collected FIB-4 data from treatment-naïve CHB patients, and PLTs were not routinely followed at every outpatient department. These 256 patients with adequate FIB-4 data available may introduce bias, as PLT was checked by either the preference of the primary care doctor, such as those who wanted to check FIB-4, or some clinical events in the study period that necessitated the check of a complete blood count. However, during the time frame of the study, the patients had never encountered clinical events fulfilling the Taiwan NHI HBV antiviral treatment reimbursement criteria; therefore, it was still a comparable cohort of so-called ‘inactive carriers’, providing a study base to evaluate the progression of liver fibrosis. Second, the study included a relatively smaller sample size, and a larger person-year data set may help elucidate the role of e seroconversion, which is significantly protective in fibrosis (p=0.036), but lost its significance (p=0.183) in multivariate logistic regression. Third, initial and last records of HBV viral load, which the current study lacks, may help elucidate the mechanism behind the findings that BMI ≥25 kg/m2 is associated with less increment of FIB4-AA, while initial FIB-4 <1.29 is a risk factor for increasing FIB4-AA.
Conclusion
CHB patients not meeting the reimbursement criteria of the Taiwan NHI are prone to increment of liver fibrosis marker. Overweight is associated with less increment of fibrosis marker, while initial FIB-4 <1.29 is associated with increasing fibrosis marker.
Acknowledgments
The authors thank Taiwan Liver Research Foundation (TLRF) for collection of the clinical data. The TLRF did not influence how the study was conducted or the approval of the manuscript. The authors had full access to all of the data in the study and take responsibility for the integrity of the data and the accuracy of the data analysis.
References
Supplementary materials
Supplementary Data
This web only file has been produced by the BMJ Publishing Group from an electronic file supplied by the author(s) and has not been edited for content.
Footnotes
Twitter @davyliu0708
Contributors Study concept and design: T-WL and M-LY. Acquisition of data: T-WL, P-CT, C-YD, M-LY and W-LC. Data analysis and interpretation: T-WL, P-CT, M-LY, C-FH, T-YJ, J-FH, C-YD, W-LC and M-LY. Drafting of the manuscript: T-WL. Critical review of the manuscript for important intellectual content: M-LY. Statistical analysis: T-WL, P-CT and C-FH. Administrative, technical and material support: P-CT, T-WL, C-FH and M-LY. Study supervision: W-LC and M-LY. All the authors approved the final version of the manuscript.
Funding The authors have not declared a specific grant for this research from any funding agency in the public, commercial or not-for-profit sectors.
Competing interests None declared.
Patient consent for publication Not required.
Ethics approval All enrolled patients gave informed consents as approved by the research ethics committee of Kaohsiung Medical University Hospital.
Provenance and peer review Not commissioned; externally peer reviewed.
Data availability statement The data in this study were collected from the patients of Kaohsiung Medical University Hospital by Hepatobiliary Division, Internal Medicine, Kaohsiung Medical University Hospital. Data are available on reasonable request.
Supplemental material This content has been supplied by the author(s). It has not been vetted by BMJ Publishing Group Limited (BMJ) and may not have been peer-reviewed. Any opinions or recommendations discussed are solely those of the author(s) and are not endorsed by BMJ. BMJ disclaims all liability and responsibility arising from any reliance placed on the content. Where the content includes any translated material, BMJ does not warrant the accuracy and reliability of the translations (including but not limited to local regulations, clinical guidelines, terminology, drug names and drug dosages), and is not responsible for any error and/or omissions arising from translation and adaptation or otherwise.