Article Text

Abstract
Objective When screening for colorectal cancer (CRC) using quantitative faecal immunochemical tests (FIT), test parameters requiring consideration are the faecal haemoglobin concentration (f-Hb) positivity cut-off and the number of stools sampled. This observational study explored variation in f-Hb between samples and the relationship between sensitivity for advanced neoplasia (AN, cancer or advanced adenoma) and colonoscopy workload across a range of independently-adjusted parameter combinations.
Design Quantitative FIT data (OC-Sensor) were accessed from individuals undergoing personalised colonoscopic screening with an offer of 2-sample FIT in the intervening years. We estimated variation in f-Hb between samples in 12 710 completing 2-sample FIT, plus test positivity rates (colonoscopy workload) and sensitivity for AN according to parameter combinations in 4037 instances where FIT was done in the year preceding colonoscopy.
Results There was large within-subject variability between samples, with the ratio for the second to the first sample f-Hb ranging up to 18-fold for all cases, and up to 56-fold for AN cases. Sensitivity for AN was greatest at lower f-Hb cut-offs and/or using 2-sample FIT. Colonoscopy workload varied according to how parameters were combined. Using different cut-offs for 1-sample FIT and 2-sample FIT to return similar sensitivity, workload was less with 2-sample FIT when the sensitivity goal exceeded 35%.
Conclusion Variation in f-Hb between samples is such that both parameters are crucial determinants of sensitivity and workload; independent adjustment of each should be considered. The 2-sample FIT approach is best for detecting advanced adenomas as well as CRC provided that the colonoscopy workload is feasible.
- colorectal cancer screening
- colonoscopy
- gastrointestinal bleeding
This is an open access article distributed in accordance with the Creative Commons Attribution Non Commercial (CC BY-NC 4.0) license, which permits others to distribute, remix, adapt, build upon this work non-commercially, and license their derivative works on different terms, provided the original work is properly cited, appropriate credit is given, any changes made indicated, and the use is non-commercial. See: http://creativecommons.org/licenses/by-nc/4.0/.
Statistics from Altmetric.com
Summary box
What is already known about this subject?
Quantitative faecal immunochemical tests allow flexibility in screening for colorectal neoplasia but because there is day-to-day variation in the concentration of haemoglobin in stools, sampling just one stool compared with two increases the risk of missing a significant lesion, especially advanced adenomas which bleed less than cancers. Most organised screening programmes around the world adjust the cut-off for test positivity so as to control the colonoscopy workload when using just one sample, but there has been little consideration of the workload implications when positivity cut-off is assessed in relation to the number of samples collected.
What are the new findings?
Due to the very large variation in faecal haemoglobin concentration demonstrated between samples, many advanced adenomas were missed when sampling just one stool and especially when using a higher cut-off for test positivity. The findings demonstrated that a 1-sample test was not necessarily associated with a lower colonoscopy workload if a 2-sample test had its cut-off set independently to return a comparable sensitivity. If detection of advanced adenomas is an important goal of the screening programme and where a colonoscopy workload of >5% is feasible, a 2-sample test required fewer colonoscopies for an equivalent sensitivity.
Summary box
How might it impact on clinical practice in the foreseeable future?
Screening programmes wishing to reduce colorectal cancer incidence through detection of advanced adenomas, should carefully consider workloads associated with a 2-sample test as this is likely to provide better detection of advanced adenomas with a lower or equivalent colonoscopy workload.
Introduction
Many countries use faecal occult blood tests (FOBT) for colorectalcancer (CRC) screening in the form of either guaiac FOBT (gFOBT) or the newer faecal immunochemical tests for haemoglobin (FIT).1 The development of quantitative FIT has improved detection of colorectal neoplasia and is now the predominant FOBT screening technology used worldwide.1–3 Recent studies have shown that FIT reduces CRC mortality as well as incidence through detection and removal of early stage cancers or precancerous adenomas.4–6
Quantitation of faecal haemoglobin concentration (f-Hb) has provided flexibility for screening programmes to choose the criterion value (the ‘cut-off’ f-Hb at which a test is reported as positive) that triggers diagnostic colonoscopy.2 7–11 This facilitates planning of health service capacity to manage the resultant colonoscopy workload, but choice of cut-off also affects sensitivity for neoplasia.10 12–14
The positivity cut-off is not the only variable to be considered as it is known that blood loss from neoplasms and hence f-Hb varies from day to day.15 16 Traditionally, gFOBT-based screening has required collection of three stool samples to allow for this16 but the better sensitivity of FIT for CRC and advanced adenomas17 18 has resulted in a shift to sampling just one or two stools. Japan introduced 2-sample FIT screening in 1992 on the basis of a randomised controlled trial.19 Within a few years studies in Japan had shown a reduced mortality when screening with FIT compared with gFOBT.20 Most national organised population screening programmes now request sampling from just one sample1 3 although several regions including Australia,21 Slovenia22 and certain Canadian provinces3 elect to use a 2-sample approach.
The underpinning biological determinants for detection of a cancer or advanced adenoma by FIT are how much they bleed and how much it varies from day to day, while the technological determinant is the positivity cut-off chosen. Both test parameters—the cut-off and number of stools sampled—can be varied independently when using quantitative FIT8 23 and each should be carefully considered as there will be implications for key outcomes of a screening programme.14 24–26 Currently applied cut-offs vary from 15 to higher than 80 µg Hb/g faeces3 within organised screening programmes. Selecting a lower cut-off achieves better sensitivity for advanced neoplasia (cancer and advanced adenomas)7 9 but screening jurisdictions vary in how low they are prepared to go as lowering it is associated with a concomitant increase in the positivity rate, leading to a higher colonoscopy workload.9 Many countries have also chosen one sample as there is concern that requesting people to sample two rather than one stool might affect the participation rate which will in turn affect intention-to-screen outcomes. Given that f-Hb varies between stools, one sample could be positive while the other negative. Such disagreement in test positivity rate means that sensitivity for neoplasia will vary between stools depending on the chosen positivity cut-off.
As a result, shifting from a 2-sample test to a 1-sample test (or vice versa) affects sensitivity for neoplasia and colonoscopy workload (positivity rate in the screened population) unless the positivity cut-off is also adjusted.9 There has been little consideration of the approach where sample number and cut-off are simultaneously but independently adjusted. Choice of test parameters (variables of sample number and criterion value for the positivity cut-off) relate directly to the strategic goals of a programme, such as targeting a sensitivity for advanced adenomas that reduces incidence of CRC, choosing a feasible colonoscopy workload or compromising between the two with acceptable cost-effectiveness.
This study assessed sensitivity of FIT for advanced colorectal neoplasia and the associated population test positivity rates across a range of combinations of the two test parameters (each adjusted independently). We also assessed variation in f-Hb between samples and how this affected agreement (reproducibility) in test positivity at different cut-offs.
Methods
Overview
FIT and colonoscopy data were reviewed from a large population—the ‘SCOOP’ programme27–29—at increased risk for CRC and under surveillance with intermittently-scheduled colonoscopy plus a 2-sample FIT in the intervening years. Data from those completing FIT were analysed to determine within-individual variability between the first and second FIT, as well as population positivity rates for combinations of 1-sample FIT and 2-sample FIT with different f-Hb cut-offs. Data from a subgroup who had completed FIT within 12 months prior to colonoscopy were analysed for sensitivity for advanced neoplasia modelled across a wide range of cut-offs (10 to 150 µg Hb/g faeces) in the settings of 1-sample testing and 2-sample testing.
Population
Data were extracted for people enrolled in the SCOOP programme during the period July 2008 to April 2019. Enrolment was determined by their physician according to whether their risk (based on personal or family history of neoplasia) was sufficient to justify intermittent colonoscopy (usually third or fifth yearly) according to Australian guidelines.30 In addition to colonoscopy, individuals were given the opportunity to complete 2-sample FIT every 1 to 2 years between scheduled colonoscopies. The indication for being in the programme was personal history of colorectal neoplasia in 68.1% (13 095/19 229) and family history of CRC in all others.
All cases completing a 2-sample FIT were included for assessment of within-individual variability of f-Hb between the two samples, as well as estimation of population test positivity rate. Cases eligible for inclusion in the estimates of test sensitivity were those who had undergone a colonoscopy (regardless of the FIT result) and who had returned a 2-sample FIT in the preceding 365 days. Cases were excluded as follows: incomplete colonoscopy, poor preparation, uncertainty about the diagnosis, diagnosis of inflammatory bowel disease or a genetic syndrome (familial adenomatous polyposis or Lynch syndrome), or failed sample development.31
Programme interventions
FIT kits (OC-Sensor, Eiken Chemical Company, Tokyo, Japan) were provided by mail, with instructions as previously described.32 Participants were instructed to sample from two different stools (passed at least 30 min apart), to keep the samples in a cool place (eg, refrigerator) and to return the collected samples, with collection date and time, within 2 weeks. Determination of f-Hb followed manufacturer instructions as previously described32 and results expressed as µg Hb/g faeces. When a FIT result was positive (cut-off 20 µg Hb/g faeces (100 ng/mL sample buffer)) in either stool, the scheduled colonoscopy was brought forward.33
Colonoscopies were scheduled within participating institutions (Flinders Medical Centre, Bedford Park; Repatriation General Hospital, Daw Park; Noarlunga Hospital, Noarlunga Centre; South Australia) and were conducted according to best practice and accreditation requirements at the time. Pathological findings were characterised by colonoscopic appearance and histopathology.33
Outcomes and modelling
FIT positivity for the entire population was estimated across a range of cut-offs up to 150 µg Hb/g, using either the 1-sample (specifically the first sample) or 2-sample (highest in either sample) approach. Colonoscopy workload was defined as the FIT positivity rate for the entire population who returned a FIT according to the various cut-off and sample-number combinations. The sensitivity for advanced neoplasia in cases completing colonoscopy within 12 months of providing a 2-sample FIT, was determined as the proportion of cases returning a positive FIT at the different cut-off/sample number combinations.
Case phenotype for a given colonoscopic examination was defined as the most advanced pathology if multiple neoplasms were present, with the hierarchy being CRC, advanced adenoma, non-advanced adenoma and cases without neoplasia. Cancer was defined by presence of invasive colorectal adenocarcinoma. Advanced adenoma was defined by presence of adenoma with any of the following features: size ≥10 mm, high grade dysplasia or villous change, ≥3 adenomas of any size or type, sessile serrated adenoma with dysplasia or traditional serrated adenoma. Non-advanced adenoma consisted of any other adenoma state.
Statistical analysis
Agreement in f-Hb values between first and second samples was assessed using Bland-Altman analysis, with log transformation of the haemoglobin (Hb) values prior to analysis due to their positive skew. The upper and lower 95% LOA of the Bland-Altman plots provided the estimated degree to which 95% of subjects’ log-transformed Hb values differed between first and second samples. The upper and lower tolerance limits which represent the 95% CIs for the upper and lower LOA were also calculated.
The frequency of agreement of a FIT result between the first and second samples was assessed using logistic regression with agreement as the dependent variable, phenotype as the independent variable and using different cut-off values for agreement.
Test positivity rate across cut-offs (agreement within phenotypes) was assessed using Poisson regression with the total number positive as the dependent variable, cut-off as the independent variable and the total number of tests as the exposure. Results are expressed as a rate ratio for positivity at each cut-off versus a cut-off value of 10 µg Hb/g.
Log-transformed f-Hb levels were compared between phenotypes using linear regression. Back-transformation of the estimated coefficients was then used to provide the ratio of the geometric mean Hb between phenotypes.
All 95% CIs for positivity and sensitivity were calculated using the Exact method for a finite population and based on size of the group and of the relevant population from which it was drawn. Analyses were performed using Stata V.16.0 (StataCorp, USA), Excel and Prism. All hypothesis tests were two-sided with a Type 1 error rate of alpha=0.05.
Role of the funding source
Eiken Chemical Company provided test kits only and had no other roles including none in the study design, conduct or manuscript preparation. The corresponding author had full access to all the data in the study and had final responsibility for the decision to submit for publication.
Results
Participants
Of the 19 229 registrants in the SCOOP programme, a 2-sample FIT was returned on 50 396 occasions. FIT was completed correctly by 12 710 on 32 413 occasions, and 7.04% were positive considering a 2-sample test (either positive) and a cut-off for positivity of 20 µg Hb/g. Colonoscopies were undertaken on 18 717 occasions; 43.3% (8104/18 717) of these had a finding of cancer or adenoma.
Due to the study duration, some people underwent several colonoscopies; there were 4244 colonoscopies conducted in 3499 people within 365 days of completing the 2-sample FIT (figure 1). After exclusions, 4037 were eligible for outcome analysis. Advanced neoplasia was diagnosed in 15.5% (n=626) of the colonoscopies, which included 0.5% with CRC (n=21) and 15.0% with advanced adenomas (n=605). Adenomas of any type were detected in 44.7% (n=1804).

Details of participant engagement in surveillance and nature of the subpopulations used for modelling. FIT,faecal immunochemical test; f-Hb, faecal haemoglobin concentration.
Faecal haemoglobin concentrations
Clinical phenotypes of eligible cases with their demographic characteristics and f-Hb (for each sample and for the maximum of the two), are shown in table 1. The f-Hb in cancer cases were significantly higher than those in each other phenotypic group (p<0.001) and significantly lower in those with a normal colorectum than each other phenotype (p<0.001), regardless of which sample context was examined. The geometric mean of f-Hb in cases with advanced adenoma was 21.0% higher (Exp(β)=1.210; 95% CI=0.978 to 1.498) than those with low-risk adenoma (p=0.08, 2-sample FIT based on the higher value).
Clinical phenotypes of eligible cases with their demographic characteristics and faecal haemoglobin concentrations (for each sample and for the maximum of the two)
Comparison of haemoglobin concentration between first and second samples
Analysis of agreement (by Bland-Altman analysis) in f-Hb between the first and second samples is shown in online supplemental figure 1. There was no systematic fixed bias favouring either the first or second sample; mean difference in Hb between samples (all samples) was 0.003, 95% CI=-0.018 to 0.024 (loge µg Hb/g faeces), p=0.799, and for advanced neoplasia was 0.005, 95% CI −0.179 to 0.170, p=0.959. There was large within-subject variability between samples, with the ratio for the second to the first sample f-Hb ranging up to 18-fold for all cases, and even more widely for AN cases (up to 56-fold) (online supplemental table 1 and figure 1).
Supplemental material
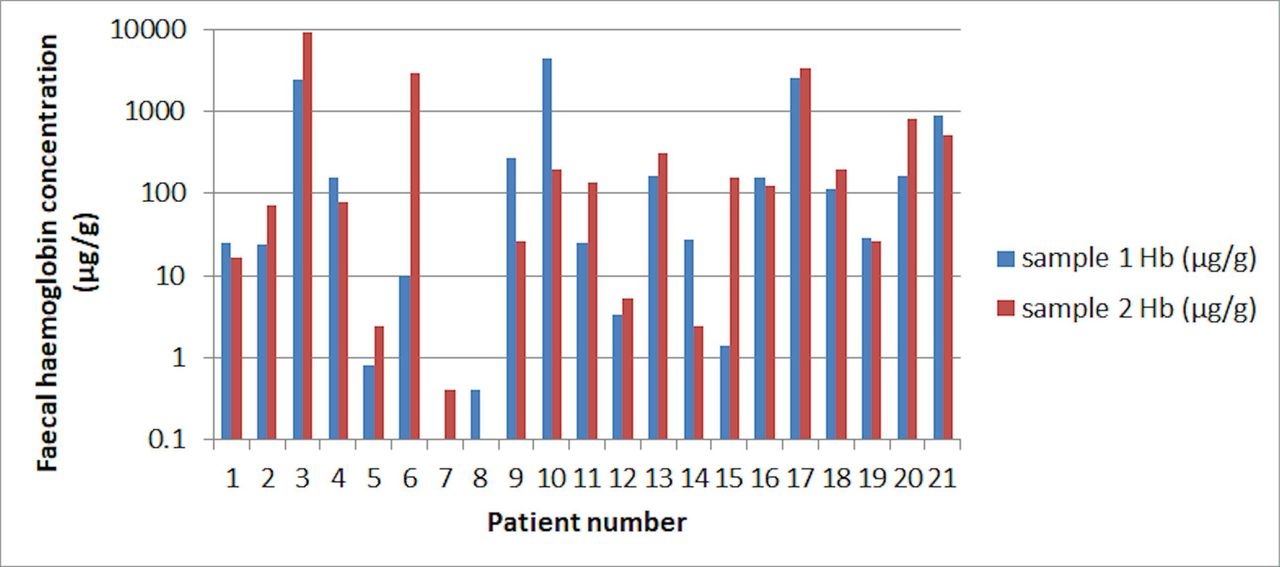
Actual f-Hb concentrations for first and second samples are shown for patients with cancer in figure 2. The proportion of cases that would be called positive with a 1-sample FIT, given a cut-off currently in use within screening programmes, would vary widely; the same would apply to advanced adenoma (data not shown).

Faecal haemoglobin concentrations for first and second samples in patients with colorectal cancer. Hb,haemoglobin.
Result concordance between samples
Due to the large variation in f-Hb between samples, we also examined the frequency of agreement of the result (concordancy) in the first and second samples at selected cut-off values in each phenotype (figure 3). Based on logistic regression, there were significant differences in concordancy across the range of cut-offs for all phenotypes (p<0.001 for each). At each cut-off, a positive result for both samples was more likely in cases with cancer compared with other phenotypes. For example, at a cut-off of 10 µg Hb/g a cancer phenotype was 8.7 times more likely to have both samples positive compared with cases without neoplasia (OR=8.7; 95% CI=2.5 to 31.1; p=0.001). For all other phenotypes, positive concordance was always highest at a cut-off of 10 µg Hb/g and fell significantly at the higher cut-offs (figure 3, p<0.001 for each phenotype) except for cancer (p=0.89).

Test result concordance (agreement between the first and second samples) at selected cut-offs for the main phenotypes. AdvAd, advanced adenoma; Adv Neopl, advanced neoplasia; Non-neopl, non-neoplastic.
Sensitivity for advanced neoplasia according to test parameters
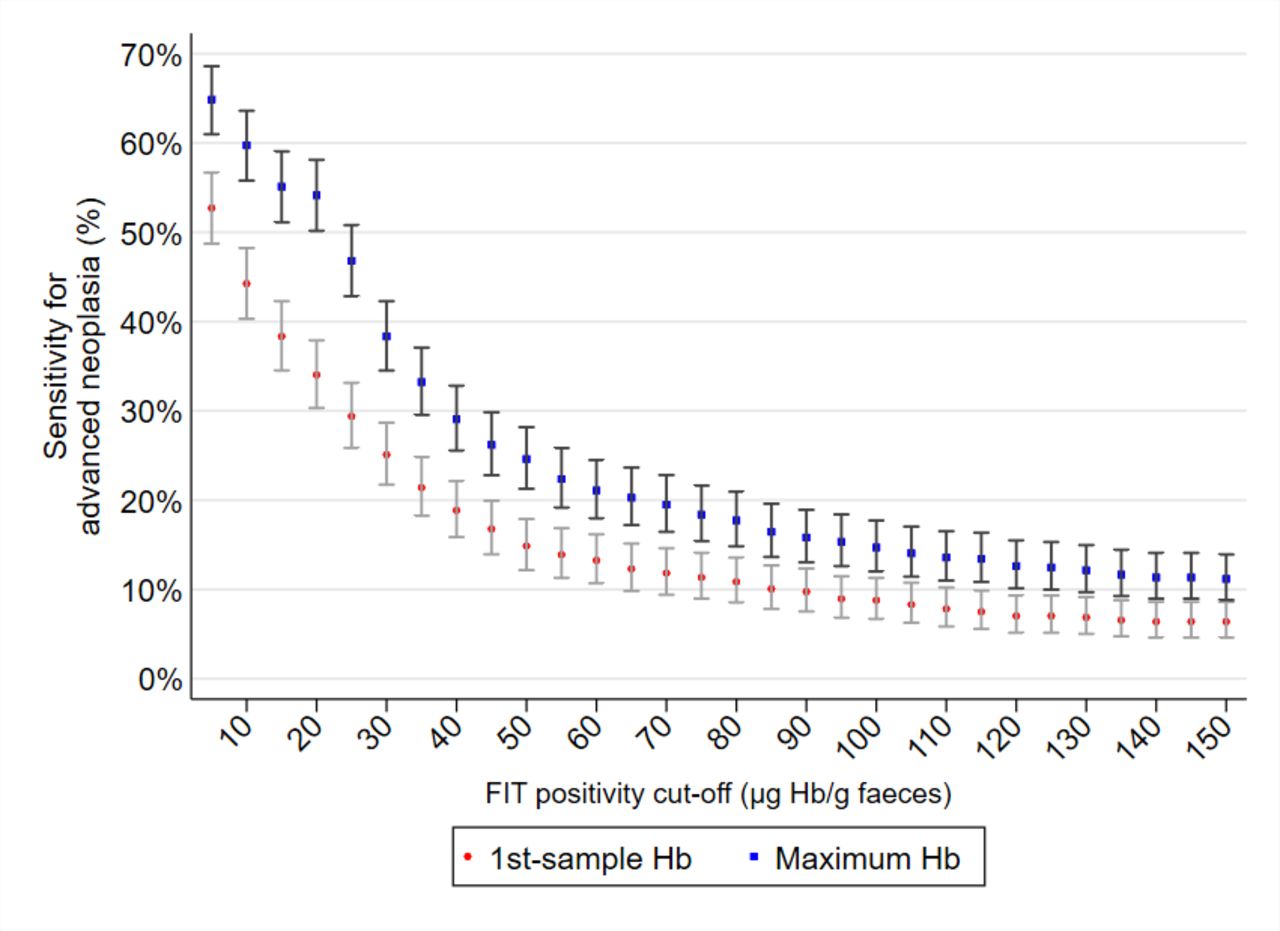
Figure 4 shows sensitivity for advanced neoplasia across a wide range of cut-offs for 1-sample and 2-sample tests. Sensitivity progressively rose as the cut-off value was lowered and was significantly higher for the 2-sample context at each cut-off. The rate ratios for advanced neoplasia (of sensitivity relative to those at 10 µg Hb/g) for 20, 40 and 80 µg Hb/g were 0.77, 0.43 and 0.24, respectively (p<0.001 for each).

Sensitivity for advanced neoplasia across a wide range of cut-offs for 1-sample (first sample) and 2-sample (maximum of the two) tests in the cases where colonoscopy was performed within 365 days of the 2-sample FIT (regardless of FIT result). Bars show 95% CIs. FIT,faecal immunochemical test; Hb, haemoglobin.
Actual sensitivities for cancer, advanced adenoma and advanced neoplasia at four selected cut-offs can be deduced for a 2-sample test by summing the percentages for positive concordance and discordant results shown in figure 3. For example, sensitivity for advanced adenoma was almost 60% at cut-off 10 µg Hb/g and fell to approximately 17% at cut-off 80 µg Hb/g.
Population test positivity rate according to test parameters
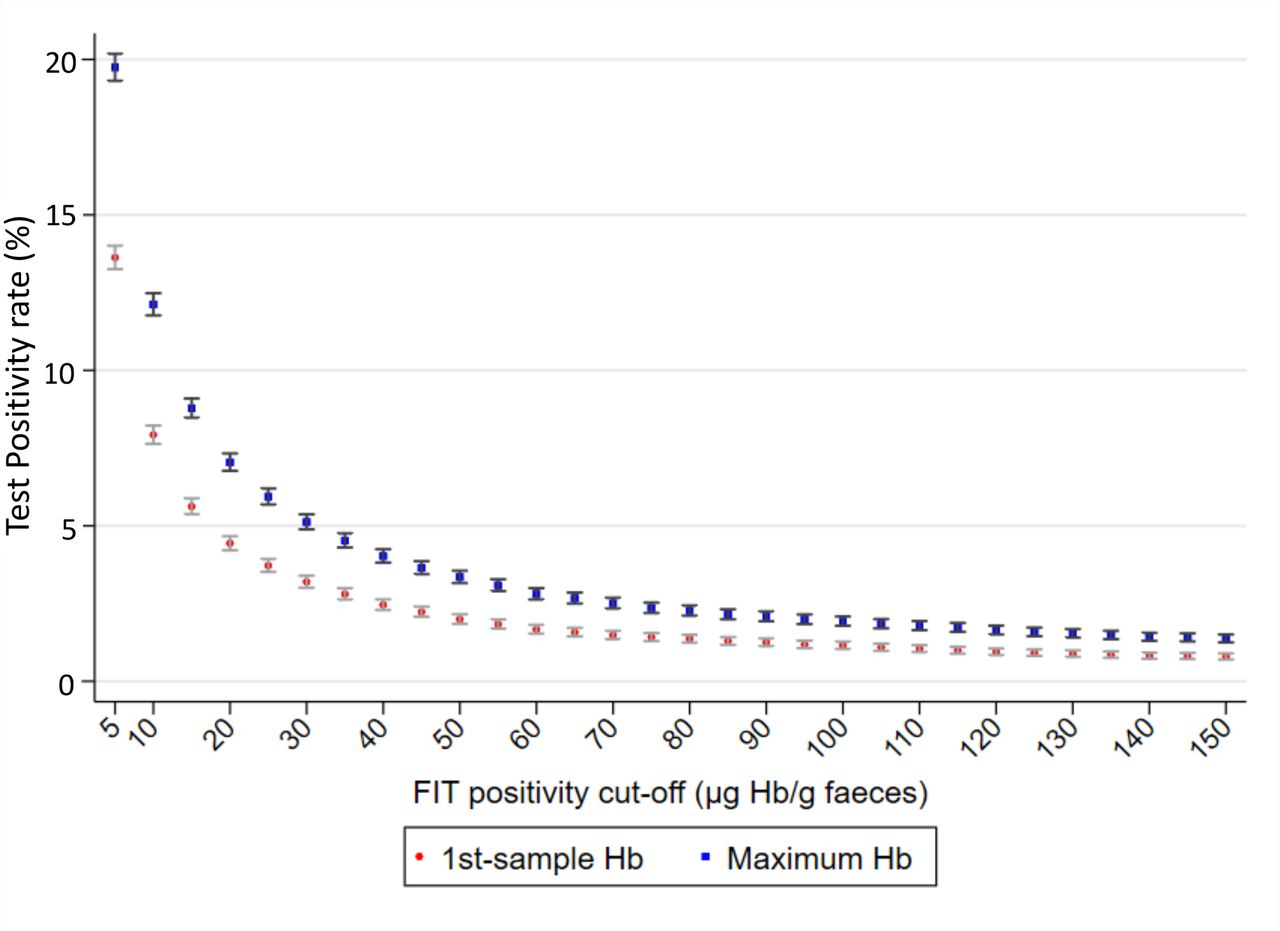
Figure 5 shows that population test positivity rates varied between 2% and 20% across a wide range of cut-offs for 1-sample and 2-sample contexts in all 32 413 instances where a 2-sample FIT was returned. At any given cut-off, test positivity was higher for 2-sample FIT.
Population test positivity rate across a wide range of cut-offs for 1-sample (first sample) and 2-sample (maximum of the two) tests in all 32 413 instances where a 2-sample FIT was returned. Bars show 95% CIs. FIT,faecal immunochemical test; Hb, haemoglobin.
Choosing test variables when sensitivity is the goal
The respective test cut-offs that would need to be applied to 1-sample and 2-sample tests to return an equivalent sensitivity for advanced neoplasia, were modelled together with the related population test positivity rate (table 2). For every given sensitivity, the f-Hb cut-off was higher for 2-sample FIT, due to the lack of concordance in positivity between samples and the extra opportunity to detect a lesion. It is also apparent that the population test positivity rate (colonoscopy workload) differed between sample contexts but the degree of difference was dependent on the desired sensitivity. At sensitivities ≥35%, the colonoscopy workload was higher with 1-sample compared with 2-sample FIT.
Estimated test positivity cut-offs that must be applied to 1-sample and 2-sample tests to return an equivalent sensitivity for advanced neoplasia, together with respective population positivity rates (colonoscopy workloads)
Choosing test variables when controlling colonoscopy workload is the goal
The respective cut-off values that would need to be applied to 1-sample and 2-sample tests to return equivalent colonoscopy workloads with 1-sample and 2-sample tests were modelled, together with respective sensitivities for advanced neoplasia (table 3). For every given workload, the test cut-off was higher for 2-sample FIT. Sensitivity rates did not differ when seeking workloads in the range of 2% to 5%, but when workloads of 6% and above were addressed, sensitivity was higher with 2-sample FIT.
Estimated positivity cut-offs for one and two sample contexts which give an equivalent population test positivity rate, together with respective sensitivities for advanced neoplasia
Discussion
When establishing a CRC screening programme, many decisions need to be made to ensure that this multistep process succeeds. Reduction of the incidence of CRC is dependent on and achieved by removal of adenomas.4–6 34 Effective detection of targeted neoplastic lesions along with feasibility of workloads are key considerations when deciding on the screening strategy. This study, in exploring agreement in f-Hb between samples and the relationship between sensitivity for advanced neoplasia and colonoscopy workload demonstrated that when setting programme goals for those using a quantitative FIT, both parameters of sample number as well as f-Hb cut-off for test positivity warrant consideration. Considering both adds additional flexibility to that provided by cut-off adjustment alone.
This study demonstrated that agreement in f-Hb between samples was poor, with wide variation seen between first and second samples. While such variation has been reported in the literature16 35 the degree of variation and its effect on test positivity when adjusting cut-off, especially for advanced adenomas, has remained unclear. Because f-Hb concentrations for advanced neoplasia, especially advanced adenomas, often fell within the range of f-Hb cut-offs chosen in practice, FIT sensitivity for these lesions was compromised by the collection of one sample compared with two samples. Consequently, concordance between samples for a positive result was dependent on cut-off for positivity.
Our findings are consistent with previous observations in the literature showing that f-Hb (a reflection of the actual amount of blood loss) is dependent on neoplastic phenotype, being highest for cancer followed by advanced adenoma states.2 7 11 24 26 Consequently and again in agreement with earlier reports,2 7 11 24 we observed that sensitivity for neoplasia was increased by lowering the cut-off and/or increasing sample number, but in doing so the associated colonoscopy workload increased. But we found that such an inverse relationship is not a simple one when simultaneously but independently adjusting both variables. Concordance for test positivity between two samples was low, especially for advanced adenomas and especially when the cut-off was raised. Therefore, the proportion of advanced adenomas detected, and of cancer to a lesser extent, is critically dependent on the choice of each variable since detection is compromised if only one stool is to be sampled.
In a screening population, the proportion of tests that are positive determines the colonoscopy workload; aiming for a higher sensitivity results in a higher overall test positivity rate. We found that the workload rises progressively as the number of samples increases (unless the cut-off is raised) or as the cut-off is lowered (unless the number of samples is reduced). The highest colonoscopy workload was seen at the lowest cut-off while simultaneously using a 2-sample test because testing two samples reduces the chance that an f-Hb above the cut-off will be missed. The colonoscopy workload varied from 2% to 10% (in the cut-off range of 7.4 to 94.2 µg Hb/g) depending on the sample number/cut-off combination; respective sensitivities for advanced neoplasia varied from approximately 15% to 57%. In matching 1-sample and 2-sample FIT thresholds to achieve the same sensitivity, colonoscopy workload was significantly less with 2-sample FIT when the sensitivity goal exceeded 35%.
When a screening programme requires feasible management of workloads, different test cut-offs have been applied around the world.13 14 36–38 A number of countries, including the Netherlands, UK and New Zealand,13 36–38 have been cautious in undertaking programmes and the accepted colonoscopy workload sits at the lower levels of the wide range shown in table 3. For example, the Dutch programme moved from an initial cut-off of 15 µg Hb/g in 1-sample to a higher cut-off of 47 µg Hb/g due to the unmanageable workload.14 Similarly, the screening programme in New Zealand increased from 15 µg Hb/g to 40 µg Hb/g.13 When constraining workloads to this degree, our findings show that there is no sensitivity benefit in moving to a 2-sample approach (even when raising the cut-off to achieve equivalent colonoscopy rate).
On the other hand, where it is desired to maintain detection of advanced adenomas and where a colonoscopy workload of >5% is feasible, our findings show that a 2-sample test requires fewer colonoscopies for an equivalent sensitivity. In matching both parameters for equivalent colonoscopy workloads, sensitivity was similar in the workload range of 2% to 5%, but where higher workloads were feasible, better sensitivity was achieved with 2-sample FIT. Consequently, deciding which test variables to use is not simply a matter of managing feasibility of colonoscopic workload by adjusting the cut-off if the same number or additional lesions can be detected with equivalent or less colonoscopic workload. Programmes that have a goal of good detection of advanced adenomas should consider the 2-sample approach. Three-dimensional modelling of the relationship between colonoscopic effort (number needed to colonoscope to detect one case with advanced neoplasia), advanced neoplasia detection rate and colonoscopy workload in conditions aiming for best detection of advanced neoplasia showed that the 2-sample approach requires the least effort.39 Our findings also align with those of a French modelling study where they found that the number needed to screen to detect a lesion was lower for the 2-sample test.9 They observed similar positivity rate of 1.6% for 1-sample FIT at cut-off 68 µg Hb/g and 2-sample FIT at 116 µg Hb/g. Our findings might differ from those of a recent Dutch screening study conducted over four rounds where they found that workloads were higher with a 2-sample test but they did not adjust the cut-off for the 2-sample test and lesion detection was not assessed in all cases regardless of FIT result.26
Relative cost-effectiveness of 1-sample versus 2-sample testing has been considered in several studies. The cost per case detected in a FIT-screening study where only positive cases proceeded to colonoscopy was shown to be lowest for a 2-sample test compared with 1-sample and 3-sample tests.40 In comparing cost-effectiveness of FIT screening by 1-sample and 2-sample methods by probabilistic modelling, both one and two samples were cost-effective and the per person cost varied by just over one dollar due to the provision of the extra collection tube in the 2-sample context.41 A microsimulation model was used to compare costs (life years gained) drawing data from FIT screening studies in the Netherlands.8 A 2-sample test provided additional life years gained but at additional cost. That study, and others, did not, however, consider costs and resultant colonoscopy workloads when the variables of cut-off and sample number were independently adjusted to achieve equivalent sensitivities. Modelling was also undertaken in populations when only those with a positive FIT were colonoscoped, meaning that the cost of missing adenomas was not available. In the current study, there were a large number of cases with neoplasia, especially advanced adenoma states, and sensitivity for neoplasia was estimated in cases who all underwent colonoscopy after completion of a 2-sample quantitative FIT, regardless of the test result. Our findings could now be incorporated into cost-effectiveness modelling studies. While we accepted cases where FIT was performed anytime in the 12 months preceding colonoscopy and so assumed that the lesions found at colonoscopy were present at the time of taking the test, it is accepted that the natural history of colorectal neoplasia is of the order of a decade.42
While the population was not an average-risk naïve screening population there is no obvious reason to think that the principles which have emerged would be irrelevant to a typical screening population. The number of cancers in this study population was only 21 out of the 3499 meeting inclusion criteria for full modelling. As some in the study had previously undergone polypectomy, we would expect there to be a small number with cancer. The proportion with advanced adenomas, despite some colonoscopies being brought forward because of a positive FIT, were comparable to that of the entire population, and within 3% of the rate seen by others in a similar programme.43 In addition, our FIT positivity rate for the 32 413 completed tests was similar to that reported in Scandinavian44 and Australian screening populations.45 The former reported positivity rates of 7.2% and 4.2% for a 2-sample and 1-sample FIT respectively at cut-off 20 ug/g, compared with our findings of 7.0% and 4.4%. Similarly high test positivity rates at a low cut-off were observed in a screening study in Israel.24
In the current study, we have not been able to consider differences in population participation based on the collection of just one rather than two samples. In a Dutch population-based randomised controlled trial comparing 1-sample and 2-sample FIT, the difference in participation rates was just 0.2%.46 They also found that when seeking a higher detection rate for neoplasia, the 2-sample method was more efficient. In a US study, there was a small (4%) difference in participation rates between a 1-sample and 2-sample FIT but the actual stool-sampling device was very different between the two brands of FIT.47 In other words, there is no conclusive evidence to support that participation in screening is improved when requiring just one sample.
In conclusion, variation in f-Hb between samples is such that both positivity cut-off and sample number are, together, crucial determinants of test sensitivity for advanced neoplasia (especially advanced adenomas) and for colonoscopy workload. If a programme goal includes reduction of cancer incidence, then detection of advanced adenomas is important. As test-positivity cut-offs applied in practice fall within the range of f-Hb observed in cases with advanced adenomas and cancers, their detection, especially of advanced adenomas, is compromised when sampling only one stool and especially when raising the cut-off as well. While the lower sensitivity of a 1-sample test can be addressed by choosing a lower cut-off than would be used for a 2-sample test, the relationship between these test parameters and outcomes is complex. If the sensitivity goal for advanced neoplasia is >35%, then colonoscopy workload is significantly less using two samples. Thus a 2-sample approach seems preferable where programme detection of advanced adenomas has a priority alongside that of cancer.
References
Footnotes
Contributors GPY – study concept and design, data analysis, figures and interpretation, manuscript writing; RW – data analysis and interpretation, figures, manuscript writing; ELS – study concept and design, acquisition of data, data analysis and interpretation, manuscript writing. No medical writer was involved.
Funding Faecal immunochemical tests for the study were provided by Eiken Chemical Company, Tokyo, Japan.
Competing interests None declared.
Patient consent for publication Not required.
Ethics approval Approval for the study was obtained from the Southern Adelaide Clinical Human Research Ethics Committee. Its deliberations are consistent with the Helsinki Declaration.
Provenance and peer review Not commissioned; externally peer reviewed.
Data availability statement Data are available upon reasonable request. Requests concerning data should be sent to the corresponding author.