Article Text

Abstract
Objective To estimate the number of deaths from foodborne disease in the UK from 11 key pathogens.
Design Four different models were developed using data from a range of sources. These included enhanced surveillance, outbreaks, death certificates and hospital episode statistics data. For each model, median estimates were produced with 95% credible intervals (CrI). The results from the different models were compared.
Results The estimates for foodborne deaths for each pathogen from the different models were consistent, with CrIs largely overlapping. Based on the preferred model for each pathogen, foodborne norovirus is estimated to cause 56 deaths per year (95% CrI 32 to 92), foodborne Salmonella 33 deaths (95% CrI 7 to 159), foodborne Listeria monocytogenes 26 deaths (95% CrI 24 to 28), foodborne Clostridium perfringens 25 deaths (95% CrI 1 to 163) and foodborne Campylobacter 21 deaths (95% CrI 8 to 47). The considerable overlap in the CrIs means it is not possible to make any firm conclusions on ranking. Most of these deaths occur in those aged over 75 years. Foodborne deaths from Shigella, Cryptosporidium, Giardia, adenovirus, astrovirus and rotavirus are all rare.
Conclusions We estimate that there are 180 deaths per year in the UK (95% CrI 113 to 359) caused by foodborne disease based on these 11 pathogens. While this is a small fraction of the estimated 2.4 million cases of foodborne illness per year it still illustrates the potential severity of these illnesses demonstrating the importance in continuing efforts to reduce these infections.
- infectious disease
- Campylobacter
- Salmonella
This is an open access article distributed in accordance with the Creative Commons Attribution Non Commercial (CC BY-NC 4.0) license, which permits others to distribute, remix, adapt, build upon this work non-commercially, and license their derivative works on different terms, provided the original work is properly cited, appropriate credit is given, any changes made indicated, and the use is non-commercial. See: http://creativecommons.org/licenses/by-nc/4.0/.
Statistics from Altmetric.com
Summary box
What is already known about this subject?
Foodborne disease is a common illness in the UK.
Previous research has estimated that there are 566 000 cases, 74 000 general practitioner presentations and 7600 hospital admissions related to foodborne disease from 13 known pathogens in UK; no estimate was made for deaths.
Campylobacter and norovirus are the most common foodborne pathogens in the UK.
Other common foodborne pathogens include Clostridium perfringens and Salmonella.
What are the new findings?
This study provides updated estimates of deaths for each of the 11 key foodborne pathogens considered; in total, these 11 pathogens cause 180 deaths per year in the UK (95% credible interval (CrI) 113 to 359).
Among them, Campylobacter, C. perfringens, Listeria monocytogenes, Salmonella and norovirus pathogens are responsible for over 98% of these deaths.
Ranking between these five is difficult due to overlapping CrIs.
How might it impact on clinical practice in the foreseeable future?
This highlights the potential severity of Salmonella, L. monocytogenes, C. perfringens, Campylobacter and norovirus, particularly in comparison with other infectious intestinal diseases that have a food source.
Introduction
Foodborne disease (FBD), also referred to as foodborne illness or food poisoning, is caused by consuming contaminated food or drink. It can be caused by a variety of different bacteria, parasites and viruses, examples being Salmonella, Cryptosporidium and norovirus. Typical symptoms include nausea, vomiting and diarrhoea. The Food Standards Agency estimates that there are 2.4 million cases of foodborne illness per year in the UK,1 Estimates produced by WHO indicate foodborne diarrhoeal diseases cause 550 million cases and 230 000 deaths worldwide a year.2
The IID2 extension,3 estimated the burden of FBD in the UK for 13 pathogens. This produced estimates of 566 000 cases, 74 000 general practitioner (GP) presentations and 7600 hospital admissions. No estimates were made for deaths. This new study complements the previous work by providing estimates of deaths for 11 of these pathogens. This gives a more complete picture of the overall burden of illness for each pathogen.
Deaths from FBD are not routinely recorded. Death certificates do not always record the specific gastrointestinal pathogen involved and when the causal pathogen is identified it is seldom clear whether the source of infection was from food or from a non-food source. Models are therefore required to estimate deaths.
Data availability varies between pathogens meaning no one method of estimation is suitable for all pathogens. In order to address this, four different models were used in this work to produce estimates of deaths for 11 pathogens. The results from the different models were then compared and a preferred method for each pathogen selected.
Methods
Data sources
Enhanced surveillance data and confirmed laboratory reports
For Escherichia coli O157 and Listeria monocytogenes, the four UK national surveillance centres (Public Health England, Public Health Wales, Health Protection Scotland and Public Health Agency Northern Ireland) undertake enhanced surveillance. This involves following up cases with questionnaires that provide more information on exposure to various risk factors and clinical details. Data on the numbers of cases, hospitalisations and deaths by pathogen were extracted from these datasets.
The four UK surveillance bodies also provided number of confirmed laboratory reports by pathogen for 2018.
Outbreak surveillance data
Public Health England provided outbreak data between 1 January 2001 and 31 December 2016.
For each outbreak, the following data were provided: pathogen, number of cases, number of cases hospitalised, number of cases who died and mode of transmission.
Office for National Statistics mortality data
Data from death certificates in England and Wales are collected by the Office for National Statistics (ONS). Each death is coded according to the Tenth Revision of International Classification of Diseases (ICD-10), which was developed by WHO (for more details, see http://www.who.int/classifications/icd/icdonlineversions/en/).
We obtained summary extracts on deaths relating to an agreed list of ICD-10 codes linked to specific pathogens covering the period 2001–2012. The data provided by ONS contained three sets of information:
The number of deaths by year where the pathogen was the underlying cause. These data are referred to as the Underlying cause extract.
The number of deaths by year where the underlying cause is indicative of infectious intestinal disease but not a specific pathogen (eg, ICD-10 code A04.8 ‘Bacterial intestinal infection, unspecified’) and the pathogen name is mentioned in the free text of the death certificate. These data are referred to as the Text extract.
The number of deaths by year where the ICD-10 code related to the pathogen is mentioned on the death certificate, but not as the underlying cause. These data are referred to as the Mentioned extract.
For each extract we also obtained place of death.
Duplicate records between the three extracts were identified and removed as necessary.
The idea of using these three different sets of data is based on previous work by the ONS on Clostridium difficile.4
Hospital episode statistics
Data on the method of discharge for hospitalisations in England for the period 2000–01 to 2017–18 was obtained from NHS Digital. This included the number of hospitalisations with a discharge method of ‘Died’ for each year for each pathogen. Pathogens were identified based on the primary diagnosis ICD-10 code. These were the same codes used in the mortality data extract.
ONS population estimates
This was obtained directly from the ONS website and used to scale up different datasets to produce a UK figure where data were only available for England or England and Wales.
Modelling approach
We applied four different modelling approaches to estimate for number of annual deaths for the following 11 pathogens: Campylobacter, Clostridium perfringens, E. coli O157, L. monocytogenes, Salmonella, Shigella, Cryptosporidium, Giardia, adenovirus, astrovirus, norovirus.
Astrovirus and sapovirus, which were also included in the IID2 extension, were excluded from this analysis as none of the datasets had data specifically on them. This was largely because they do not have unique ICD-10 codes but are covered by the more generic category ‘other viral enteritis’. The numbers are likely to be small as the generic category ‘other viral enteritis’ had been 0 and 3 deaths per year between 2010 and 2014 based on ONS registered deaths dataset.
Estimates for E. coli O157 were only possible using models 1 and 2 as the ICD-10 does not break E. coli down into specific strains. L. monocytogenes was the only pathogen for which all four estimates were possible.
For all four models, deaths from all sources, not just food, was first calculated and then the proportion due to food was estimated. As this second stage is the same for all models this is described separately.
Values for the parameters used in each model are provided in the online supplementary file.
Supplemental material
Model 1: enhanced surveillance
For E. coli O157 and L. monocytogenes, the enhanced surveillance data provided by the four UK surveillance bodies provided the number of deaths. Although there may be some level of under-reporting, as these illnesses are relatively severe this is believed to be small.
Model 2: modelling using outbreak data
This model applied the same basic approach for deaths as had been used in the IID2 extension for hospital admissions. This was based on outbreak data.
For each outbreak several pieces of information are collected. This includes the pathogen, number of people affected, how many were hospitalised and how many died. From these data it was possible to produce an estimate of the proportion of people who die for each pathogen based on the number of people affected and those who die. This assumes that people who do get ill in an outbreak are typical of all cases.
We bootstrapped the outbreak data to get a distribution of the proportion of cases where the person dies. Before doing so, we had noticed that outbreaks for certain pathogens were biased towards nursing homes. For instance, 54% of outbreaks for norovirus and 26% of outbreaks for C. perfringens occurred in nursing homes (table 1). This compares with 0.6% of the population living in nursing homes.5 Reasons for this may include that it is easier to identify an outbreak in a nursing home, and in the case of norovirus, advice to the general population is not to go to their GP for the fear of further spread. As it is probable that the likelihood of people dying from each illness is higher for residences of a nursing home compared with the general population, we weighted the outbreaks based on population so that one of the outbreaks associated with a nursing home was selected only 0.6% of the time. The other 99.4% of the time an outbreak not associated with a nursing home was selected. We then bootstrapped the outbreak dataset 4999 times for each pathogen. The resulting dataset was then fitted to a beta distribution. The number of bootstraps chosen followed the practice of the IID2 extension.
Number of outbreaks and associated cases and deaths for England and Wales 2001–2016
The next step was to produce estimates of total cases for each pathogen from all sources. The four UK surveillance bodies provided confirmed laboratory reports for 2018 for each pathogen. These figures are known to be an underestimate of total numbers of cases due to under-reporting. Under-reporting occurs as not everyone who is ill seeks medical help, those who do will not always have a sample taken for testing and even then, the causal pathogen may not be identified.
For Campylobacter, E. coli O157, L. monocytogenes, Salmonella, Shigella, Cryptosporidium, Giardia and rotavirus an adjustment for under-reporting was made by using ascertainment ratio for that pathogen (this is the ratio of all cases in the community to confirmed laboratory reports). These ratios were based on a population-based prospective study in the UK, known as the IID2 study.6 Uncertainty was modelled by using log-normal distributions based on the mean and 95% CI for each ascertainment ratio. For Shigella, the ascertainment ratio was based on an earlier cohort study, known as IID1 study.7 No ascertainment ratio was provided for L. monocytogenes in the IID2 study, we therefore assumed no under-reporting which was the same assumption as made in the IID2 extension.
A Monte Carlo simulation model was then developed with the following structure to estimate deaths for these eight pathogens:
 1
1
Where:
Dp is the number of deaths in the UK for pathogen P.
Lp is the number of confirmed laboratory reports for pathogen P for the year of analysis. In this report, data for 2018 were used.
ARp is the ascertainment ratio for pathogen P.
DPp is the proportion of cases that result in death for pathogen P. This was the beta distribution obtained from bootstrapping the outbreak data.
For C. perfringens, adenovirus and norovirus the ascertainment rates were very high compared with the confirmed laboratory reports, which meant using these to produce overall estimates of cases was unreliable with a lot of variation from year to year. Instead, the rate of cases in the community per 1000 person years, also part of the IID2 study, were used and multiplied by the UK 2018 population estimates produced by ONS. Uncertainty was modelled by using log-normal distributions based on the mean and 95% CI for the rate.
For these three pathogens an alternative Monte Carlo simulation model was developed as follows:
 2
2
Where:
Dp and DPp are as in equation 1.
CRp is rates of cases in the community for pathogen P.
POP is the UK population for 2018.
For each run of the Monte Carlo simulation models, a value for each parameter was drawn at random based on the distributions described above. Both models were run 100 000 times for each pathogen.
Model 3: death certificate data plus expert assessments
Using the Mentioned extract (see ‘Data sources’ section), three external epidemiological experts were independently asked to assess whether the pathogen mentioned was likely to have contributed to the death given the underlying cause (the options were high, medium or low). For example, a combination that was rated as high by all three experts was an instance where the underlying cause was Guillain-Barré syndrome and Campylobacter enteritis was mentioned on the death certificate.
The three expert assessments were then combined using a Monte Carlo simulation to create a distribution of annual deaths per year for each pathogen (for deaths included in the Mentioned extract only). First it was necessary to assign probabilities to the different ratings of high, medium and low. The probabilities set on were an 80% chance that a death assessed as high would not have occurred without the contribution of the pathogen (100% was felt to be too high as this would have suggested absolute certainty), a 50% chance for a death rated as medium and 0% for a death rated as low. A Monte Carlo simulation was then run selecting one of the experts’ assessments at random during each run for each death. Based on the probability associated with the assessment, the model used a random number to determine if the death was due to the pathogen. The number of deaths were then summed to produce the average number of deaths per year for each pathogen. The simulation was run 100 000 times.
A distribution of deaths from data held in the other two extracts (ie, the Underlying cause extract and Text extract—see ‘Data sources’ section) was also created by bootstrapping the average numbers of deaths over 12 years (12 years being taken at random with replacement). The data were bootstrapped 100 000 times.
The proportion of deaths from each data source is given in table 2.
Breakdown of the proportion of deaths estimate in model 3 from each of the identification methods
A Monte Carlo simulation model was then developed with the following structure:
 3
3
Where:
Dp is the number of deaths in the UK for pathogen P.
DMp is the number of deaths estimated based on data in the Mentioned extract for pathogen P.
DPTp is the number of deaths based on data in the Underlying cause extract and Text extract for pathogen P.
POPADJEW is an adjustment to scale up from England and Wales to the UK based on average population figures for 2001–2012. This assumes Northern Ireland and Scotland have similar distributions of deaths and illnesses to England and Wales. A further adjustment was made to scale up to 2018 based on population to make the estimates comparable to the other models.
Values for DMp and DPTp were taken at random for each run of the model from the earlier simulated and bootstrapped data. The model was run 100 000 times for each pathogen. Using death certificate data in this way is caveated by the knowledge that clinical coding by ICD-10 is not always perfectly completed.
Model 4: hospital episode statistics—proportion of discharges due to death
Hospital episode data were obtained from NHS Digital. This included data on the number of hospitalisations who had a discharge method of ‘Died’ and the overall number of discharges in England. This was for each pathogen for each year between 2000–01 and 2017–18. From these data, the proportion of discharges where the person died for each pathogen was calculated for each year. The data were then bootstrapped to produce a distribution of the proportion of hospital admissions where the person dies. For each bootstrap, 18 years were selected at random, with replacement, and the average of the proportion of discharges where the person died over the 18 years was produced. The data were bootstrapped 4999 times and a beta distribution was then produced from the results. These proportions are subsequently referred to as the HES death rate. This was calculated for hospitalisations where the pathogen was the primary diagnosis.
An assumption has been made that the proportion of discharges that results in death is equivalent in England and rest of the UK.
Estimates of total cases for each pathogen were produced following the same approach as model 2, which varied by pathogen (see Model 2: modelling using outbreak data). Using these estimates, two Monte Carlo simulation models were developed. The first for Campylobacter, L. monocytogenes, Salmonella, Shigella, Cryptosporidium, Giardia and rotavirus had the following structure:
 4
4
Where:
Dp is the number of deaths in the UK for pathogen P.
Lp is the number of confirmed laboratory reports for pathogen P for the year of analysis, as used in model 2. In this report, data for 2018 were used.
ARp is the ascertainment ratio for pathogen P. See model 2 which also used this parameter for further details.
HPp is the proportion of illnesses that result in hospital admissions for pathogen P. This was drawn from the beta distributions of the proportion of cases that result in hospital admission that had been previously calculated in the IID2 extension. These beta distributions had been updated to include outbreak data from 2001 to 2016.
HESp is the hospital episode statistics (HES) death rate for pathogen P. For each run of the model, an average value was drawn at random from the beta distribution described above.
NHUp is a factor that uplifts the number of deaths to account for those that do not occur in hospital. This was drawn on a beta distribution created from bootstrapping the place of death information on the death certificate data. The data were bootstrapped 4999 times for each pathogen.
The second Monte Carlo simulation model used for C. perfringens, adenovirus and norovirus was as follows:
 5
5
Where:
Dp, HPp, HESp and NHUp were as in equation 4.
CRp is rate of cases in the community for pathogen P (see model 2).
POP is the UK population for 2018.
Both models were run 100 000 times for each pathogen. This model assumes that people who are admitted to hospital and who subsequently die are no more likely to be tested for the causal pathogen than those admitted to hospital who do not die.
Estimating the proportion of deaths attributed to food
It was assumed that the proportion of deaths attributable to food was the same as the percentage of cases attributed to food for each pathogen, that is, the likelihood of a cases resulting in death for each pathogen was independent of the transmission route.
Distributions of the proportion of cases due to foodborne transmission had previously been calculated in the IID2 extension and full details of the approach can be found in that paper. In summary, these were based on bootstrapping samples from outbreak data using the proportion of cases from outbreaks that were attributed to food. This is with the exception of norovirus where the proportion due to food was based on the Foodborne Disease Estimates for the United Kingdom in 2018. These proportions were then multiplied by total deaths for each pathogen in each model to estimate the number of deaths attributed to food. These distributions were then applied to the total number of deaths reported to produce median estimates and 95% credible intervals (CrIs) of deaths due to foodborne transmissions for each model. A 95% CrI means that there is a 95% probability that the value is within the interval. These intervals were produced by taking the 2.5% and 97.5% percentiles from the results from the Monte Carlo simulations.
RESULTS
Estimates for deaths from all sources for each pathogen are given in table 3 while estimates for foodborne deaths are given in table 4.
Estimates of the number of deaths due to infectious intestinal disease in the UK per annum for selected pathogens
Estimates of the number of deaths due to foodborne disease in the UK per annum
For E. coli O157 it was only possible to use estimation models 1 and 2, and the median estimate results are 1 and 39 deaths from foodborne sources a year, respectively. The estimate of 1 based on the enhanced surveillance data is thought to be the most likely. Model 2 uses a median ascertainment ratio of 7.4 (95% CrI of 0.5 to 104.4) which would seem high for such a severe pathogen.
L. monocytogenes was the only pathogen where estimates could be made using all four models. The results are reasonably consistent with median estimates of foodborne deaths between 20 and 30 with all CrIs overlapping.
For Campylobacter and Salmonella, the CrIs for models 3 and 4 overlap with median estimates ranging from 7 to 21 and 22 to 33, respectively. Estimates from model 2 for these two pathogens are higher, although their CrIs do overlap with model 4.
For norovirus there is much less agreement between models, with no overlap in the CrIs.
Deaths from Shigella, Cryptosporidium, Giardia, adenovirus and rotavirus attributed to food are all rare, with most of the median estimates being 0. As with all the estimates, these have been rounded to the nearest whole number (you cannot have part of a death) but the precise numbers would be slightly above 0 indicating that a death could be expected once every few years. Adenovirus was also left out of our estimate for model 3 as we did not have the Text extract for the pathogen.
Figure 1 shows the proportion of deaths by age band. Most deaths occur in those aged over 75 years for the main pathogens (numbers for other pathogens were too small for such splits). For norovirus, 89% of people who died were aged over 74 years. For Campylobacter, L. monocytogenes and Salmonella, the proportions were lower at 68%, 54% and 55%, respectively. This is based on data where the pathogen was stated as the underlying cause on the death certificate. This may be suggestive of underlying conditions or more general frailty, which means the individual is more severely affected by the illness.

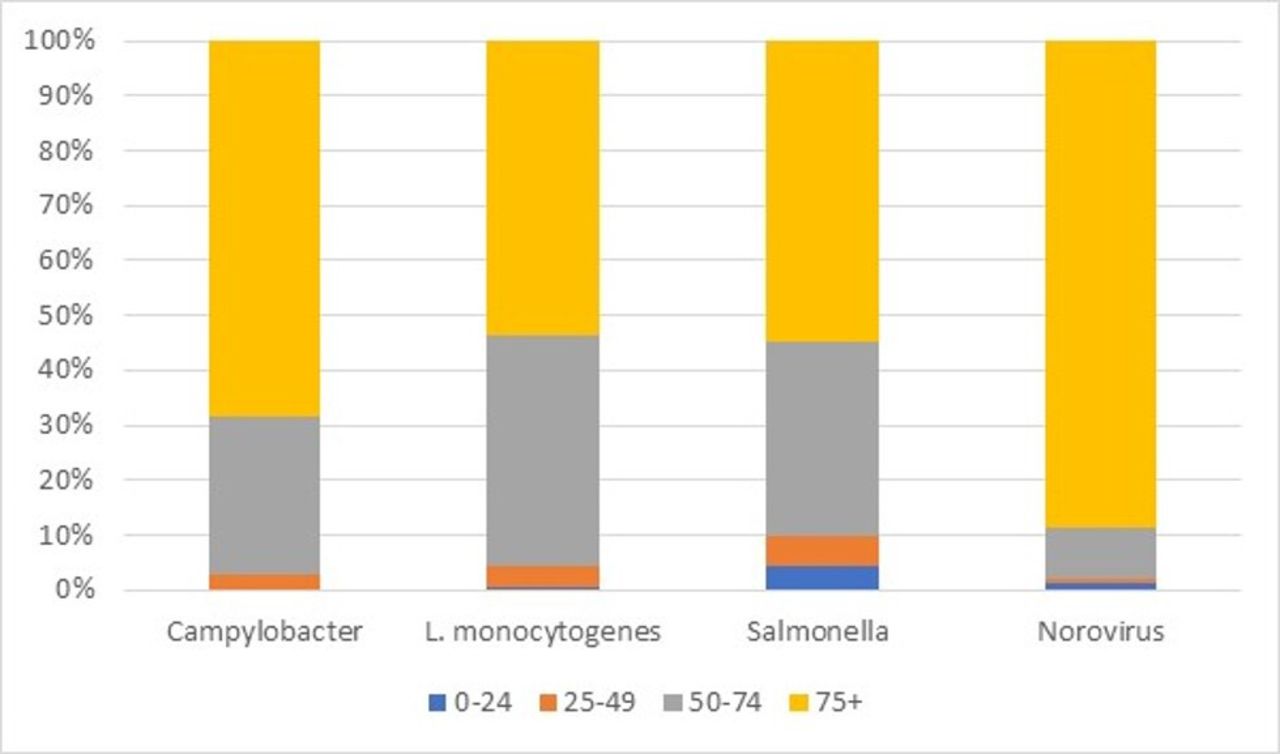
Proportion of deaths by age band. Source: Office for National Statistics.
The number of years of potential life lost (YPLL) based on these distributions was estimated at an average of 11.5 YPLL per death for Campylobacter, 14.4 for L. monocytogenes, 16.8 for Salmonella and 9.0 for norovirus.
DISCUSSION
The enhanced surveillance estimates are based on details obtained from individual cases and as such are likely to be by far the most accurate. These data are only available for E. coli O157 and L. monocytogenes. Although there may be some under-reporting, due to the serious nature of these illnesses this is believed to be small. Despite the relatively low estimate for E. coli O157, it is a potentially harmful illness with around 3.6% (based on the enhanced surveillance data for England between 2009 and 2018) of cases developing haemolytic uraemic syndrome, a condition which can cause acute renal failure.8
Testing for C. perfringens is normally only performed during outbreaks (IID2 study) and so is largely undiagnosed, with the IID2 study giving an ascertainment ratio of 2519 (95% CrI 891 to 7179), that is, for every one confirmed case there are an additional 2519 in the community. This means models 3 and 4 are based on very little data for this pathogen, which for model 3 results in small estimates and for model 4 very large CrIs. For C. perfringens, unlike the other pathogens, there is more data available from outbreaks than there is from hospital discharges: 96 outbreaks with 3098 cases in England and Wales between 2001 and 2016, compared with 39 hospital discharges in England over the same period (see table 1 and table 5). In contrast, Campylobacter was associated with 147 outbreaks with 2950 cases but 36 895 hospital discharges. Therefore, the best model for C. perfringens is more likely to be model 2.
Hospital episode discharges—England 2000–01 to 2017–18
For the other eight pathogens, model 4 may be the most appropriate as it builds more directly on the ascertainment ratios from the IID2 study and the estimates of hospitalisations in the IID2 extension. Model 3 is based largely on direct diagnosis (whether primary or secondary diagnosis) and so may not adequately consider under-reporting. While model 2 does take account of under-reporting, it tends to produce larger CrIs than the other models being based on less data. Even so, other than for norovirus, the median estimates of the other models often fall within the CrIs of model 2 and as such the results from this model are not inconsistent with the other models.
A major assumption for model 4 is that the pathogen for which the individual was admitted to hospital for was either the cause of death or an important contributory factor. Without individual patient data (which we did not have access to), this is hard to verify. Comparing the ONS death certificate data and the HES data gives us some reassurance for this assumption. Table 6, column B gives the number of deaths where the pathogen is the underlying cause on the death certificate and the place of death was an NHS hospital for England and Wales between 2001 and 2012. Column C gives the number of patients who died where the primary cause of admission was the pathogen (financial years 2000–01 to 2002–13, scaled up from England to England and Wales based on population).
Comparison of underlying cause of death and primary cause of admission to hospital where person died: England and Wales 2001 and 2012
In all cases, other than adenovirus, numbers from the hospital data are slightly higher. However, if we consider the breakdown of deaths from model 3 (table 2), the proportion of those which were recorded as the underlying cause compared with the total is similar to the ratios detailed above. As all the deaths in model 3 have a direct reference to the pathogen concerned this could mean that the primary cause of admission may well have been a major contributor recorded on the death certificate, if not the underlying cause. The pathogen where there is the biggest difference between the ONS and HES numbers in absolute terms is Campylobacter. It is also the pathogen which is most often mentioned on a death certificate when the underlying cause is a generic code indicative of infectious intestinal disease (table 7), which could explain this discrepancy. The reason for this is not known, but it could indicate less general familiarity with the ICD-10 code for Campylobacter than other pathogens.
Underlying cause of death when pathogen is mentioned on the death certificate as text: 2001–2012
A further question is, if the cause of death on the death certificate is not always recorded as the specific pathogen, what is the cause of death given? This is difficult to know, but there are various non-specific ICD-10 codes that could be used. Of the more likely codes, 343 deaths were recorded on average each year against the following three codes combined: A084 Viral intestinal infection, unspecified, A090 Other and unspecified gastroenteritis and colitis of infectious origin and A099 Gastroenteritis and colitis of unspecified origin. This figure was for England between 2001 and 2017 as recorded in ONS mortality dataset. This could explain a large part of the difference between the numbers of deaths recorded against each pathogen on the death certificates and the estimates in the models.
Converting the UK estimates to rate per 100 000 person years gives estimates of deaths for Campylobacter of 0.03 (95% CrI 0.01 to 0.07), C. perfringens 0.04 (95% CrI 0 to 0.25), L. monocytogenes 0.04 (95% CrI 0.04 to 0.04), Salmonella 0.05 (95% CrI 0.01 to 0.24) and norovirus 0.08 (95% CrI 0.05 to 0.14). By comparisons, the rates from WHO for region Europe A (this was the region that included the UK) were for Campylobacter 0.06 (95% CrI 0.03 to 0.1), L. monocytogenes 0.08 (95% CrI 0.06 to 0.1), Salmonella 0.2 (95% CrI 0.1 to 0.3) and norovirus 0.05 (95% CrI 0 to 0.1). Other for L. monocytogenes the CIs overlap. No estimates were produced for C. perfringens in the WHO study. Previous rates for the England and Wales UK in 19959 did not provide CrIs. Based on a population of 51.2 million these estimates per 100 000 person years are equivalent to of 0.13 for Campylobacter, 0.24 for C. perfringens, 0.12 for L. monocytogenes, 0.52 for Salmonella and 0.02 for norovirus. Estimated rates for the Campylobacter, L. monocytogenes and Salmonella have all decreased. Old estimates for C. perfringens and norovirus are within the new 95% CrIs, while norovirus has increased.
A strength of this work is that the main driver of estimates of deaths for the different models comes from different data sources namely enhanced surveillance, outbreaks, death certificates, hospital episode data. While there will be overlap between these sources with some deaths appearing in more than one dataset, the way the data are used in each model is quite different which makes these estimates largely independent of each other, giving credence to the broadly similar results. Conversely, a weakness is that the distribution of proportion of deaths due to food for each pathogen is the same in each model and hence any inaccuracies in this estimate will impact on all four models.
CONCLUSIONS
When using model 1 for E. coli O157 and L. monocytogenes, model 2 for C. perfringens and model 4 for the other eight pathogens, the five pathogens with the highest number of estimated deaths due to food in order are: norovirus 56 deaths per year (95% CrI 32 to 92), Salmonella 33 deaths (95% CrI 7 to 159), L. monocytogenes 26 deaths (95% CrI 24 to 28), C. perfringens 25 deaths (95% CrI 1 to 163) and Campylobacter 21 deaths (95% CrI 8 to 47). The considerable overlap in the CrIs means it is not possible to make any firm conclusions on ranking.
Using the preferred model for each pathogen, a total estimate of the number of deaths from all 11 pathogens was calculated for each iteration of the Monte Carlo simulation. A distribution was produced from these results. This gives an estimate of 180 deaths based on the median of this distribution with 95% CrI of 113 to 359. Most deaths occur in those aged over 75 years.
Acknowledgments
The authors would like to thank Professor Sarah O’Brien and the other authors of the IID2 extension who shared the work from their study, the information scientists at Public Health England, Public Health Wales, Health Protection Scotland and Public Health Agency Northern Ireland, who provided numbers of confirmed laboratory reports, outbreaks and enhanced surveillance data, NHS Digital for the hospital episode data and the Office for National Statistics for the mortality data.
Footnotes
Contributors DH planned the research and analysis. He obtained the ONS death data and hospital episode data. He produced some of the tables and made amendments to model. He wrote the majority of the paper pulling other contributors sections together. Responsible for overall content. LT undertook the initial bootstrapping and created the distributions for each model and wrote the methodology sections. She produced the years of potential life lost analysis. She reviewed and edited paper. NM updated the bootstrapping and distributions based on more recent data. She obtained laboratory report data. She created some of the tables in the report, produced additional analysis requested by the peer reviewers. She reviewed and edited paper. She quality assured models. AK produced an overarching model that could run estimates for deaths alongside foodborne cases, general practitioner presentations and hospital admissions. He obtained outbreaks data and contributed to the ‘Data sources’ section. He reviewed and edited paper.
Funding All authors were employed by the Food Standards Agency at the time of the work. The Food Standards Agency paid for summaries of mortality data from the Office for National Statistics and hospital episodes data held by NHS Digital.
Competing interests None declared.
Patient consent for publication Not required.
Provenance and peer review Not commissioned; externally peer reviewed.
Data availability statement No data, other than that provided in the main manuscript and supplementray file, are available. None of the data is publicly available and was obtained for this project under data agreements as follows: enhanced surveillance data was obtained from Public Health England, Public Health Wales, Health Protection Scotland and Public Health Agency for Northern Ireland; outbreak surveillance data were provided by Public Health England; Office for National Statistics provided mortality data; hospital episode statistics (HES) were obtained from the Health and Social Care Information Centre. Mortality data recorded against the underlying cause of deaths is given at https://www.ons.gov.uk/peoplepopulationandcommunity/birthsdeathsandmarriages/deaths/datasets/the21stcenturymortalityfilesdeathsdataset/current