Article Text

Abstract
Background Metabolic syndrome (MetS) and obesity are associated with non-alcoholic fatty liver disease (NAFLD). The aim of this observational study was to examine the relationship of MetS and a diagnosis of non-alcoholic steatohepatitis (NASH) in patients without diabetes in the NASH Clinical Research Network (CRN).
Methods Clinical, demographic, histological, laboratory and anthropometric data were collected on 356 adult patients without diabetes with NAFLD. Obesity was defined as body mass index ≥30.0. MetS was determined using the National Cholesterol Education Program-Adult Treatment Panel III (NCEP ATPIII) 2001 criteria to include 3 or more of the following: increased waist circumference, elevated triglycerides, reduced high-density lipoprotein cholesterol, hypertension and elevated fasting blood glucose.
Results Most patients were obese (71%) and had MetS (67%). Obesity was more prevalent among patients with MetS (80% vs 52%; p≤0.001). Markers of insulin resistance such as homoeostasis model assessment of insulin resistance (6.5 vs 4.9, p≤0.001) were higher among those with MetS compared with those without MetS. Histologically, patients without MetS had higher hepatocellular (p=0.04) and reticuloendothelial system iron (p=0.04). Patients with MetS were more likely to have severe hepatic steatosis (p=0.04) and chronic portal inflammation (p=0.01). On multiple logistic regression analysis, patients with definite NASH were almost 2.5 times more likely to have MetS than those without definite NASH (OR=2.41, p=0.01).
Conclusions MetS is common in patients without diabetes with NAFLD and is associated with greater insulin resistance, hepatic steatosis and portal inflammation. While patients without MetS have greater iron overload, patients with MetS may have an increased propensity to have NASH. Therefore, presence of MetS in patients without diabetes with NAFLD may serve as a potential criterion for liver biopsy.
Trial registration number NCT00063622; Pre-results.
- OBESITY
- NONALCOHOLIC STEATOHEPATITIS
- FATTY LIVER
- IRON OVERLOAD
This is an Open Access article distributed in accordance with the Creative Commons Attribution Non Commercial (CC BY-NC 4.0) license, which permits others to distribute, remix, adapt, build upon this work non-commercially, and license their derivative works on different terms, provided the original work is properly cited and the use is non-commercial. See: http://creativecommons.org/licenses/by-nc/4.0/
Statistics from Altmetric.com
Summary box
What is already known about this subject?
▸ The pathogenesis of nonalcoholic steatohepatitis (NASH) is based on the central role of Insulin resistance (IR) and therefore diabetic patients present an increase risk for this association.
▸ Furthermore, it is unclear why non-diabetic patients with and without metabolic syndrome (MetS) develop NASH.
▸ Therefore, we focused on a patient group without diabetes to eliminate this potential confounder and focused on the role of MetS.
What are the new findings?
▸ We were able to show that NAFLD patients with metabolic syndrome (MetS) had a greater association with NASH as compared to those without MetS in a population where 24% of patients were non-caucasians.
▸ Moreover, we were able to show important histological differences such as greater iron deposition in Non-MetS group and higher chronic portal inflammation in MetS group.
How might it impact on clinical practice in the foreseeable future?
▸ In the last 5 years, liver biopsy has been increasingly replaced by non-invasive testing.
▸ Non-diabetic patients with NAFLD are frequently not worked up further with a liver biopsy to exclude NASH.
▸ Our study suggests that non-diabetic NAFLD patients need to be further evaluated for MetS risk factors and liver biopsy could be performed if they are considered at high risk for NASH based on the number of MetS risk factors. The role of iron in NAFLD needs to be further researched.
Introduction
Non-alcoholic fatty liver disease (NAFLD) is the most common liver disorder in western countries and has an estimated prevalence of ∼20–30% in the USA.1 ,2 NAFLD is also the most common cause of persistently elevated liver enzymes.3 It incorporates a spectrum from non-alcoholic fatty liver without liver injury or fibrosis to non-alcoholic steatohepatitis (NASH), with possible progression to cirrhosis and its complications.
The association of NAFLD, metabolic syndrome (MetS) and insulin resistance (IR) has been previously reported.4 Obesity5 and type 2 diabetes6 are also commonly associated with NAFLD. IR is associated with NASH, cardiovascular disease,7 type 2 diabetes and certain malignancies.8 However, there are limited data examining the assessment of the relationship between obesity, features of MetS and IR among well-characterised patients with NAFLD such as in our study which excluded patients with diabetes.
The specific aims of our study were to determine the prevalence of obesity and MetS in well-characterised patients without diabetes with NAFLD enrolled in the National Institute of Diabetes and Digestive and Kidney Diseases (NIDDK)-funded NASH Clinical Research Network (CRN) and to investigate the demographic, anthropometric, laboratory and histological differences between patients with and without MetS.
Patients and methods
The study included patients who were enrolled in the NIDDK-funded NASH CRN studies. Data were collected from patients in the observational NAFLD Database (DB) study9 and the PIVENS (Pioglitazone vs Vitamin E vs Placebo for the Treatment of Nondiabetic Patients with Nonalcoholic Steatohepatitis) trial (ClinicalTrials.gov number, NCT00063622), the details for which are described elsewhere.10 Briefly, the NAFLD DB study included patients enrolled from 2004 to 2008 with known or suspected NAFLD (based on radiological or histological diagnosis of NAFLD or cryptogenic cirrhosis based on histological or clinical diagnosis). Only adult patients without diabetes with biopsy-proven possible or definite steatohepatitis and a NAFLD Activity Score (NAS) of 5 or more without cirrhosis from a biopsy within 6 months before randomisation were eligible for randomisation into the PIVENS trial. In addition, patients with other concomitant liver diseases, hepatocellular carcinoma (HCC) or excessive alcohol consumption were excluded from DB and PIVENS as have been previously reported.9 ,10 Informed consent was obtained from all patients and all details of the study and trial were approved by local Institutional Review Boards. NIDDK also appointed an independent data safety and monitoring board to monitor the design, protocol, details and conduct of the study and trial. This study analysed the enrolment data from 356 patients from either DB or PIVENS who met the following criteria and had available clinical data. All patients with overt diabetes mellitus, as determined by self-reported doctor-diagnosed type 1 or 2 diabetes, were excluded. Only adults (>18 years old) with liver biopsy within 6 months of enrolment in the above studies were included. Each liver biopsy underwent a central read by the NASH CRN Pathology Committee.
Epidemiological and laboratory analyses
The following characteristics were analysed: demographic features included age, sex, race/ethnicity (white not Hispanic, Hispanic and other not Hispanic); anthropometric factors were waist and hip circumference (cm), body mass index (BMI, kg/m2), waist to hip ratio (low, moderate or high cardiovascular health risk, as defined below); clinical and laboratory characteristics such as blood pressure (mm Hg), fasting glucose (mg/dL), lipid profile (mg/dL), liver function tests (U/L) and iron studies. The liver function tests measured included in this study were aspartate aminotransferase (AST), alanine aminotransferase (ALT), alkaline phosphatase (ALP), γ-glutamyl transferase (GGT) and albumin (g/dL). The markers of IR included fasting insulin (μU/mL), impaired fasting glucose (≥110 mg/dL), glycated haemoglobin (HbA1c; %) and C peptide (mg/dL). Homoeostasis model assessment of insulin resistance (HOMA-IR) and quantitative insulin sensitivity check index (QUICKI) were calculated using fasting insulin and fasting glucose. Iron studies such as serum iron (μg/dL), serum ferritin (ng/mL) and transferrin–iron saturation (%) were also analysed. Other variables included were smoking history (past or current), comorbidities (hyperlipidaemia, hypertension) and family history of diabetes or liver disease.
Histological analysis
Using the previously published NASH CRN Histologic Scoring system, the scoring of the biopsy samples was performed by nine pathologists who were part of the NASH CRN Pathology Committee.10 ,11 The information recorded from liver biopsies included grade (0–3) and location (zone) of steatosis, grade of lobular (0–3) and portal (0–2) inflammation, ballooning score (0–2), presence of Mallory-Denk bodies, NAS (0–8), presence of cirrhosis and fibrosis stage (0–4). The diagnosis of NASH was classified as ‘definite’ or ‘indefinite’ NASH. ‘Indefinite’ NASH was further subdivided into ‘NAFLD, not NASH’ or ‘borderline NASH’. The stages of fibrosis included stage 0: no fibrosis; stage 1a: mild, zone 3, perisinusoidal; stage 1b: moderate, zone 3, perisinusoidal; stage 1c: portal/periportal fibrosis; stage 2: zone 3 along with portal/periportal fibrosis; stage 3: bridging fibrosis and stage 4: cirrhosis. NAS is defined as the sum of the steatosis, lobular inflammation and ballooning scores. Furthermore, data involving the staining of HC and reticuloendothelial system (RES) iron with Perl's iron stain was also documented and comparison was made between patients with MetS and those without MetS.
Definitions
The definition of MetS was based on National Cholesterol Education Program-Adult Treatment Panel III (NCEP ATPIII 2001) criteria with three or more of the following characteristics: increased waist circumference (>40 inches for men or >35 inches for women), triglycerides >150 mg/dL or current treatment for hypertriglyceridaemia, low high-density lipoprotein (HDL) cholesterol (men <40 mg/dL, women <50 mg/dL), hypertension (systolic blood pressure ≥130 mm Hg or diastolic blood pressure ≥85 mm Hg or current treatment for hypertension) and elevated fasting glucose ≥110 mg/dL or current treatment for hyperglycaemia.12 BMI was categorised as normal (≤24.9 kg/m2), overweight (25.0–29.9 kg/m2) and obese (≥30 kg/m2). Waist-to-hip ratio was further classified into low cardiovascular and type 2 health risk (≤0.95 for men, ≤0.8 for women), moderate risk (0.96–0.99 for men, 0.81–0.84 for women) and high risk (≥1.0 for men, ≥0.85 for women).13 Prediabetes was defined as HbA1c between 5.7% and 6.4% and/or fasting glucose between 100 and 125 mg/dL.
Statistical analysis
We compared demographic, anthropometric, laboratory and histological data between two groups: MetS and no MetS (or non-MetS). Univariate analysis was performed to evaluate differences in individual MetS characteristics, IR markers and histological features of NASH between these two groups. Categorical variables were tested using Mantel-Haenszel χ2 or Fisher's exact test for non-ordered categories and Cochran-Armitage for ordered categories; continuous variables were analysed using a Wilcoxon two-sample test (Kruskal-Wallis test) due to non-normality of the distributions. Simple and multiple logistic regression models of the presence of MetS in relation to each histological feature were used to assess the association of MetS with each histological feature; adjusted models include indicators for sex (male vs female), race/ethnicity (non-Hispanic other, Hispanic vs non-Hispanic white), age (40–59, 60+ vs 18–30 years) and obesity. A final model of independent discriminators of the presence of MetS was determined from multiple logistic regression of MetS in relation to a the candidate set of 19 indicators, specifically, demographic characteristics (sex, age (18–39, 40–59, 60 years or older), race/ethnicity), anthropometric (obesity (BMI≥30 kg/m2)), clinical (prediabetes, ever smoked), laboratory markers (HOMA-IR, ALT, AST, GGT, serum iron), histological features (steatosis grade, lobular inflammation, portal inflammation, ballooning, advanced fibrosis, steatohepatitis diagnosis, HC iron grade, RES iron grade). A forward selection method was used to determine the model with the lowest Akaike Information Criteria.14 ,15 Adequate model fit was determined using the Hosmer-Lemeshow goodness of fit test.16 All p values used were two sided and considered statistically significant if p≤0.05. All analyses were performed using STATA (V.13.1, StataCorp, College Station, Texas, USA) and SAS statistical software (V.9.3, SAS Institute, Cary, North Carolina, USA).
Results
Of the 356 patients included in our study, 240 (67%) had MetS while the rest (116 patients, 33%) did not fulfil the NCEP ATPIII criteria for MetS. These groups were termed as ‘MetS’ and ‘no MetS’ groups, respectively. We also evaluated the frequency of the various components of MetS. The prevalence of elevated waist circumference was 93% in the MetS group compared with 63% in the no MetS group (p<0.001). On an average 3.6±0.7 MetS criteria were fulfilled in the MetS group compared with 1.7±0.6 in the no MetS group. Not surprisingly, the prevalence of each of these components, as well as the mean values of systolic and diastolic blood pressure, triglycerides, fasting glucose and waist circumference were significantly higher in the MetS group compared with the no MetS group; the mean HDL level was lower in the MetS than no MetS group.
Demographics and epidemiology
We compared the demographic factors, anthropometric parameters, laboratory values and histological characteristics between these two groups. There were no significant differences in the prevalence of MetS between the patients in either the PIVENS or DB studies, or any differences in sex or age between the MetS and no MetS groups. There was a higher proportion of Hispanic patients and a lower proportion of non-Hispanic whites in the no MetS group (21.6% and 69.8%, respectively) as compared with the MetS group (12.1% and 79.1%, respectively; p=0.03). There was no difference in a family history of diabetes or liver disease in the MetS versus no MetS group. Similarly, there was no significant difference in the current or ever smoking status in these groups (table 1).
Demographic, anthropometric and health history differences between the NAFLD participants with and without metabolic syndrome
Anthropometric measurements
As expected, the percentage of obese patients was significantly higher in the MetS group (80.3% vs 51.7%, p<0.001) although there was no significant difference in the mean BMI (34.0±5.8 vs 33.0±6.6, p=0.31). The MetS group had greater mean hip circumference (118.5±13.4 vs 111.0±13.7), higher percentage of patients with moderate and high risk waist-to-hip ratio (28.0 and 56.5% vs 19.3 and 43.0% respectively) and lower percentage of patients with low risk waist-to-hip ratio (15.5% vs 37.7%; p<0.001; table 1).
Laboratory values
There were no significant differences in the laboratory test results between the MetS and no MetS groups in most liver function tests including AST, ALT, ALP and GGT. The MetS group had a slightly lower serum albumin level (4.17±0.39 vs 4.25±0.37, p=0.04). There was also no significant difference in other tests such as the constituents of lipid profile not included in the MetS definition such as low-density lipoprotein and total cholesterol. As expected the MetS group had significantly higher values of impaired fasting glucose and IR markers such as fasting glucose, fasting insulin, fasting C peptide and therefore higher HOMA-IR and QUICKI scores (table 2).
Laboratory value differences between NAFLD participants with and without metabolic syndrome
Surprisingly, patients in the no MetS group had significantly higher serum iron and transferrin saturation than the MetS group (table 2). Serum ferritin was also higher in the no MetS group, though not significant (no MetS: 301.5 vs MetS: 236.3 ng/mL, p=0.27).
Histological features
Overall, there were no significant differences between the MetS and no MetS groups with regard to mean NAS or many of the individual components such as steatosis location, lobular inflammation and ballooning scores or fibrosis stage (table 3). However, patients with MetS were more likely to have severe steatosis (32% vs 21%; p=0.04) and portal inflammation (85% vs 74%; p=0.01). In addition, patients with either HC iron present or RES iron present were almost half as likely to have MetS as those without HC or RES iron (OR=0.58 or OR=0.59, respectively, p=0.04). Though not significant, there were a lower proportion of patients with NAFLD, not NASH and a higher proportion with ‘definite NASH’ in the MetS group (19% (no), 20% (borderline), 61% (definite) vs 26% (no), 22% (borderline), 53% (definite); p=0.08) when comparing NASH diagnosis categories. After adjustment for demographic characteristics, patients with severe steatosis were 1.87 more likely to have MetS compared with those with mild steatosis (p=0.03).
Relationship between presence of MetS and other histological features among adults with non-alcoholic fatty liver disease
Independent discriminators of the presence of MetS using all demographic, anthropometric, clinical and laboratory measures and histological features (excluding those used to determine the MetS components) were: fewer smokers (OR=0.52, 95% CI 0.31 to 0.87, p=0.01), increased patients with obesity (OR=3.26, 95% CI 1.92 to 5.47, p<0.001), increased severe steatosis compared with those with mild (OR=2.99, 95% CI 1.02 to 3.90, p=0.045), though the overall p value for steatosis grade did not reach significance (poverall=0.06), and increased diagnosis of NASH, particularly definite compared with NAFLD, not NASH (OR=2.41, 95% CI 1.23 to 4.71, p=0.01, overall ptrend=0.02; model 2; table 4).
Relationship of demographic and anthropometric characteristics, laboratory biomarkers and histological features and presence of MetS among adults with NAFLD*
Relationship between NASH and the risk factors for MetS
Using the Cochran-Armitage trend test, we examined the relationship between the number of MetS features and a diagnosis of NASH. This test showed that the higher the number of MetS features, the greater the probability of a diagnosis of NASH (p=0.04; figure 1). Approximately, 70% of patients with a diagnosis of NASH had three or more MetS characteristics.
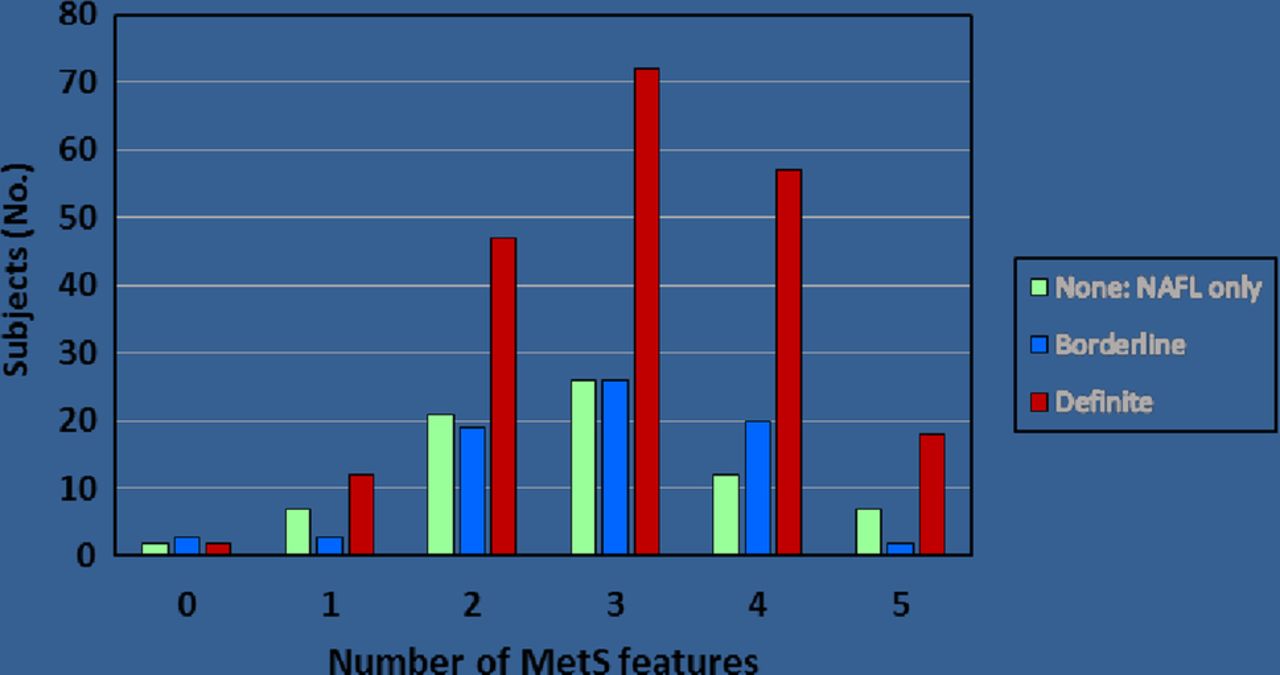
Significant trend towards increased number of MetS features according to the diagnosis of NASH (p=0.04). p Value was determined by Cochrane-Armitage trend test for ordered categories. This figure suggests that participants with one or more MetS features have significantly higher risk of having definitive NASH as compared with having simple fatty liver (NAFL). MetS, metabolic syndrome; NAFL, non-alcoholic fatty liver; NASH, non-alcoholic steatohepatitis.
On evaluating the relationship of each MetS risk factor with individual histological features, we noted that increased waist circumference and high blood pressure were associated with increased risk of portal inflammation while presence of advanced fibrosis and a diagnosis of NASH was more likely in those with hypertension (see online supplementary table S1).
supplementary data
Discussion
We examined the relationship between features of MetS, clinical, demographic and anthropometric and histologic features in a large US non-diabetic cohort with biopsy-proven NAFLD. Most previous studies on this topic have not excluded patients with diabetes and were limited by small samples sizes or the lack of uniform liver biopsy data subjected to central pathology review using well-established criteria.17–22 One study from New York involved 6814 participants including patients with diabetes and used CT to diagnose NAFLD. Liver biopsies were not performed to evaluate for steatohepatitis diagnosis.23 We excluded patients with diabetes because of the previously known association with NASH24 and the limited amount of previous data from North America on the link between MetS and IR (or prediabetes) and NASH. A previous similar study from Italy also examined the relationship between MetS and histological features of NAFLD.25 This study showed that the risk of having NASH was higher in patients with MetS, and in those with more features of MetS after correction for sex, age and BMI. These results are similar to our US cohort.9 ,10 To the best of our knowledge, our study is the largest US study to include histological evaluation of non-diabetic participants and subsequently evaluate the association of MetS with NASH.
Patients with NAFLD and MetS had significantly greater IR in our study. There was also a trend towards a higher prevalence of NASH among participants with MetS but the difference was not statistically significant (p=0.08). However, the likelihood of NASH was greater in patients with a higher number of MetS features. Furthermore, a multiple regression model which excluded the individual features of MetS showed that a diagnosis of definite NASH was an independent predictor of MetS (OR=2.41, p=0.01; table 4).
The total prevalence of MetS was 67% in this adult non-diabetic NAFLD cohort for our study as compared with 23% in the general adult US population based on National Health and Nutrition Examination Survey (NHANES) age-adjusted rates.26 Thus, a diagnosis of NAFLD is associated with an increased probability of having MetS and provides further support to include NAFLD as a hepatic manifestation of the MetS. The current study also confirmed the close link between obesity, MetS and NAFLD.19 ,27 Approximately 80% of patients with NAFLD with MetS were obese compared with only 50% of NAFLD participants without MetS. Conversely, obese participants with NAFLD had a higher probability of having MetS features and a higher likelihood of having a diagnosis of MetS.
In our study, MetS participants had a significantly higher association with severe steatosis and portal inflammation as compared with participants without MetS. This difference persisted when adjusted for age, sex, race, HOMA-IR and obesity. Prior studies have shown that presence of portal inflammation is associated with a significantly high risk of having advanced NAFLD features as compared with patients whose liver biopsies lack portal inflammation.28 ,29 MetS and its relationship with steatosis and portal inflammation is likely related to IR and its effect on hepatic lipogenesis30 and inflammatory mediators such as interleukin 6, tumour necrosis factor-α which activate Iκβ kinase and c-Jun N-terminal kinase which lead to necroinflammation in the liver.31
The strengths of our study include that the data were obtained from multiple centres using standardised protocols and collected according to uniform procedures. To the best of our knowledge, our study is the largest US-based study to include histological evaluation of non-diabetic NAFLD participants and thus evaluate the association of MetS with NASH. We were also able to show that MetS had a significant correlation with severe steatosis, chronic portal inflammation and even definite NASH if multiple regression models were used. An important strength of our study was that we excluded patients with diabetes. Since patients with NAFLD have a high prevalence of diabetes, it is more meaningful to evaluate MetS as a risk factor for NASH in a non-diabetic population.6
Our study showed that although patients with NAFLD without MetS may have lower IR, they do have higher HC and RES iron overload (table 3). Additionally, participants with lack of RES iron had a higher chance of having MetS based on multiple regression models (table 4). This may suggest that the pathway to progression to NASH in patients without MetS is possibly different as compared with MetS patients. This was also reported in another NASH CRN paper where the authors noted that there was an inverse relationship between HC iron and MetS risk factors.32 It is also possible that the pathogenesis of patients without MetS requires this ‘extra hit’ to progress to NAFLD. To the best of our knowledge, our study is the first study that has shown an increased iron overload in patients with NAFLD without MetS as compared with those with MetS.
Our study does have a few drawbacks. Our study used cross-sectional data, which preclude interpretations of causality. Since this was a prevalence study, this patient population could be helpful for a future study to evaluate the incidence of NASH and diabetes and their association with MetS. There was a higher prevalence of smokers in the no MetS group that could account for the high prevalence of NASH in that group since smoking has been associated with increased progression of NAFLD.33 Smoking can possibly increase risk of NASH by causing hypoxaemia similar to the pathogenesis of association between obstructive sleep apnoea and NASH.34 Future studies to evaluate the significance of this finding in our study will be helpful. There was also a higher prevalence of Hispanics in the no MetS group. Hispanic Americans have a high prevalence of a PNPLA3 variant that is associated with elevated hepatic fat and increased hepatic inflammation.35 In our study, adjustment was made for ethnicity/race to determine associations of MetS with histological features (table 3, adjusted models). Ethnicity/race was also included in the candidate set of the multivariable logistic model presented in table 4 and was not selected as an independent discriminator of MetS in patients with NAFLD.
In conclusion, this study found that in a large US non-diabetic cohort, NAFLD is associated with a high prevalence of obesity and MetS. There was a trend towards an association between NASH and MetS; in addition, patients with NAFLD with MetS were more likely to have severe steatosis and portal inflammation on liver biopsy. We conclude that patients with NAFLD with MetS are more insulin resistant even in the absence of diabetes and a recommendation of a liver biopsy to evaluate for NASH may be reasonable in these patients. This knowledge may lead to more aggressive management of the MetS risk factors and may lead to improvement in patient's liver disease. Treatment may include weight loss through diet and exercise, which could improve several components of the MetS. Moreover, recent studies have suggested that vitamin E and possibly pioglitazone may be helpful in reversing NASH in these patients without diabetes.36
References
Footnotes
Contributors PK was involved in analysing data, researching on the study and writing the paper. JEN was involved in designing of study and analysing data. KY collected and analysed the data. She also helped in writing the paper. DEK was involved in writing the paper. AU-A collected and analysed data. KVK (senior and corresponding author) was involved in design of study, analysing data and helped in writing the paper. All authors have approved the final version of manuscript. PK is the first author.
Funding The Nonalcoholic Steatohepatitis Clinical Research Network (NASH CRN) is supported by the National Institute of Diabetes and Digestive and Kidney Diseases (NIDDK) (grants U01DK061718, U01DK061728, U01DK061731, U01DK061732, U01DK061734, U01DK061737, U01DK061738, U01DK061730, U01DK061713). Additional support is received from the National Center for Advancing Translational Sciences (NCATS) (grants UL1TR000439, UL1TR000436, UL1TR000006, UL1TR000448, UL1TR000100, UL1TR000004, UL1TR000423, UL1TR000058). This research was supported in part by the Intramural Research Program of the NIH, National Cancer Institute.
Disclaimer The content is solely the responsibility of the authors and does not necessarily represent the official views of the National Institutes of Health.
Competing interests None declared.
Ethics approval Benaroya Research Institute IRB, Seattle, Washington, USA.
Provenance and peer review Not commissioned; externally peer reviewed.
Data sharing statement No additional data are available.