Article Text

Abstract
Objective IBS shows genetic predisposition, but adequately powered gene-hunting efforts have been scarce so far. We sought to identify true IBS genetic risk factors by means of genome-wide association (GWA) and independent replication studies.
Design We conducted a GWA study (GWAS) of IBS in a general population sample of 11 326 Swedish twins. IBS cases (N=534) and asymptomatic controls (N=4932) were identified based on questionnaire data. Suggestive association signals were followed-up in 3511 individuals from six case-control cohorts. We sought genotype-gene expression correlations through single nucleotide polymorphism (SNP)-expression quantitative trait loci interactions testing, and performed in silico prediction of gene function. We compared candidate gene expression by real-time qPCR in rectal mucosal biopsies of patients with IBS and controls.
Results One locus at 7p22.1, which includes the genes KDELR2 (KDEL endoplasmic reticulum protein retention receptor 2) and GRID2IP (glutamate receptor, ionotropic, delta 2 (Grid2) interacting protein), showed consistent IBS risk effects in the index GWAS and all replication cohorts and reached p=9.31×10⁻⁶ in a meta-analysis of all datasets. Several SNPs in this region are associated with cis effects on KDELR2 expression, and a trend for increased mucosal KDLER2 mRNA expression was observed in IBS cases compared with controls.
Conclusions Our results demonstrate that general population-based studies combined with analyses of patient cohorts provide good opportunities for gene discovery in IBS. The 7p22.1 and other risk signals detected in this study constitute a good starting platform for hypothesis testing in future functional investigations.
- IRRITABLE BOWEL SYNDROME
- GENETIC POLYMORPHISMS
- GENETICS
- GENE EXPRESSION
Statistics from Altmetric.com
Significance of this study
What is already known on this subject?
IBS is a functional GI disorder of high prevalence and largely unknown aetiology and pathophysiology.
A genetic component has long been recognised in IBS, but gene-hunting efforts have, thus far, been scarce.
What are the new findings?
We report the first genome-wide association study of IBS in a general population-based sample, with follow-up in multiple case-control cohorts.
We identified a suggestive locus at 7p22.1, with genetic risk effects replicated in all case-control cohorts.
The genes KDLER2 and GRIP2IP map to the associated locus, and genetic variation in this region modulates KDLER2 mRNA expression.
How might it impact on clinical practice in the foreseeable future?
Population-based cohorts with associated genetic and epidemiological data provide excellent opportunities to study the genetic architecture of IBS, and its potential relevance to disease pathophysiology.
Such genetic information may inform stratification of patients into different risk groups and allow for better targeted allocation of care.
Introduction
IBS is a functional GI disorder that manifests predominantly in women, with symptoms including abdominal pain, bloating, constipation (IBS-C), diarrhoea (IBS-D) or alternating constipation and diarrhoea (IBS-M, mixed type).1 IBS affects a considerable portion of the general population, impacting up to 10%–15% in Westernised countries, where it consumes 0.5% of the national healthcare budget.2 ,3 There is still very little understanding of IBS pathophysiology, and diagnosis is primarily based on structured symptomatic information established through expert consensus by the Rome Foundation.4 Most patients are managed in primary care where a more pragmatic approach to the diagnosis is used, however, reasonably well in accordance with the Rome criteria.5
IBS is likely a multifactorial disease, where hypervigilance of the central nervous system, mucosal immune activation, microbiome, prior infections and diet are all suspected to play a role.6 A heritable component has been demonstrated in epidemiological studies in families and twins7 and, more recently, in a nation-wide survey of the Swedish population where increased risk of IBS was detected among first, second and third degree relatives of IBS probands.8 However, gene-hunting efforts in IBS have thus far been rather scarce and largely limited to candidate gene approaches in small sample sets of cases and controls, which resulted in that no unequivocal IBS risk gene has been identified to date.9 Possibly, the TNFSF15 gene represents the only exception: we originally reported that genetic variation at the corresponding locus is associated with increased risk of IBS and, in particular, IBS-C in Swedish and US patients,10 and this has later been corroborated by similar findings in UK and Canadian case-control cohorts,11 ,12 and a recent meta-analysis.13
No genome-wide association study (GWAS) has been reported for IBS thus far. This may be due to the relatively small sizes of existing patient cohorts, and/or the difficulty in defining a common reliable study phenotype. Recently, we hypothesised that alternative approaches may include the study of large general population samples, where existing genotypical and phenotypical information may be exploited for gene-hunting efforts in IBS, with considerable gain in sample homogeneity and size.9 Here we report the use of data from the Screening Across the Lifespan Twin study (SALT)14 ,15 for the purpose of a GWAS of IBS, and the replication of findings in six independent case-control cohorts from collaborating centres in Sweden, Italy, USA, Belgium, Germany and Greece. In total, this study includes genotypical and phenotypical information from 14 837 individuals, and represents, by far, the largest gene-hunting effort ever conducted in IBS.
Materials and methods
Study subjects and patients material
Discovery population
The SALT study includes extensive epidemiological information for 45 750 Swedish twins, born in 1958 or earlier, who participated in telephone interviews conducted between 1996 and 2002.14 Among others, GI symptoms were recorded during the interview using an adapted version of the Rome criteria, which allowed individuals to be classified as patients with IBS.15 The definition of IBS based on this survey showed high reliability (κ=0.92) and 99% concordance with Rome II and an estimated 25% heritability in the very same population, which has been previously reported. We elected as controls SALT individuals who reported no bowel symptoms (negative answer to the question ‘Ever had recurrent abdominal problems’). As of 2012, GWAS genotyping data (see below) became available for 11 326 SALT twins, mostly dizygotic twins, and we included these in the current study. After exclusion of individuals with reported diagnosis of IBD (both Crohn's disease and ulcerative colitis), coeliac disease, peptic ulcer and GI cancer, we focused our analyses on 5466 independent singletons (534 IBS cases and 4932 asymptomatic controls). Where appropriate, individual twins were randomly selected from concordant pairs, while IBS cases were always preferred from discordant pairs. The demographics of the discovery sample are reported in table 1. Informed consent was obtained from the study participants, and the study was approved by the Ethical Committee of the Karolinska Institutet.
Demographic and clinical characteristics of the study individuals
Replication cohorts
Replication of GWAS findings was sought by studying six cohorts of Caucasian IBS cases and controls from collaborating centres in Sweden, Belgium, Italy, Germany, Greece and the USA. The Swedish multicentre cohort has been described in detail in our previous studies10 ,11 and consists of patients with IBS (Rome II/III criteria) recruited at secondary and tertiary care centres throughout the country, together with asymptomatic controls. The case-control cohorts from Leuven, Belgium, and from the Mayo Clinic in Rochester, USA, have also been extensively characterised and described in detail in previous studies.10 ,11 Patients with IBS (Rome II) and asymptomatic controls genotyped in Heidelberg, Germany, are from the Outpatients Departments of the University Hospitals of South Manchester (responsible PI Lesley Houghton), and have been recruited through local general practices, advertisement in regional newspapers and an existing departmental volunteer pool of patients. The Italian case-control material derives from a recently launched multicentre study (coordinator Giovanni Barbara, Bologna), which includes, in this study, IBS cases (Rome III) and asymptomatic controls enrolled at St Orsola-Malpighi Hospital in Bologna and at the Unit of Gastroenterology at the University of Pisa. Greek consecutive patients with IBS (Rome III) and asymptomatic controls were recruited at the Gastroenterology outpatients division of Evangelismos Hospital and Aretaieion Hospital, Athens between 2008 and 2013. The demographics and clinical characteristics of patients with IBS and controls included in the replication stage are reported in table 1. All centres received approval from their local and national institutional review boards, and informed consent was obtained from all participants.
Genotyping, quality control and statistical methods
Discovery GWAS
SALT individuals were genotyped using Illumina OmniExpress arrays, and imputation was carried out using MACH16 and the HapMap3 reference panel. Re-imputation with 1KG data was also performed, when searching for association with rare coding variants at the 7p22.1 locus. Single nucleotide polymorphisms (SNP) with genotype call rate <97% and/or a Hardy–Weinberg equilibrium (HWE) p<10−7 were excluded, together with individuals with >3% missing genotypes. This yielded a final number of 1 253 036 SNPs, 534 IBS cases and 4932 controls suitable for analysis after quality control (QC). We performed case-control association tests using an additive logistic regression model implemented in PLINK,17 including sex and the first six eigenvectors as covariates (QQ-plot and Manhattan plot are reported in online supplementary figure S1). This resulted in the identification of 42 independent association signals with common (minor allele frequency >0.01) SNPs at p<10−4 in SALT (see online supplementary figure S1). Among these, we selected 14 signals for follow-up based on manual inspection of individual regional linkage disequilibrium (LD) plots and at least one of the following: (1) presence of multiple SNP association hits at the same locus; (2) overlap with coding genes and/or their regulatory regions (promoters); (3) presence of coding SNPs among the best hits.
Replication
SNPs selected for replication were genotyped in case-control cohorts on the Sequenom MassARRAY platform with iPLEX chemistry. Two SNPs (one lead and one ‘backup’ proxy, r2>0.8), from each region were genotyped with average success rates 99.77%, 99.17%, 99.90%, 99.80%, 99.83% and 99.89%, for Sweden, Belgium, Italy, Germany, Greece and the USA, respectively, and did not significantly deviate from HWE (cut-off p<10−3), while none of the 3511 individuals included in the follow-up analyses had more than 5% missing genotypes. The replication analysis was carried out using an additive logistic regression model implemented in PLINK with sex and country of origin as covariates.
Meta-analysis
The meta-analysis was performed in PLINK using the inverse variance-based method, and the command –meta. This approach weights the effect estimates (β-coefficent from the discovery and replication set) by their SE estimates (SE) and calculates an overall OR and p value.
Purcell's online power calculator (http://pngu.mgh.harvard.edu/~purcell/gpc/) has been used to estimate the number of IBS cases and controls necessary to reach genome-wide level significance for the 7p22.1 region, based on corresponding summary statistics from GWAS, replication and meta-analysis.
eQTL and functional prediction analyses
We used Genevar (http://www.sanger.ac.uk/resources/software/genevar)18 to retrieve information relative to expression quantitative trait loci (eQTLs) associated with genetic variation in the region of interest (between KDELR2 and GRID2IP), and used LocusZoom (http://csg.sph.umich.edu/locuszoom)19 to plot these data in relation to LD between SNPs. KDELR2 and GRID2IP gene (mRNA) expression profiles in different anatomical tissues were obtained from interrogation of public data accessible via the Genotype-Tissue Expression portal (GTEx; http://www.broadinstitute.org/gtex).20 For the analysis of coexpression with KDELR2 we adopted a two-step strategy taking advantage of the Genevestigator search engine (http://www.genevestigator.com).21 This is a high-performance search engine for gene expression, integrating thousands of manually curated public microarray data and RNA seq experiments. A list of genes showing coregulated expression with KDELR2 was obtained by screening 35 000 gene expression microarray experiments and selecting genes with a correlation coefficient r>0.6 across the Perturbations dataset. This gene list was then used with the gene functional classification tool DAVID 6.7 (http://david.abcc.ncifcrf.gov)22 in order to identify KDELR2-relevant enriched biological pathways according to gene ontology terms (GO; http://www.geneontology.org). This type of analysis was not possible for GRID2IP, since its expression was extremely low in all tissues tested, and no genes showed GRID2IP coregulation under the computational constraints applied in our protocol (r>0.06 against Perturbations in Genevestigator).
Analysis of KDELR2 intestinal mRNA expression
Rectal mucosal biopsies from 16 patients with IBS and 12 asymptomatic healthy controls were collected during flexible sigmoidoscopy and stored in RNALater at −80°C until total RNA extraction with Qiagen RNeasy kits, including a step of genomic DNA digestion with DNAse for 30 min. cDNA was prepared with qScript cDNA SuperMix kit (Quanta Biosciences) according to the manufacturer's protocol, and quantitative real-time PCR (qPCR) was performed using TaqMan gene expression assays (Applied Biosystems) for KDELR2 (Hs01061971_m1) and the house-keeping gene β-actin (ACTB, FW: 5′-ACTCCATCATGAAGTGTGA; REV: 5′- GGCAGTGATCTCCTTCTG; probe FAM-BHQ1 5′-TGTACGCCAACACAGTGCTG) in a Roche Lightcycler 96 with automated colour compensation, using default thermocycling conditions. PCRs were performed in triplicate for each gene on the same sample, and expression values normalised for the endogenous control ACTB. Gene expression was calculated with the comparative ΔCt method for relative quantification23 and expressed as fold changes (arbitrary units) relative to a randomly chosen reference control sample.
Results
IBS GWAS in the SALT population
We used Illumina OmniExpress genotype (750 K) data available for 11 326 twins from the SALT study, in order to conduct a pilot GWAS of IBS in this sample representative of the general Swedish population. SALT IBS cases were ascertained through the use of recorded GI symptoms from questionnaire data, and by using a definition previously shown to have κ=0.92 and 99% concordance with Rome II and an estimated 25% heritability in the very same population.15 HapMap3 CEU imputation and QC filtering (see the Materials and methods section), generated genotypes suitable for association testing at a total of 1 253 036 SNP markers in 5466 independent singletons, corresponding to 534 IBS cases and 4932 asymptomatic controls. GWAS analysis of IBS risk in this sample set resulted in the identification of several markers with p<1×10⁻⁴, which mapped to 42 independent (LD-pruned) genomic regions as reported in online supplementary figure S1A–C. However, none of these regions reached genome-wide significance (p<5×10⁻⁸).
Replication in independent case-control cohorts and meta-analysis
In order to assess whether any of the identified associated regions can be considered a true risk locus for IBS susceptibility, we sought for follow-up assessment in a replication study. Based on manual inspection of association data and regional LD plots from each of the 42 associated regions (see the Materials and methods section), 14 signals were selected for follow-up (table 2 and see online supplementary figure 1C) and two SNPs (1 lead, 1 proxy) from each risk locus were genotyped in 1718 IBS cases and 1793 controls from six additional independent cohorts from centres in Sweden, Italy, Belgium, Germany, Greece and the USA (see online supplementary table S1 and supplementary methods). Follow-up tests for association resulted in the replication of GWAS results for one region on chromosome 7p22.1, where both SNPs at the corresponding locus (rs12702514 and rs13222291) gave rise to nominally significant findings (table 2 and see online supplementary table S1). In particular, as shown in figure 1 for rs12702514, risk alleles at both SNPs showed similar genetic effects with identical direction of association in all tested populations. The 7p22.1 signal also resulted in improved statistical evidence of association after a meta-analysis was performed combining index GWAS and replication data: Pmeta for rs12702514=5.45×10⁻⁶; Pmeta for rs13222291=1.02×10⁻⁵ (table 2 and see online supplementary table S1). Subtype-specific analyses (IBS-C and IBS-D were tested) did not disclose any specific pattern of preferential association within this region (data not shown).
GWAS, replication and meta-analysis summary statistics for lead SNPs from selected regions
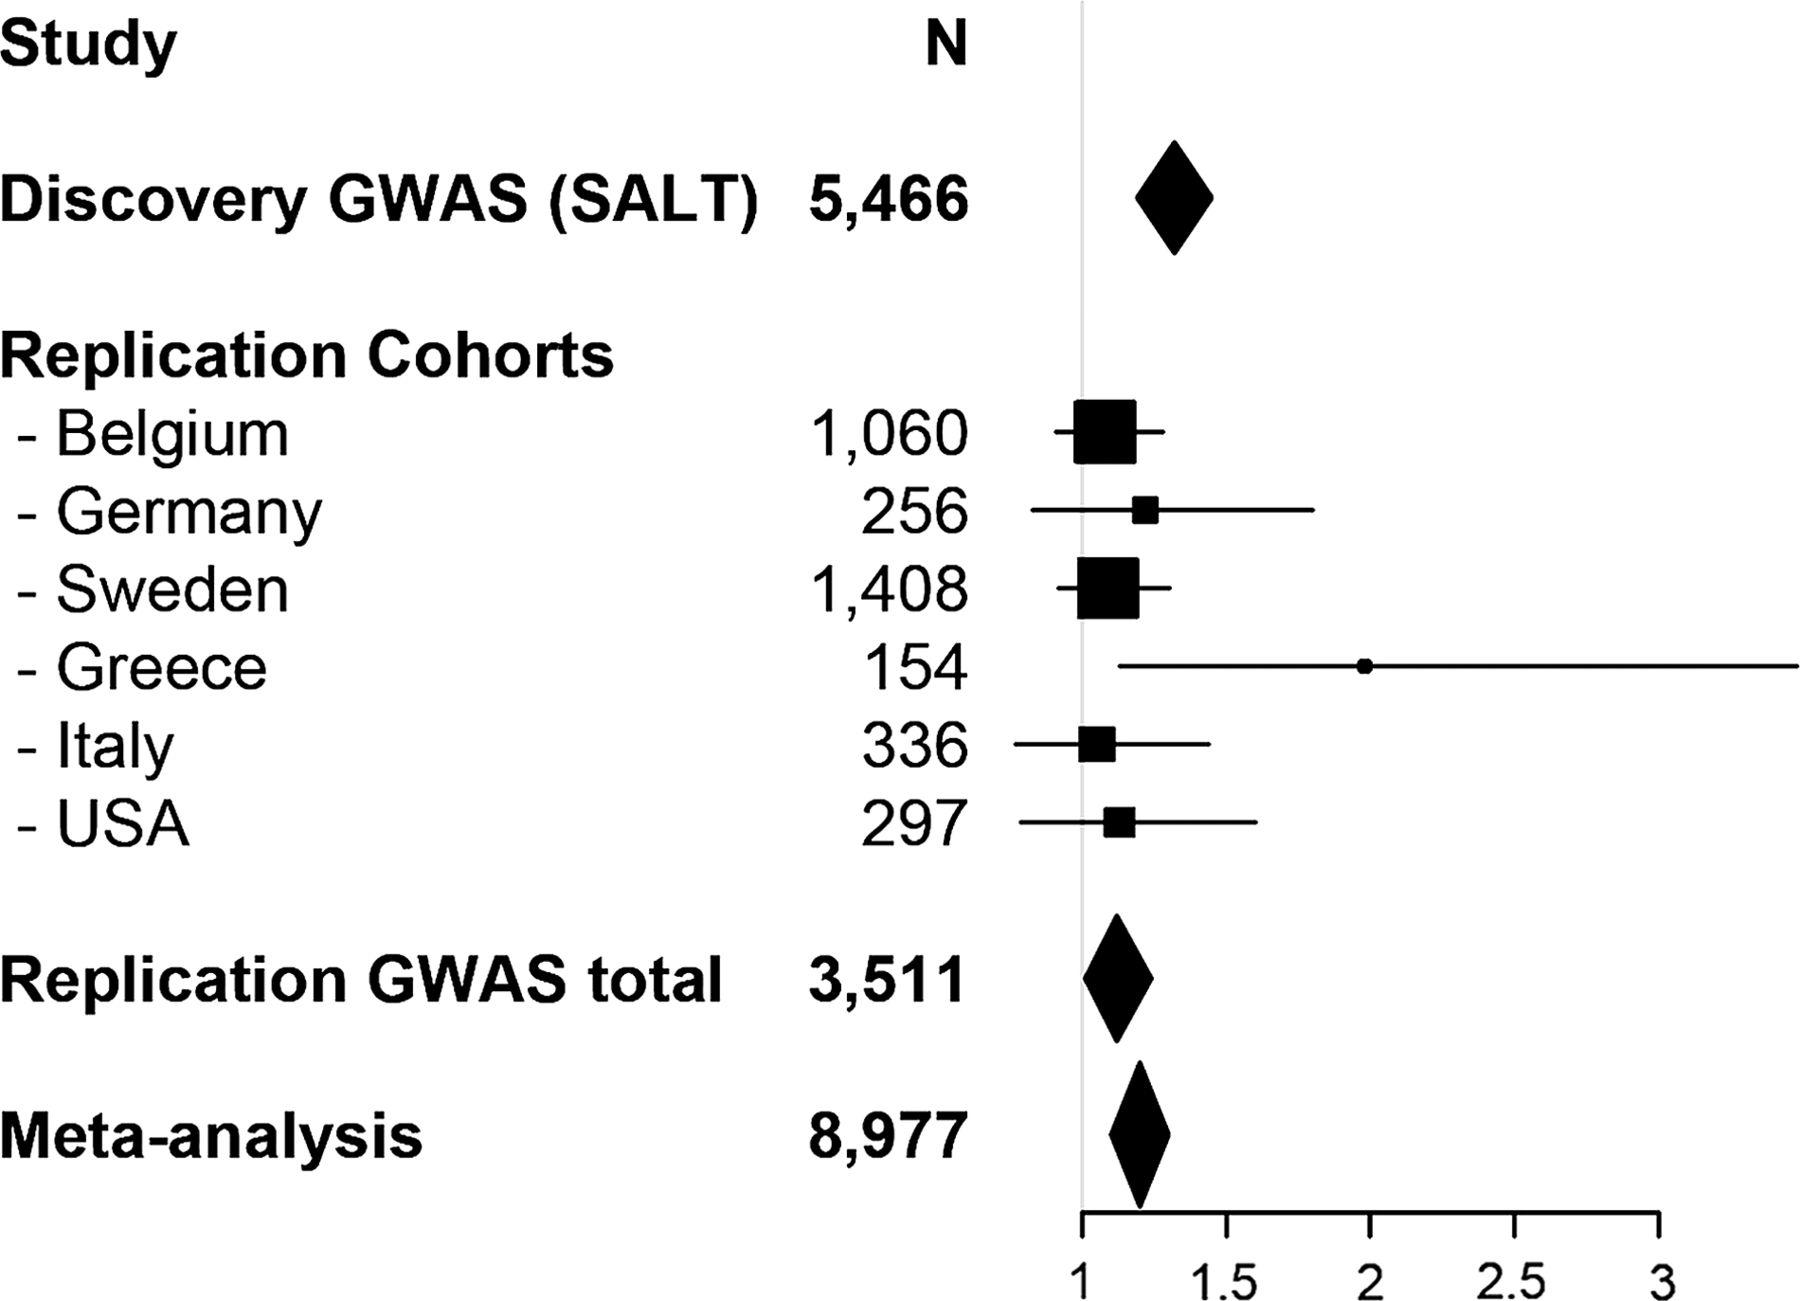
Forest plot of the association between IBS and marker rs12702514. Shown are the individual and cumulative ORs and 95% CI for the samples included in the study, as indicated, together with the sample size for each single and total cohort.GWAS, genome-wide association study; SALT, Screening Across the Lifespan Twin study.
Gene content and genetic risk effects at the 7p22.1 risk locus
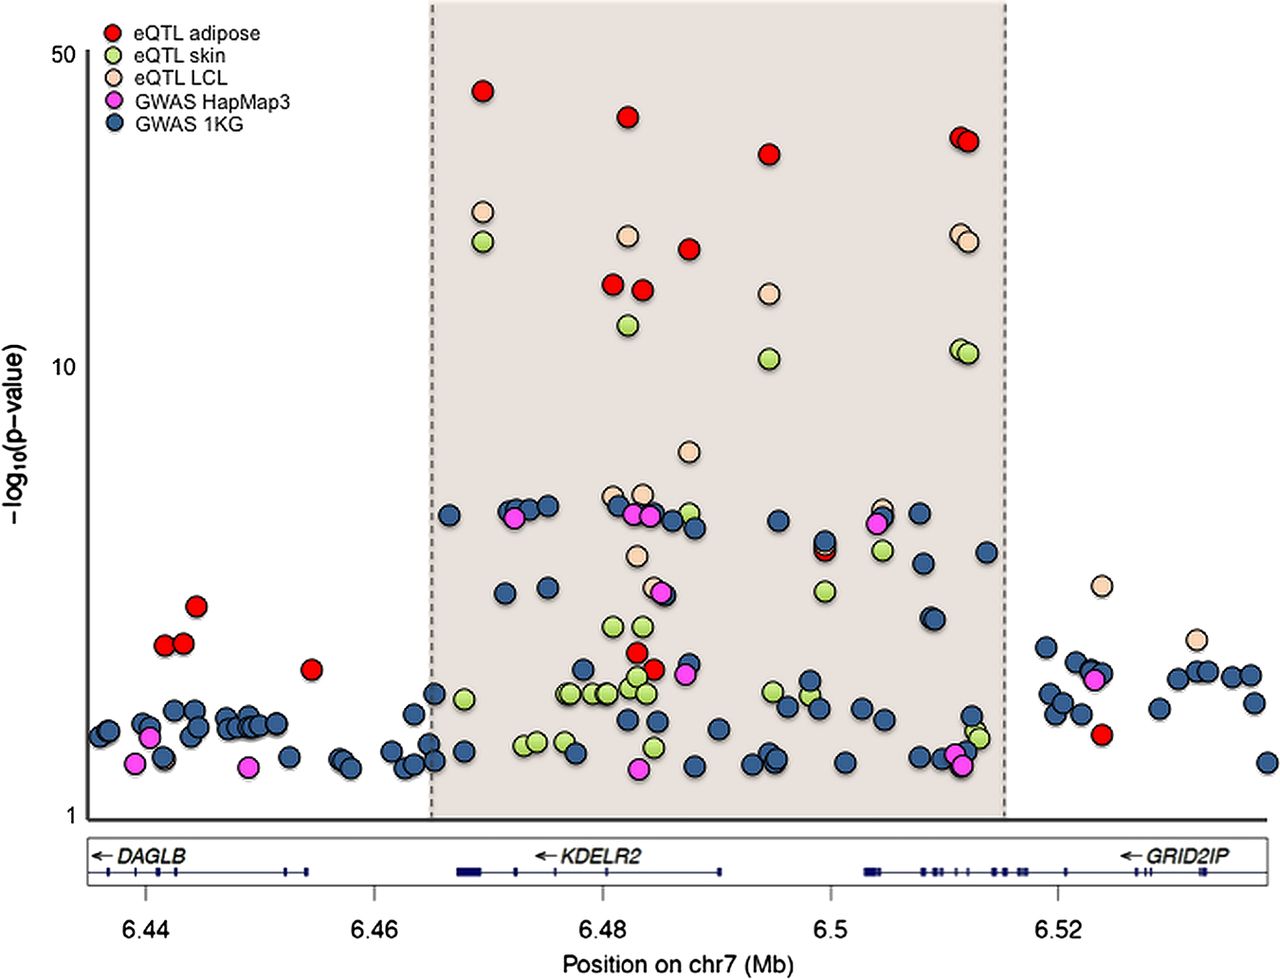
As from the SALT GWAS analysis, the peak of association at the 7p22.1 locus maps primarily to a 100 Kb region overlapping with two genes: the whole coding region of the KDEL receptor 2 gene (KDELR2) expressed in all human tissues (see online supplementary figure S2A) and the last two exons of the gene for the glutamate receptor—ionotropic—delta 2 interacting protein (GRID2IP) expressed in the brain (see online supplementary figure S2B). In order to identify biological mechanisms potentially responsible for the observed association, we sought to evaluate the functional relevance of genetic risk effects on the coding (protein) properties and on gene (mRNA) expression. While further supporting the association with multiple SNP hits in the region (see online supplementary figure S3), retesting association at the 7p22.1 locus after reimputation with 1 KG (1000 genomes) reference data did not disclose any specific signal due to common or rare missense SNPs (not shown). This suggested that causative links may be better sought at the regulatory level through eQTL analyses. For this purpose, we performed genotype-gene expression correlation analyses using the cis-eQTL—Gene function at the online GENe Expression VARiation platform (Genevar, http://www.sanger.ac.uk/resources/software/genevar), and screened TwinUK data for SNP-eQTL interactions at the 7p22.1 locus. Remarkably, several SNPs in this region were associated with cis effects on KDELR2 expression consistently across all tested tissues (adipose, skin and lymphoblastoid cell lines), including the GWAS and replication markers rs12702514 and rs13222291, where risk alleles correlated with increased KDLER2 mRNA levels (see online supplementary table S2). Also of note, association signals from GWAS and eQTL analyses perfectly overlapped in 7p22.1 region, providing further evidence that modulation of KDELR2 gene expression may be a potential mechanism by which genetic variation at this locus affects IBS risk. This is summarised in figure 2, where GWAS (HapMap3 and 1 KG) and eQTL findings for this locus are reported.

Regional plot of expression quantitative trait loci (eQTL) and genome-wide association study (GWAS) p values for the chromosome 7p22.1 region. eQTL- single nucleotide polymorphism (SNP) correlations were sought by using Genevar (http://www.sanger.ac.uk/resources/software/genevar) and three datasets available for lymphoblastoid cell lines (LCL), skin and adipose tissue, which are shown with different colour-coded symbols in the figure. GWAS statistics based on CEU HapMap3 or 1KG imputation relative to the selected region are also reported, with colour-coded symbols as indicated. For best representation of the results, −log10 (p values) are reported on a logarithmic scale, and the specific region of overlap containing the strongest eQTL and GWAS association signals is highlighted.
Analysis of KDELR2 expression in IBS cases and controls
While GRID2IP is only detectable in the brain, KDELR2 is ubiquitously found in all tissues tested, and thus allows for comparative analyses of its mucosal expression in the GI tract of patients with IBS and controls. For this purpose, we performed real-time qPCR relative quantification of KDELR2 mRNA levels in rectal mucosal biopsies of 16 IBS cases and 12 healthy controls and detected a non-significant trend for increased KDLER2 expression among IBS cases (figure 3).

KDELR2 mucosal expression in IBS cases and controls. Rectal biopsies from patients with IBS and healthy individuals were used to measure mucosal KDELR2 mRNA expression with quantitative real-time PCR (TaqMan), which is reported in fold changes (average plus SEM) relative to a reference sample arbitrarily chosen among the controls (CTRL).
In silico prediction of KDELR2 function
The biological function of the product of the KDELR2 gene is not known. DNA and protein sequence homology with other members of the KDEL receptor family, in particular KDELR1, suggests KDELR2 may play a role in vesicle trafficking and transport into the endoplasmic reticulum (ER). In order to gain initial insight into its predicted function, we adopted a strategy to identify (1) genes showing KDELR2 coregulated expression and (2) biological processes and cellular functions associated with these genes. We screened publicly available microarray data from 35 000 gene expression experiments using the Genevestigator search engine (http://www.genevestigator.com) and identified 32 genes showing KDELR2 coregulated expression with correlation coefficient r>0.6 across the Perturbations dataset (see online supplementary table S3). We then used this gene list to interrogate the database of GO terms (http://www.geneontology.org) with the functional classification tool, DAVID 6.7 (http://david.abcc.ncifcrf.gov), in order to identify KDELR2-relevant enriched biological pathways. Confirming its putative function, this analysis resulted in the identification of ‘endoplasmic reticulum’ and ‘ER-Golgi intermediate compartment’ as top enriched Cellular Components, and ‘establishment of protein localization’ and ‘protein transport’ among the biological processes (see online supplementary table S4).
Previous IBS associations in the SALT GWAS
A number of candidate genes have been implicated in IBS and related traits (intermediate phenotypes) in the past through findings of nominal significance (information annotated at http://www.bellygenes.org), and we thus also explored our SALT GWAS data at these loci. The results are reported in table 3, and are interesting at least for some genes in that a few association signals of nominal significance are observed within the same loci. For instance, CDC42, HTR3E, IL1R1, IL4, KLB, may represent better candidates for future replication efforts in additional studies, while we recently independently replicated the SCN5A locus in four additional case-control cohorts.24
GWAS association signals for previously reported IBS risk genes
Discussion
We reported here the first large genome-wide effort to identify genetic determinants of IBS risk. By adopting a two-step strategy, we screened a large general population sample by means of a GWAS, and followed-up association signals in six independent clinical case-control cohorts from different countries. A locus on chromosome 7p22.1 consistently showed genetic risk effects in the same direction in all seven tested sample sets, although it still did not reach genome-wide significance in the meta-analysis of combined index and replication findings. Given the risk allele frequency (rs12702514 T=0.41) and the observed effect on IBS risk (OR from meta-analysis=1.2; 95% CI 1.13–1.30), at least 4500 IBS cases and an equal number of asymptomatic controls would be required to achieve 80% statistical power to detect association at 7p22.1 with genome-wide significant p<5×10⁻⁸. A DNA bank of this size is currently not available in the IBS scientific community, hence, the GWAS data and consistent replication across multiple cohorts reported here represent the best evidence one can currently collect for this locus.
Two genes, namely KDLER2 and GRIP2IP, map to chromosome 7p22.1, and our eQTL data mining efforts suggest that genetic variation at this locus may affect IBS risk through the modulation of gene expression. While GRID2IP is found at detectable levels only in the brain, we were able to provide preliminary support to this evidence for KDELR2, by detecting a trend towards higher rectal mucosal expression in IBS cases compared with asymptomatic controls. Given the association signal is also primarily overlapping with KDELR2, this makes it a candidate stronger than GRID2IP to play a role in IBS. The product of the KDELR2 gene belongs to a family of receptors whose best-characterised member is KDELR1, a widely expressed integral membrane protein with seven transmembrane domains.25 KDELR1 (also known as human ERD2, hERD2) binds Lys-Asp-Leu-Glu (KDEL) and Arg-Asp-Leu-Glu (RDEL) amino acid motifs of target proteins and mediates their retrograde transport to the ER.25–27 Of note, some toxins from enterovirulent bacteria also contain such motifs, including the A-fragment of cholera toxin (CTA) from Vibrio cholerae, the heat labile toxin LT1 produced by Escherichia coli and Pseudomonas exotoxin A, which require KDELR1 binding and ER targeting in their intracellular signalling pathway to cause secretory diarrhoea (CTA and LT1) or cell death (exotoxin A).28–30 KDELR2 (also known as ELP-1) appears to have similar motif-binding properties,31 and our in silico analysis of its putative function also strongly suggests that it may have a biological function very similar to KDELR1. Given the emerging role of host-microbiota interactions in IBS, it is, therefore, tempting to speculate that genotype-driven variations in KDELR2 expression may affect IBS predisposition through mechanisms similar to those ascribed to KDELR1, that is, in mediating the effects of bacterial toxins in the gut.
Although poorly characterised, GRID2IP polymorphism may also affect IBS risk. This gene encodes delphilin, a PDZ domain-containing protein that is expressed in fiber-Purkinje cell synapses in the brain, where it is known to bind the ionotropic glutamate receptor δ2 (GluRδ2)32 ,33 and the monocarboxylate transporter 2 (MCT2).34 Both interactants are plausible candidates for potential involvement in the central and local nervous mechanisms that are suspected to play a pathophysiological role in IBS. Abnormal function of glutamatergic neurotransmission has been reported in patients with IBS,35 whereas, dietary glutamate might be one of the excitotoxins contributing to IBS symptoms exacerbation.36 MTC2 is also expressed on enteric neurons, where it has been shown to mediate the uptake of butyrate and other short-chain fatty acids produced in the gut lumen by resident bacteria, with induction of neurochemical coding plasticity and increased proportion of cholinergic neurons, and therefore increased colonic motility.37 If delphilin function is relevant to MCT2 also in the enteric nervous system, then GRID2IP functional polymorphisms may impact IBS risk by affecting host-microbiota interactions in relation to gut motility.
Our analyses were also considered in relation to the IBS candidate risk genes previously reported in a number of studies (annotated at http://www.bellygenes.org). TNFSF15, which has been consistently replicated in IBS, only showed nominal significance in the SALT GWAS (table 3). Variation in this gene has been associated with IBS and its subphenotypes in a series of case-control cohorts from secondary and tertiary referral centres from Sweden, USA, UK and Canada.10–12 While increased immune-activation has been proposed as a mechanism to explain the observed association of TNFSF15 risk variants with IBS,9 it is likely that corresponding genetic effects may be diluted and more difficult to detect at the general population level, where classification into IBS cases and controls is solely dependent on self-reported bowel symptoms from a questionnaire. As shown in online supplementary table S4, association signals of nominal significance were detected for other genes, including CDC42, HTR3E, IL1R1, IL4, KLB and SCN5A which eventually showed better evidence of non-spurious findings. While IL1R1 maps within the SNP rs12712124 locus that failed replication (table 2 and see online supplementary table S1), the SCN5A signal was followed-up and replicated in an independent investigation that appeared in press before the current study.24 Thus, although it is difficult to weight nominally significant association findings against the plethora of such GWAS signals, our results may be useful to eventually shortlist previous underpowered associations for further replication in independent cohorts in future studies.
IBS is a particularly complex and heterogeneous phenotype, which hampers gene-hunting efforts and requires the use of extremely large sample sizes. While the total discovery sample was of such large size (N=11 326), the actual set of GWA-studied IBS cases and asymptomatic controls was of considerably reduced size (534 and 4932, respectively), hence, our results need to be taken with caution as proof-of-principle evidence, and the association with the KLDER2_GRID2IP locus confirmed in additional cohorts. Nevertheless, the results presented here underscore the validity of our two-step approach, with discovery analyses performed in a general population sample, and replication efforts carried out in several independent case-control cohorts from GI-clinics. Hence, population-drawn discoveries may be achieved by increasing sample size and minimising recruitment bias, while targeted genetic association studies in well-phenotyped patients indispensable downstream to validate GWAS findings, confirm their clinical relevance, and attempt to elucidate the pathophysiology behind genotype–phenotype relationships. In addition to the 7p22.1/KDELR2 locus replicated in six independent cohorts, SCN5A, the gene coding for the α-subunit of the voltage-gated sodium channel NaV1.5, is also a good example of this principle: we detected a nominal association signal at this locus in our GWAS, which we were prompted to follow-up, and hence replicate in additional case-control cohorts when rare, experimentally validated loss-of-function mutations were independently identified in a small fraction of patients with IBS from the Mayo Clinic, Rochester, USA.24 Such a ‘re-discovery’ of disease-associated genes fuels confidence in our general population-based GWAS approach, and suggests that both rare and common variants contribute to the genetic architecture of IBS, eventually from the same loci, like in the case of SCN5A.
In summary, we report here the first population-based GWAS of IBS and suggest that similar cohorts with associated genetic and epidemiological data may provide excellent opportunities to study the genetic architecture of IBS and related GI symptoms. The risk signals detected in this study, and therefore the potential causative role of the corresponding risk loci, can be consolidated in additional similar studies and their meta-analyses.
List of URLs
Purcell's online power calculator, http://pngu.mgh.harvard.edu/~purcell/gpc/
Genevar, http://www.sanger.ac.uk/resources/software/genevar
LocusZoom, http://csg.sph.umich.edu/locuszoom
'Genotype-Tissue Expression portal, GTEx; http://www.broadinstitute.org/gtex
Genevestigator, http://www.genevestigator.com
Gene functional classification tool DAVID 6.7, http://david.abcc.ncifcrf.gov
Gene ontology, http://www.geneontology.org
Bellygenes, http://www.bellygenes.org
Acknowledgments
The excellent technical assistance of Elisabeth Dungner is greatly acknowledged. We wish to thank all the patients and the healthy volunteers who participated in this study. GlaxoSmithKline supported the patient recruitment and clinical data collection for a subset of individuals used in this study. We thank Dr George Dukes and Dr Rachel Gibson (GlaxoSmithKline), and Prof Claus Bartram for logistic support.
References
Supplementary materials
Supplementary Data
This web only file has been produced by the BMJ Publishing Group from an electronic file supplied by the author(s) and has not been edited for content.
Files in this Data Supplement:
- Data supplement 1 - Online figures
- Data supplement 2 - Online tables
Footnotes
WEE and AR contributed equally.
SR, BN, MZ, NVR and PTS contributed equally.
Contributors WEE, SR, PTS, MJD and MDA: study concept and design; WEE, SR, AR, MZ, NVR, MJD, MMW, MDA: statistical analyses; BN, NLP, PM, GR, BB, HS, GA, LL, EP, MMW, MDA: genotyping; WEE, SR, AR, MZ, NVR, BN, PTS, NLP, PM, NJT, EGH, LeH, MG, GK, GR, BB, HS, JR, GA, LL, EP, DG, SM, RC, RB, PK, SW, BO, HT, FB, AA, AD, MS, LA, GL, GB, MB, VS, GB, MJD, MC, MW, MDA: data collection, analysis and interpretation of data, critical revision of the manuscript for intellectual content and statistical analysis; MDA: obtained funding, administrative, technical, or material support, study supervision; MDA, WEE, AR: drafting of the manuscript. All authors were involved in the interpretation of the data; revision of the manuscript; and the decision to submit the manuscript for publication. All authors vouch for the completeness and accuracy of the data and analysis as well as the fidelity of the study to the protocol.
Funding This work was supported by funds from the Swedish Research Council to MD (VR 2010-2976) and the Medical Faculty of the University of Heidelberg to BN. GB was funded by a governmental grant (Odysseus programme, G·0905·07) of the Research Foundation—Flanders (FWO). MMW is supported by a FWO postdoctoral fellowship.
Competing interests None.
Ethics approval Regional Ethics Committees and Karolinska Institutet, Stockholm, Sweden.
Provenance and peer review Not commissioned; externally peer reviewed.