Article Text

Abstract
Objectives Characterise the circulating inflammatory cytokine pattern among patients failing consecutive anti-tumour necrosis factor (anti-TNF) and anti-integrin treatments to identify predictors of response.
Methods A retrospective single-centre cohort study of 28 patients with inflammatory bowel disease (IBD) receiving anti-integrin therapy (vedolizumab) subsequent to the failure of anti-TNF treatment was conducted. Blood samples were obtained immediately prior to initiation of vedolizumab therapy, and the response to treatment was evaluated after completion of the 14-week induction regimen. Multiplex ELISA was applied to quantify 47 preselected plasma proteins based on their putative involvement in the inflammatory process in IBD.
Results Anti-TNF and vedolizumab non-responders (n=20) had significantly higher levels of circulating interleukin (IL)-6 than anti-TNF non-responders with subsequent response to vedolizumab (n=8): median 9.5 pg/mL versus 5.9 pg/mL, p<0.05. Following stratification by diagnosis, patients with Crohn’s disease who failed vedolizumab therapy (n=7) had higher soluble CD40 ligand (sCD40L) than responders (n=4): 153.0 pg/mL versus 45.5 pg/mL, p<0.01; sensitivity 100% (95% CI 59% to 100%), specificity 100% (95% CI 40% to 100%). Osteocalcin was higher among patients with ulcerative colitis responding to vedolizumab (n=4) compared with those not responding (n=13): 4219 pg/mL versus 2823 pg/mL, p=0.01; sensitivity 85% (95% CI 55% to 98%), specificity 100% (95% CI 40% to 100%).
Conclusions Patients with IBD failing vedolizumab induction and anti-TNF therapy have persistent IL-6 pathway activity, which could be a potential alternative treatment target. sCD40L, osteocalcin and the IL-6 pathway activity might be predictors for response to vedolizumab.
- Ibd
- gastrointestinal immune response
- crohn’s disease
- ulcerative colitis
This is an Open Access article distributed in accordance with the Creative Commons Attribution Non Commercial (CC BY-NC 4.0) license, which permits others to distribute, remix, adapt, build upon this work non-commercially, and license their derivative works on different terms, provided the original work is properly cited and the use is non-commercial. See: http://creativecommons.org/licenses/by-nc/4.0/
Statistics from Altmetric.com
Summary box
What is already known about this subject?
A significant proportion of patients with inflammatory bowel disease (IBD) do not respond adequately to vedolizumab, an observation that is in line with other biological therapies like the tumour necrosis factor (TNF) inhibitors.
Prediction of response to vedolizumab therapy prior to initiation of therapy is currently not possible.
Multiple inflammatory pathways drive IBD, indicating that both ulcerative colitis (UC) and Crohn’s disease (CD) are heterogeneous conditions.
What are the new findings?
In this pilot study, we identified interleukin-6 to be a potential marker of non-response to vedolizumab in anti-TNF non-responsive patients with IBD.
Soluble CD40 ligand and osteocalcin are additionally identified as potential markers for vedolizumab responsiveness in CD and UC, respectively.
How might it impact on clinical practice in the foreseeable future?
Identifying predictors of response to vedolizumab therapy in patients with IBD might enable clinicians to personalise therapy based on the individual patient’s inflammatory profile.
Introduction
Treatment of inflammatory bowel disease (IBD) has been revolutionised by the introduction of therapeutic antibodies against tumour necrosis factor (TNF)-α. However, more than half of patients are refractory to this treatment or lose effect over time.1–3 Within recent years, an effective alternative to anti-TNF treatment has become available with the advent of the integrin-targeting antibody, vedolizumab, a monoclonal anti-α4β7 integrin antibody.4 5 Vedolizumab binds to α4β7 expressed on a subset of primed gut-homing T-lymphocytes. The direct blocking and later endocytosis of α4β7 prevents lymphocyte adherence and diapedesis through the mucosal vascular addressin cell adhesion molecule (MAdCAM)-1 selectively expressed on gut endothelium.6 7 Restriction of leucocyte diapedesis thereby limits intestinal immune cell infiltration and inflammation in both ulcerative colitis (UC) and Crohn’s disease (CD).4 5 8 9 Vedolizumab is used both as a first-line biological in IBD, but most frequently as second or third-line biological therapy in patients failing anti-TNF therapy. Although clinical trials with vedolizumab have proven efficacy in IBD, both with and without previous failure to anti-TNF therapy, some patients will not respond to treatment (primary non-responders). The risk of primary non-response is—as with other biologicals—higher among patients previously exposed to biologicals compared with bio-naïve patients.10 11
Initial lack or subsequent loss of response to biological therapy may be affected by: (1) non-immune-mediated pharmacokinetic issues due to insufficient drug doses resulting in inadequate tissue concentrations for proper drug efficacy; (2) immune-mediated pharmacokinetic issues with development of antidrug antibodies causing rapid degradation of the drug and/or allergic reactions; or (3) pharmacodynamic issues characterised by predominant inflammatory pathways not being targeted by the drug.12 13 With the observation of generally adequate circulating vedolizumab through levels for full target occupancy during ongoing therapy, lack of treatment efficacy is most likely due to pharmacodynamic rather than pharmacokinetic issues.14 On the contrary, successful reports of dose escalation due to lack of response following 6 weeks or 8 weeks of vedolizumab therapy indicates that pharmacokinetics and trough levels are important parameters influencing response.15 16
To explore this matter, and to identify markers for effectiveness of vedolizumab therapy, this pilot study was conducted to investigate the pattern of key circulating inflammatory mediators in all available patients with IBD following failure to anti-TNF therapy and prior to initiation of vedolizumab therapy at our East Danish IBD centre. All patients were subsequently classified as responders or non-responders to vedolizumab, and these groups were compared.
Methods
Study population
This retrospective single-centre cohort study included all available patients refractory to one or more anti-TNF therapies who were subsequently initiated on vedolizumab in the period from the approval of vedolizumab until end of 2016. A blood sample was obtained prior to initiation of vedolizumab therapy (median 8 days prior to first vedolizumab administration, IQR 0–14 days). Ongoing inflammation was confirmed by endoscopy prior to initiation of vedolizumab in all except four patients (86%), supported by clinical disease activity score in all patients (for UC median Mayo score 6, IQR 6–8.5, and for CD median Harvey-Bradshaw Index (HBI) 10, IQR 8–14).17 18 The disease activity defined by the Mayo score was: a score below 2 (no subscore above 1): inactive; 3–5: mild; 6–10: moderate; and 11–12: severe UC;, and the HBI: a score of 0–4: inactive; 5–8: mild; 9–16: moderate; and >16: severe CD.
Effect of vedolizumab was evaluated at week 14, that is, at the end of the induction phase, based on changes in the disease activity indices mentioned above for UC and CD, respectively. As some patients with CD have been reported to have an extended response time to vedolizumab, the evaluation period of these partial responding patients was extended until week 20 to allow a clear determination of response. Based on this procedure, three partial responding patients with CD obtained adequate effect of vedolizumab and were characterised as responders.4 5 11 Thus, primary non-response for patients with UC was defined as a total Mayo score decrease of ≤2 points (or <30%) from baseline, with a rectal bleeding score decreased by 0 or an absolute rectal bleeding score >1. For patients with CD, primary non-response was defined as a decrease of ≤2 points from baseline. Measurements of individual predefined plasma proteins were compared between vedolizumab responders and non-responders in the IBD cohort. The statistical evaluation of the patients was initially performed collectively for patients with IBD to increase statistical power in the limited dataset. The patients were afterwards segregated based on diagnosis into patients with UC and CD.
Disease characteristics and demographic data of patients, divided by response to vedolizumab
Blood sampling
Peripheral venous blood samples were drawn in EDTA (Greiner Bio-One, Kremsmünster, Austria). Samples were centrifuged at 2500 g for 5 min at ambient temperature to obtain plasma, which was aliquoted and stored at −80°C until analysis.
Multiplex ELISA
Measurements of plasma proteins were conducted in duplicate using two separate Bio-Plex Pro plates (Bio-Rad Laboratories, Hercules, California, USA) without freeze/thaw cycles. The applied plates were the Bio-Plex Pro Human Inflammation Panel 1, 37-Plex (171AL001M) measuring: APRIL/TNFSF13, BAFF/TNFSF13B, sCD30/TNFRSF8, sCD163, chitinase-3-like 1, gp130/sIL-6Rβ, IFN-α2, IFN-β, IFN-γ, IL-2, sIL-6Rα, IL-8, IL-10, IL-11, IL-12 (p40), IL-12 (p70), IL-19, IL-20, IL-22, IL-26, IL-27 (p28), IL-8A/IFN-λ2, IL-29/IFN-λ1, IL-32, IL-34, IL-35, LIGHT/TNFSF14, MMP-1, MMP-2, MMP-3, osteocalcin, osteopontin, pentraxin-3, sTNF-R1, sTNF-R2, TSLP and TWEAK/TNFSF12 as well as the Bio-Plex Pro Human Th17 Cytokine Panel 15-Plex (171AA001M) measuring: IL-1β, IL-4, lL-6, IL-10, IL-17A, IL-17F, IL-21, IL-22, IL-23, IL-25, IL-31, IL-33, IFN-γ, sCD40L and TNF-α. Sample preparation was carried out according to the manufacturer’s recommendations. Measurements were performed on the Bio-Plex 200 instrument and the Bio-Plex Manager software, V.6.0 (Bio-Rad). In the case of overlapping analytes between the plates, the 37-plex was used for the analyses.
Measurements were included in the analysis when lying within the range of detection as specified by the manufacturer. Results were based on the performed standard curve spanning from lower level of quantification to upper level of quantification, while intra-assay coefficients of variation were below 20%. All concentrations are expressed in pg/mL after correcting for dilution. In total, 47 fully or partially measured plasma proteins were included in the analysis, however, with ‘IL-27 (p28)’ and ‘LIGHT’ being below detection limit.
Independent cohort from public database
From the GEO database (www.ncbi.nlm.nih.gov/geo/), the GSE73661 study was extracted. That study contains microarray expression data from inflamed colonic intestinal biopsies of patients with UC prior to initiation of vedolizumab. Data were generated using the Human Gene 1.0 ST array (Affymetrix, Santa Clara, California, USA) and were normalised (robust multichip average) as described in the study entry. Patients were separated based on the reported clinical efficacy of vedolizumab induction therapy, and selected transcripts were evaluated using Mann-Whitney U tests as described below.
Statistics
The statistical modelling tools, principal component analysis (PCA) and orthogonal projections to latent structures discriminant analysis (OPLS-DA), were initially performed on all data in an attempt to catch separating trends in the multidimensional dataset (performed in R, V.3.3.3, using the ‘Ropls’ package). As no models could be established using this approach, a conventional comparison of responders and non-responders was performed using the two-tailed non-parametric Mann-Whitney U tests of continuous variables (performed in R) to identify group differences. Calculation of receiver operating characteristic (ROC) curve statistics and demographic data was performed in GraphPad Prism (GraphPad Software (V.7), La Jolla, California, USA). Error bars represent median values with IQR. Statistical significance was defined as a p value below 0.05.
Results
Study population
The demographic data of the study population is presented in table 1. Responders and non-responders to vedolizumab were overall comparable, except that among patients with CD a higher disease score and higher levels of C reactive protein (CRP) were observed among non-responders than in responders. Additionally, patients with CD responding to vedolizumab were older than non-responders, and responders in general (UC and CD collectively) had longer disease duration than non-responders.
PCA and OPLS-DA analysis
Initial PCA analysis and subsequent OPLS-DA calculation were performed on the entire dataset for identifying predictive principle components for separation of responders and non-responders to vedolizumab induction treatment. This was done both in patients with IBD and subsequently in patients stratified by UC or CD, respectively. These calculations were, however, unable to generate any models for this separation based on the measured plasma proteins.
Deregulated plasma protein levels in vedolizumab responders versus non-responders with IBD
Circulating interleukin (IL)-6 in plasma was significantly higher among non-responders than in responders to vedolizumab induction therapy: median 9.5 pg/mL versus 5.9 pg/mL, p<0.05. Furthermore, osteocalcin was higher in responders compared with non-responders: median 3627 pg/mL versus 2832 pg/mL, p=0.01 (figure 1). Additionally, a weak trend of higher plasma levels of soluble gp130 among responders was observed (median 17 630 pg/mL vs 15 719 pg/mL, p=0.09).
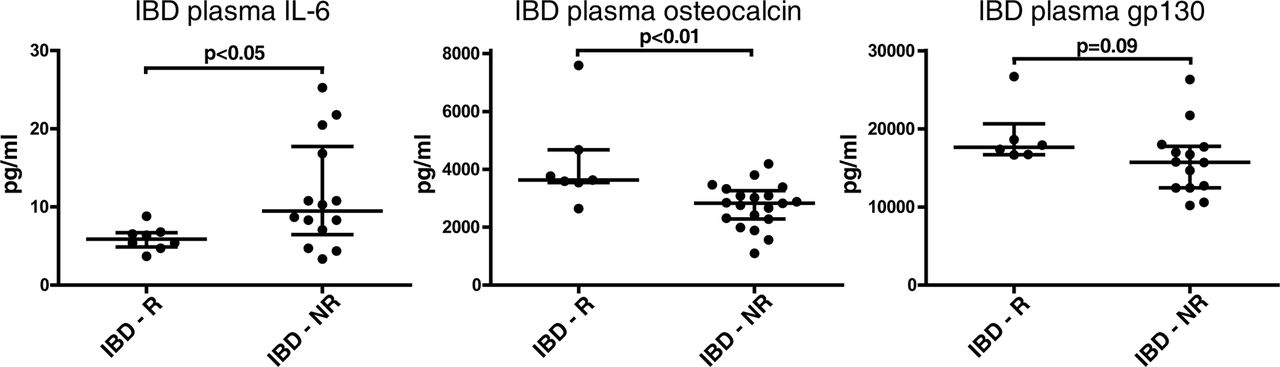
Plasma protein levels in responders and non-responders in patients with IBD. The two plasma proteins IL-6 and osteocalcin were found at significantly different levels among patients with IBD responding to vedolizumab as compared with non-responders. Although gp130 was not statistically significantly deregulated, it showed a trend for higher levels among responders. IBD, inflammatory bowel disease; IL-6, interleukin-6; NR, non-responders; R, responders.
Deregulated plasma protein levels in vedolizumab responders versus non-responders with UC or CD
Circulating plasma protein levels between vedolizumab induction responders and non-responders among patients with UC or CD, respectively, was additionally explored. The soluble CD40 ligand (sCD40L) was higher in non-responding patients with CD (153.0 pg/mL vs 45.5 pg/mL, p<0.01), whereas osteocalcin was higher in responders with UC (median 4219 pg/mL vs 2823 pg/mL, p=0.01) (figure 2).

Plasma protein levels in responders and non-responders in patients with CD and UC, respectively. In CD, soluble CD40 ligand (sCD40L) was measured in higher levels among non-responders to vedolizumab, and a higher level of osteocalcin was observed in patients with UC responding to vedolizumab. CD, Crohn’s disease; NR, non-responders; R, responders; UC, ulcerative colitis.
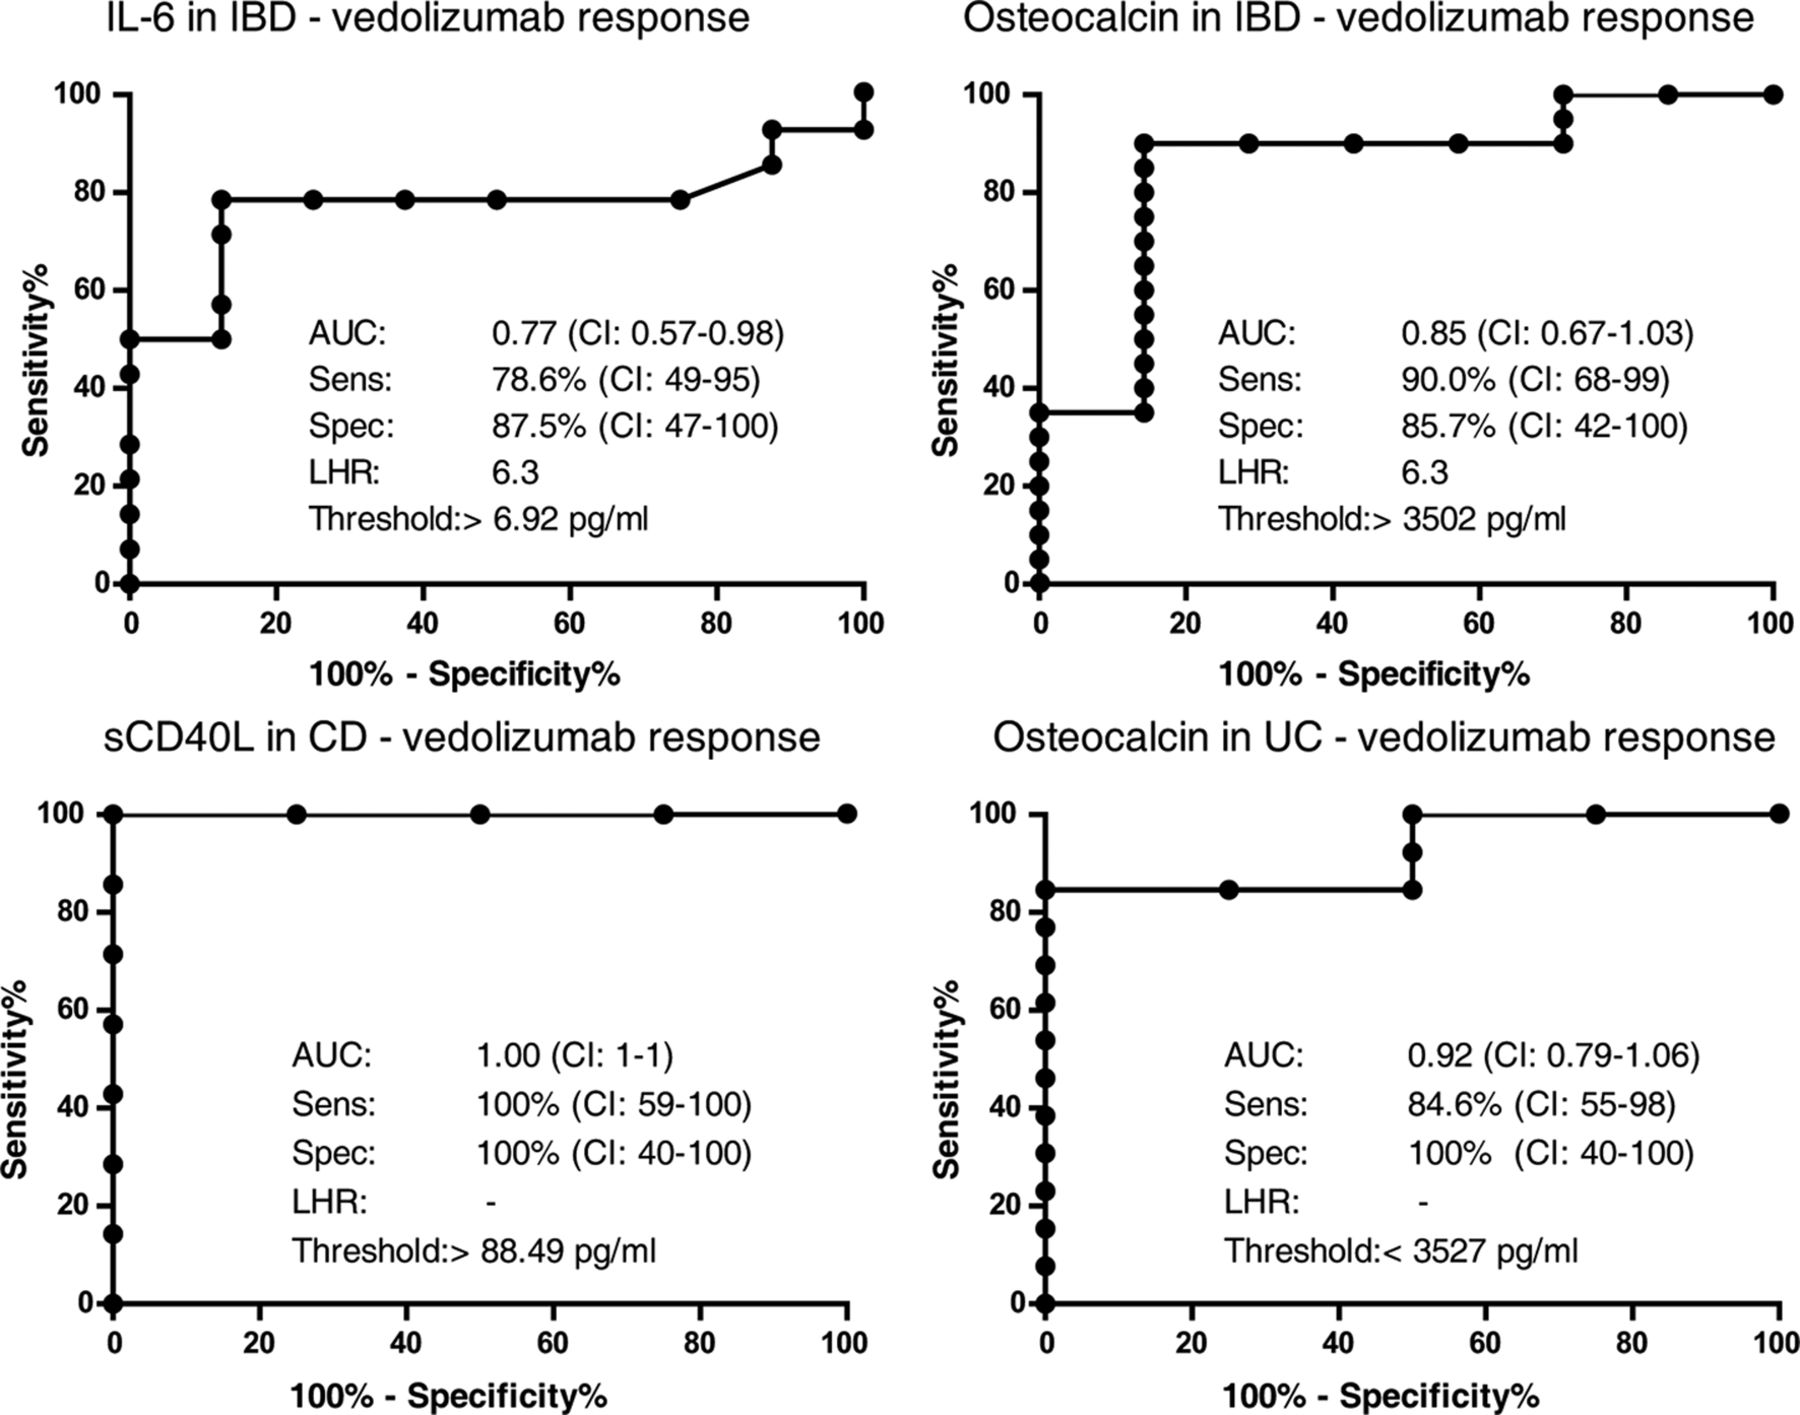
Using ROC curve statistics, the ability of the identified plasma proteins to predict response to vedolizumab was evaluated. Figure 3 shows the results, including area under the curve (AUC), the applied threshold, the calculated sensitivity and specificity, as well as the likelihood ratio for each of the four identified plasma proteins. When evaluating the identified disease-specific markers, sCD40L provided a complete separation of CD responders from non-responders (AUC=1, sensitivity 100% (95% CI 59% to 100%), specificity of 100% (95% CI 40% to 100%)), whereas osteocalcin provided a model for separating UC responders and non-responders to vedolizumab (AUC=0.92, sensitivity 85% (95% CI 55% to 98%), specificity 100% (95% CI 40% to 100%)) (figure 3).
Comparing plasma biomarkers for predicting response to vedolizumab using ROC curve statistics. The ability of the four identified markers for predicting response to vedolizumab was tested. By calculation of area under the curve (AUC), sensitivity (sens), specificity (spec) and likelihood ratio (LHR), the ability of IL-6 and osteocalcin to predict response to vedolizumab in patients with IBD was assessed. Furthermore, sCD40L and osteocalcin were evaluated in patients with CD and UC, respectively. CD, Crohn’s disease; IBD, inflammatory bowel disease; IL-6, interleukin-6; ROC, receiver operating characteristic; sCD40L, soluble CD40 ligand; UC, ulcerative colitis.
Confirmatory data from an independent cohort
Transcriptomic microarray data from colonic biopsies from bio-naïve patients with UC prior to vedolizumab initiation, with information on subsequent response, was available through the Gene Expression Omnibus database accession number GSE73661.19 The patients were classified as responders (n=10) or non-responders (n=26) at later follow-up. Using this dataset, we confirmed an upregulation of IL-6 among non-responders (median 6.8, IQR 5.2–7.9) as compared with responders (5.3; 4.9–6.4) (p<0.05) (Log2 expression values). Nevertheless, osteocalcin, sCD40L and gp130 were equally expressed among responders and non-responders to vedolizumab induction therapy in this dataset.
Discussion
Some patients with IBD on biological therapy, both with anti-TNF and anti-integrins, fail treatment over time.1 2 10 20 Making an active decision to change class of therapy or to apply add-on therapies is therefore important for targeting the specific disease driving pathways in clinical settings.21–23 In the current single centre pilot study, all included patients were refractory to TNF inhibitors, indicating that TNF-α is not the primary inflammatory pathway in this cohort. By the current approach, we aimed to identity alternative drivers of inflammation and to assess the predictability of responsiveness to vedolizumab in IBD based on plasma samples—a routinely obtained and easily analysable approach in daily practice.
Plasma measurements provide a fingerprint of released inflammation-related mediators and those resulting from spillover from the inflamed intestine, thus being influenced by disease severity and spatial extension. As a central inflammatory mediator, IL-6 is involved in immune cell activation, recruitment and the acute phase response.24 Along with higher circulating levels of IL-6 among non-responders to vedolizumab, we observed a trending increase of gp130 in responders as compared with non-responders (figure 1). IL-6 and gp130 are inter-related as transmembrane gp130 complexes with the IL-6 receptor (IL-6R) to form the functional IL-6R complex. Signalling mediated by IL-6 can occur through two mechanisms: (1) direct signalling via the IL-6R complex occurs on cells expressing the IL-6R. In these cells, IL-6 induces proinflammatory effects, promoting cellular activation, recruitment and survival.25 Furthermore, IL-6 is known to be important for T helper (Th) 1-mediated intestinal inflammation.26 27 (2) Alternative IL-6 signalling, or transactivation, occurs when IL-6 binds soluble IL-6R originating from proteolytic receptor cleavage or from alternative splicing.28 The circulating IL-6/IL-6R complex can subsequently bind the ubiquitously expressed gp130 and induce IL-6-like signalling in cells not expressing the IL-6R. Soluble gp130 can bind the formed IL-6/IL-6R complex and antagonise the IL-6 transactivation.29 This point has already been confirmed in vitro and in IBD with increased levels of soluble gp130.30 In experimental colitis, disease severity is additionally alleviated by gp130 administration.31 The complexity of IL-6 signalling during inflammation, however, makes any definite conclusions elusive. Our finding that primary non-responders to vedolizumab have increased levels of IL-6 and trending lower levels of soluble gp130 as compared with responders indicates an overall increased IL-6 pathway activity, both via the classical and the alternative pathways, and also by a limited antagonistic capacity. Nevertheless, the biological significance of this observation needs to be confirmed and explored in other and larger cohorts.
Previous findings of elevated IL-6 levels in anti-TNF refractory patients indicate a role for IL-6 in TNF-α-independent inflammation.32 33 In addition, enhanced mucosal gene expression of IL-6 was observed in a dataset from bio-naïve patients with UC being non-responders to vedolizumab.19 This is of special interest, since the IL-6 pathway by definition has not been targeted by any prior anti-TNF treatments among the patients studied, thus suggesting that patients with hyperactive IL-6 signalling may favourably be treated using non-TNF, non-α4β7 integrin blocking strategies. This finding might further be supported by a recent study in IBD as well as experimental colitis showing that inflammation involving the cytokine oncostatin M and IL-6 is capable of driving a TNF-independent intestinal inflammation.33 34
Whereas several studies have evaluated the effects of blocking IL-6 signalling during inflammatory conditions, including the compounds tocilizumab, C326, olokizumab, clazakizumab, and PF-04236921, only two studies have so far investigated this matter successfully in IBD, specifically in CD. Here positive effects on disease severity and induction of remission were observed as compared with controls.35 36 This observation might support the involvement of IL-6 in anti-TNF and anti-integrin refractory inflammation.
In the present study, higher levels of sCD40L were observed in non-responders to vedolizumab (figure 2). The functions of the CD40/CD40L-axis and its specific relation to IBD have previously been extensively reviewed.37 Briefly, CD40L is expressed on activated T cells but can also be expressed by additional immune cells upon inflammatory stimulation and activation.38–40 It interacts with CD40 expressed by a variety of immune and non-immune cells, especially antigen-presenting cells, where it induces general cellular activation and cytokine secretion.37 41 42 In IBD, an augmented mucosal expression of both CD40 and CD40L was observed together with increased levels of circulating sCD40L.43–48 In two in vivo models, antibody-mediated blockage of CD40/CD40L effectively alleviated inflammation. These studies emphasise the importance of CD40L signalling in the pathogenesis of IBD, as targeting this signalling may prevent Th1 T cell priming.49 50 In fact, we found sCD40L to be increased in non-responders as compared with responders in CD only, which is classically described as a Th1-driven disease versus the Th2-driven UC. This observation supports the notion of an impact on Th1-driven inflammation and might additionally indicate a more aggravated immune activation in the group of non-responders to vedolizumab revealed in this study.46 47
As predictive parameters for vedolizumab response, we evaluated IL-6 and osteocalcin for IBD, and sCD40L and osteocalcin for CD and UC, respectively, as depicted in figure 3. The best surrogate markers for vedolizumab response were the disease-specific markers, presenting predictive models with high AUC values in this cohort. Besides sCD40L, as described above, osteocalcin is synthesised by osteoblasts and is a marker for bone formation that correlates with bone mineral density, although the past decade has provided evidence for endocrine functions of osteocalcin in glucose and energy homeostasis.51 52 The measurement of higher osteocalcin levels among responders might indicate a less severe and/or shorter duration of the inflammation as compared with non-responders, and thus a sparring of the bones. A specific influence of osteocalcin on the inflammatory process does not appear to exist.
The present cohort, where 20 of 28 patients (71%, 95% CI 51.3 to 86.8) were non-responders, might not reflect the efficacy of vedolizumab in general.4 5 10 53 This is due to the fact that all of the included patients had previously failed at least one biological agent and that some patients had been waiting for vedolizumab to reach the market (Q2 in 2014) before initiation of this therapeutic approach. Failures to biologicals are well-known hard-to-treat patients, and treatment responses to any biological in this cohort are expected to be low.3 54 Along with a low sample size, this might explain the rather high rate of non-responders in the present study. In patients showing partial response to vedolizumab induction therapy, a shortened dosing interval of one or several doses was initiated to ensure adequate drug levels, although these were not measured. Half the patients received dose(s) at shorter intervals as recommended by a previous study.15
The existence of non-responders points to the presence of yet alternative pathways driving inflammation and immune cell recruitment in patients with IBD who are unresponsive to anti-TNF and anti-α4β7 treatments. It appears that hindering of leucocyte recruitment using vedolizumab through α4β7–MAdCAM-1 blocking may allow compensation of immune cell diapedesis through additional integrin systems, at least in some patients. These include: leucocyte VLA4 (α4β1) binding to endothelial vascular cell adhesion molecule (VCAM)-1, leucocyte αEβ7 binding to epithelial E-cadherin, and leucocyte LFA-1 (αLβ2) binding to endothelial intercellular adhesion molecule (ICAM)-1 and 2.55–57 Thus, compensatory regulation of homing molecules may lead to both a maintained leucocyte infiltration and potentially to changes in intestinal leucocyte populations with yet unknown consequences for the disease course in non-responders to vedolizumab.
In the sparse published attempts to predict response to vedolizumab, a combination of baseline clinical parameters and microbial taxonomy data yielded predictive models for UC, CD and IBD, all with AUC values above 0.85 (sensitivity >85%, specificity >75%).58 A related study based on clinical variables and faecal calprotectin following 6 weeks of treatment could predict (AUC value 0.73 (95% CI 0.65 to 0.82)) steroid-free remission at week 52.59 Another study has shown that a lower baseline frequency of α4β7-positive CD4 T cell in patients with IBD was associated with clinical response to vedolizumab. Additionally, this study revealed that expressional changes in T cell α4β1 at week 6 of vedolizumab treatment could predict the response at week 14 with both a sensitivity and a specificity of 100%.57 On the contrary, another study found higher basal α4β7 expression on CD4 and CD8 T cells as well as natural killer cells from responders compared with non-responders. It was additionally shown that saturation of the α4β7 receptor during maintenance therapy could be a potential marker for vedolizumab response.60 Finally, mucosal gene expression profiles from responders and non-responders were evaluated, but these were unable to predict the response to vedolizumab in UC.19
Identification of predictive markers for response to vedolizumab or other biologicals might significantly improve the treatment strategy of this group of patients by limiting inefficient therapeutic approaches. With the resulting economic benefits and, importantly, improved guidance of effective therapy, such markers could reduce the duration of flaring disease and lower the risk for surgical intervention among these patients. Identification of prognostic markers for response to therapy still lies in academia, although progress is being made as detailed above.
Our study has some important limitations. Although all available patients were included in this East Danish single-centre study, the sample size was limited. The initial evaluation was performed in patients with IBD collectively to increase power of the calculations. Accordingly, we believe that the findings presented need to be considered exploratory and that validation of our findings needs to be confirmed in larger and independent patient cohorts. As a selected set of a priori known inflammation-related markers were chosen in the present exploratory study, correction for multiple testing was not performed. Within the study population, we observed a somewhat higher HBI score and elevated CRP levels among patients with CD and vedolizumab treatment failure, which induces a risk for disease severity as a confounding factor for the observed differences of plasma protein levels (table 1). However, the fact that we were able to confirm the main findings in another and larger cohort of bio-naïve vedolizumab-treated patients19 strongly substantiate the validity of the novel results provided here. Future studies should include endoscopic evaluation of the patients after vedolizumab induction therapy and should in addition include mucosal healing as a parameter for response. Blood sampling following the vedolizumab induction therapy should also be considered to verify normalisation of the identified markers in patients responding to the therapy.
In conclusion, this exploratory study indicates that the IL-6 signalling pathway may play an important role in driving persistent inflammation in anti-TNF and anti-integrin refractory patients with IBD. Furthermore, it seems that circulating levels of IL-6, sCD40L, and osteocalcin may represent possible predictors of later response to vedolizumab therapy in IBD. These observations, however, need to be confirmed in larger and independent cohorts.
Acknowledgments
The authors want to thank Elisabeth Margrethe Danielsen for assistance in chart reviews.
References
Footnotes
Contributors CaS, JBS and OHN provided access to the study material and conceived the broad scope of the project. ChS analysed the data and drafted the manuscript in close collaboration with the remaining authors. All authors have read and approved the manuscript.
Funding The applied ELISA plates for the study were sponsored by Takeda Pharmaceuticals as part of the unsolicited, independent Investigator Initiated Sponsored Research (IISR) programme.
Competing interests None declared.
Patient consent Not required.
Ethics approval The retrospective cohort study was approved by the Scientific Ethics Committee of the Copenhagen Capital Region (H-16026084) and the Danish Data Protection Agency (HGH-2016–077).
Provenance and peer review Not commissioned; externally peer reviewed.
Data sharing statement All cytokine measurements not included in the study are available. The data may be accessed by the investigators.